Build an Onboarding Toolkit Your SaaS Can Reuse Across Industries
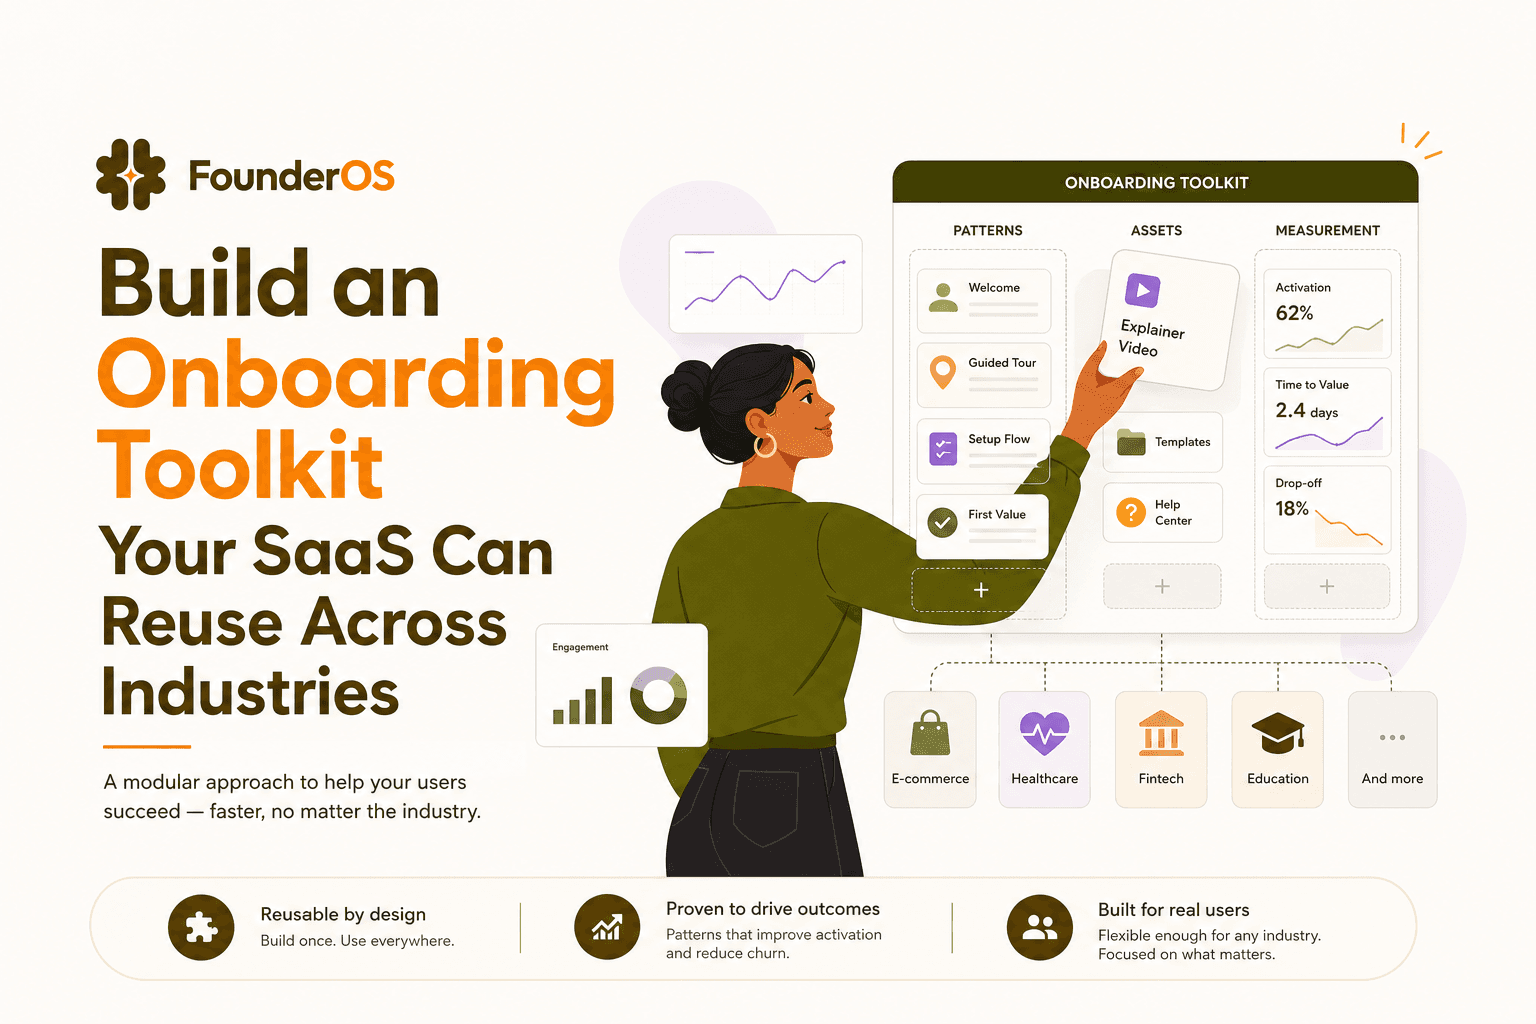
An effective onboarding toolkit is not a single product tour. It is a reusable system of patterns, assets, and instrumentation that shortens time-to-first-value across roles, segments, and even different industries, without rebuilding onboarding from scratch each time you change your ICP or ship a new feature.
- Standardize the system: combine reusable patterns, copy blocks, and tracking so onboarding is deployable, not handcrafted.
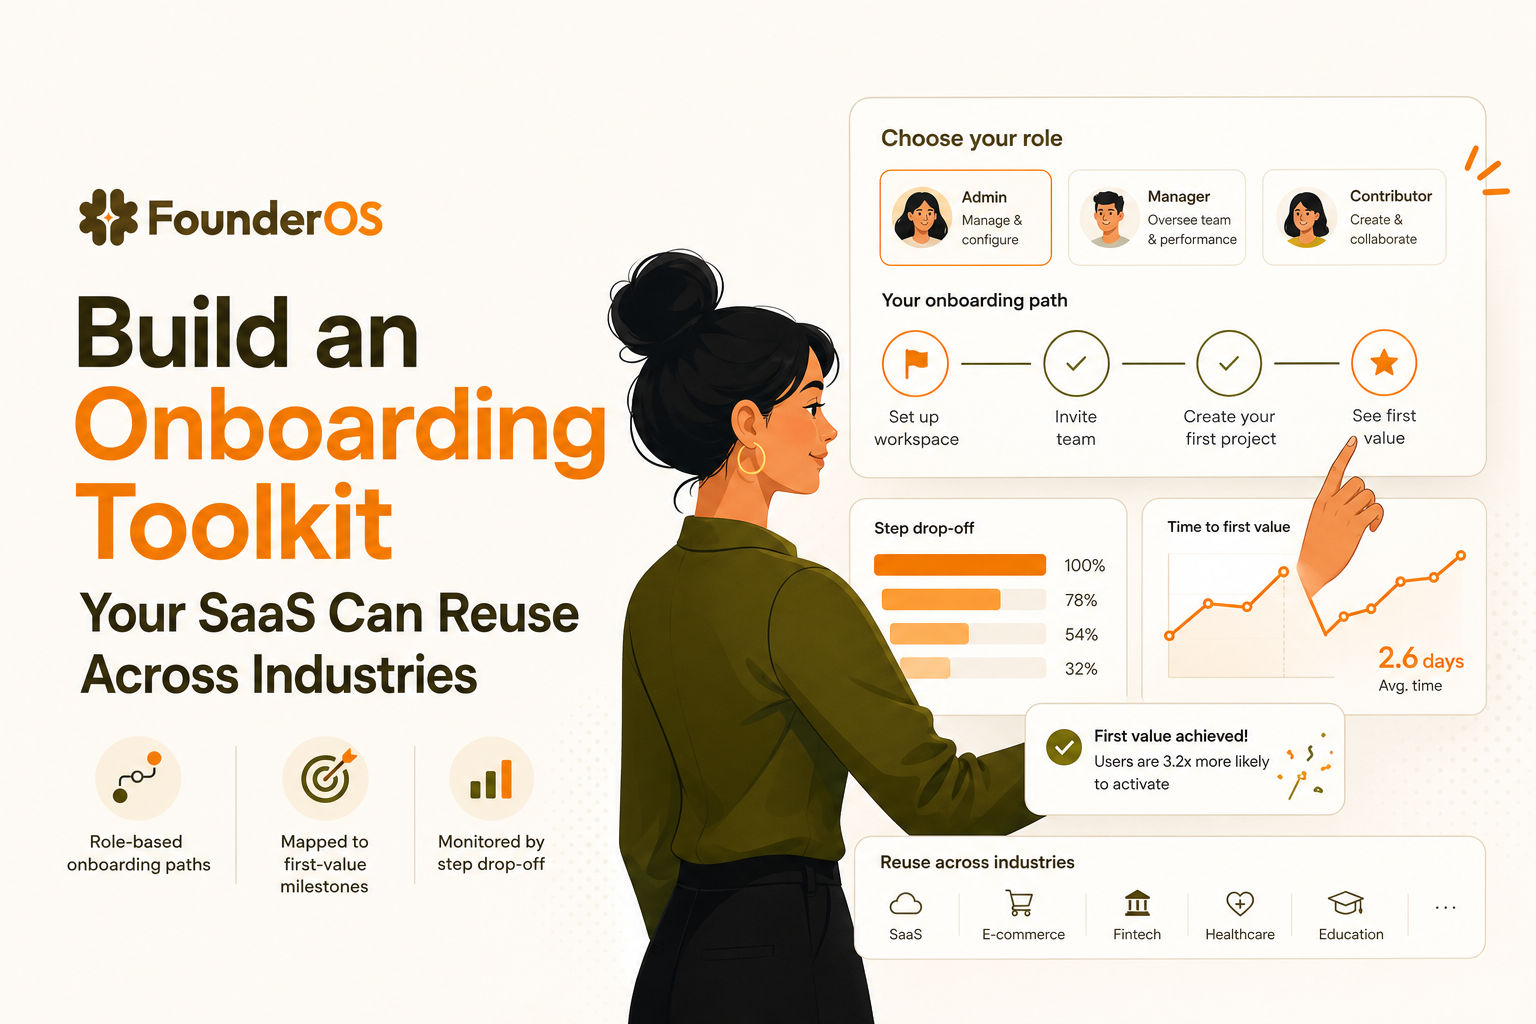
- Optimize for first value: build role-based paths around measurable milestones, not “finish the tour” completion.
- Make it measurable: define events, segments, and drop-off diagnostics so you can validate impact across industries.

The Mission and the Stack
Direct answer (50 words): This SOP shows how to design and deploy an onboarding toolkit that works across industries by standardizing onboarding patterns, reusable assets, and instrumentation. You will define first-value milestones, build role-based paths, ship modular in-app flows, and measure impact using activation, time-to-first-value, and step-level drop-off diagnostics.
The stack you need (ingredients)
- Founder OS as the execution engine for no-code in-app flows and guided experiences plus analytics for completion and impact.
- Event tracking plan (your canonical event names and properties).
- User attributes source (role, company size, industry, plan tier) from signup forms, CRM, or billing.
- Knowledge base for deeper docs (links you can surface contextually).
- Support feedback loop (ticket tags, chat transcripts) to feed onboarding iterations.
When you need an onboarding toolkit (not another one-off tour)
Deploy a reusable onboarding toolkit when any of these are true:
- You have multiple roles (admin, operator, analyst) and each role needs a different “first win.”
- You sell into multiple industries where the same core product must be framed with different examples and milestones.
- Your product ships weekly and onboarding breaks because flows are coupled to UI changes.
- Activation is inconsistent across segments and you cannot explain why because tracking is incomplete.
Symptoms checklist (diagnose repeatable onboarding problems)
- Completion looks good, activation is flat: users finish tours but do not reach first value.
- Support load spikes after releases: new UI means your hand-built tours become misleading.
- Enterprise and SMB behave differently: your “average” onboarding hides segment-level drop-off.
- New industries stall at different steps: the same product needs different proof points and examples.
Prerequisites to Execute This SOP
Before you build your onboarding toolkit, prepare these inputs so the workflow is grounded and measurable.
Data prerequisites
- Define 1 primary activation event (example: “First project created,” “First dashboard published,” “First integration connected”).
- Define 2 to 4 supporting milestones that lead to activation (example: invite teammate, connect data source, set permissions).
- List critical user attributes you can reliably collect at signup or first session: role, use case, company size, industry.
- Baseline metrics (last 30 days): activation rate, median time-to-first-value, and top 3 drop-off screens.
UX and content prerequisites
- Map the “happy path” from signup to first value in 6 to 10 screens max.
- Write a microcopy library (CTA verbs, error states, “why this matters” explanations) so your flows stay consistent.
- Decide ownership: one person owns patterns and instrumentation, product marketing owns copy blocks, product owns milestone definitions.
Governance prerequisites (so it stays reusable)
- Naming conventions for flows, steps, and events (example: OB_ROLE_Admin_ConnectData_v1).
- Release protocol: every UI change that touches onboarding screens triggers a quick validation pass.
- Definition of done: a flow is not “done” until it has a trigger, target segment, success metric, and rollback plan.
Step-by-Step Execution to Build a Reusable Onboarding Toolkit
This is the core protocol. Each phase is written as Action followed by Outcome so you can execute it like an operating system, not a brainstorming exercise.
Phase 1 Standardize first-value milestones (Action to Outcome)
Action: Choose one “first value” milestone per role and define it as an observable event, not a feeling.
- Admin first value: “Connected data source”
- Operator first value: “Completed first workflow run”
- Executive first value: “Viewed first KPI dashboard”
Outcome: Your onboarding toolkit has a measurable destination for each role, so you can optimize for time-to-first-value instead of tour completion.
Phase 2 Build modular onboarding patterns (Action to Outcome)
Action: Create a small library of reusable flow patterns that you can deploy across industries with only copy and examples swapped. Keep the library intentionally small to reduce maintenance.
- Pattern A: Welcome and routing (1 to 2 steps) to select role or goal.
- Pattern B: Contextual nudge anchored to a UI element at the moment of need.
- Pattern C: Milestone checklist showing 3 to 5 tasks that lead to first value.
- Pattern D: Just-in-time survey to capture intent when behavior stalls.
Outcome: Your onboarding toolkit becomes a set of “Lego blocks” you can recombine for new industries or segments without redesigning everything.
Phase 3 Instrument everything you ship (Action to Outcome)
Action: For every pattern, define a minimal measurement spec. Track at least:
- Exposure: user saw the flow (with flow name and version).
- Step progression: step viewed, next clicked, dismissed.
- Milestone completion: the activation event and supporting milestones.
- Segment properties: role, industry, plan tier.
Outcome: You can diagnose where onboarding fails by step and by segment, and you can compare performance across industries without changing your analytics model every time.
Phase 4 Deploy role-based paths with conditions (Action to Outcome)
Action: Deploy onboarding flows that trigger by URL, user segment, and behavior so each role sees the shortest path to first value. In Founder OS, teams typically do this by setting conditions such as “role = Admin AND has_not_connected_data_source” and triggering flows on the relevant screen, then previewing and publishing without a release cycle.
Outcome: The same onboarding toolkit serves different industries because the routing logic adapts the path. You stop forcing every user through the same generic tour.
Phase 5 Validate with a 7-day activation experiment (Action to Outcome)
Action: Run a controlled validation window for 7 days:
- Day 1: deploy routing plus one milestone checklist for the highest-volume role.
- Day 2 to 4: add contextual nudges at the top 2 drop-off screens.
- Day 5: add a survey only for stalled users (no activation event within X hours).
- Day 7: review step drop-off and time-to-first-value by role and industry.
Outcome: You get proof that your onboarding toolkit improves activation and not just engagement. Founder OS supports this loop by showing step completion and drop-off per step, then tying flow exposure to activation changes in the same dashboard.
Expert Insight Box: The Golden Rule
Optimize for “first value per role,” not “tour completion.” A 70% tour completion rate can still be a failure if it does not reduce median time-to-first-value. Treat completion as a diagnostic metric, and activation as the success metric.
Common pitfall: Shipping industry-specific tours that hardcode UI and copy. This creates a maintenance trap where every product change breaks onboarding across multiple vertical variants.
Monitoring and Optimization Protocol
Once the onboarding toolkit is deployed, use a weekly monitoring protocol to validate performance and decide what to change.
KPIs to monitor (weekly)
- Activation rate by role and industry: % of new users reaching the activation event within 7 days.
- Median time-to-first-value: time from signup to activation event (track median, not only average).
- Flow completion rate and step drop-off: identify the exact step where users abandon.
- Support deflection proxy: change in onboarding-related ticket tags (example: “setup,” “integration,” “permissions”).
Optimization rules (what to do when a KPI is off)
- If activation is down but completion is up: you are guiding users through UI, not value. Replace steps with milestone-based tasks and remove non-essential screens.
- If time-to-first-value is high for one industry: swap the examples, defaults, and templates shown in the checklist while keeping the same pattern and instrumentation.
- If drop-off spikes at one step: rewrite the microcopy to answer “why this matters,” or move the step to the screen where the user has the necessary context.
- If users dismiss flows: tighten targeting with behavior conditions so only users who need the help see it.
Scaling the Workflow From Solo Build to Team-Wide Process
An onboarding toolkit becomes truly reusable when it is governed like a product system. Use this scaling protocol to move from ad hoc edits to a team-wide operating rhythm.
Team roles and ownership
- Onboarding owner: maintains the pattern library, naming conventions, and release checklist.
- Product manager: owns first-value milestones and validates that flows reflect the real happy path.
- Lifecycle or product marketing: owns copy blocks and industry examples so language stays consistent.
- Support lead: feeds recurring confusion points and top ticket drivers into the backlog.
Template and permissions protocol
- Template every pattern: welcome routing, checklist, contextual nudge, survey. Clone and adjust, do not rebuild.
- Version your flows: keep v1 live, test v2 on a subset, then promote.
- Permission discipline: limit who can publish; allow broader team access to propose edits and preview.
Industry-proofing checklist (reuse without rewriting)
- Keep milestones constant: “connect,” “create,” “invite,” “publish” often map across industries even when examples differ.
- Swap examples and defaults: change sample data, naming, and templates per industry while keeping the pattern.
- Segment by role first, then industry: role usually predicts the next action better than vertical.
- Audit quarterly: remove flows that do not move activation or reduce time-to-first-value.
| Toolkit component | What it standardizes | Owner | Success metric |
|---|---|---|---|
| Role-based first-value milestones | Definition of “done” for onboarding | Product | Activation rate within 7 days |
| Pattern library (routing, nudges, checklists, surveys) | Reusable flow structures | Onboarding owner | Median time-to-first-value |
| Copy blocks and UI guidance rules | Consistent language and CTAs | Lifecycle marketing | Step drop-off reduction |
| Instrumentation spec | Comparable measurement across industries | Analytics owner | Coverage of exposure, steps, milestones |
| Release validation checklist | Prevents onboarding breakage after UI changes | Product + onboarding owner | Number of onboarding-related regressions |
FAQ about building a reusable onboarding toolkit
What if our activation event differs by industry?
Keep a single activation “category” (for example, publish, connect, invite, run) and define industry-specific implementations as properties. Your onboarding toolkit stays reusable because patterns remain the same, while segmentation and examples adapt. Track activation with an event name plus an industry property, not separate event taxonomies.
What if the completion rate is high but activation is low?
Remove steps that only explain UI. Replace them with tasks that directly cause the activation event. Then tighten triggers so flows appear only when users are one click away from a milestone. Use step-level drop-off to find where users comply but do not progress, which often indicates unclear value or missing prerequisites.
What if different roles share the same account and onboarding conflicts?
Route by role at the user level, not the account level, and gate flows with conditions like “role = Admin” plus “has_not_completed_milestone.” If you cannot reliably collect role at signup, deploy a one-question in-app prompt and store the answer as a user attribute before showing any deeper flow.
What if we do not have clean segmentation data yet?
Start with behavior-based segmentation: users who have not connected a data source, users who have created zero projects, or users who visited a key page twice without completing a milestone. As you improve your signup and CRM data, progressively add role and industry attributes so the onboarding toolkit becomes more precise over time.
If you want to deploy this onboarding toolkit quickly without engineering bottlenecks, Founder OS lets you build and publish in-app onboarding flows with no code, target them by user attributes and behavior, and measure completion and activation impact in one place. Use it as your execution layer, then iterate weekly until time-to-first-value drops and activation becomes predictable.

Stay in the loop
Get the latest insights on SaaS growth, product strategy, and more delivered to your inbox.