
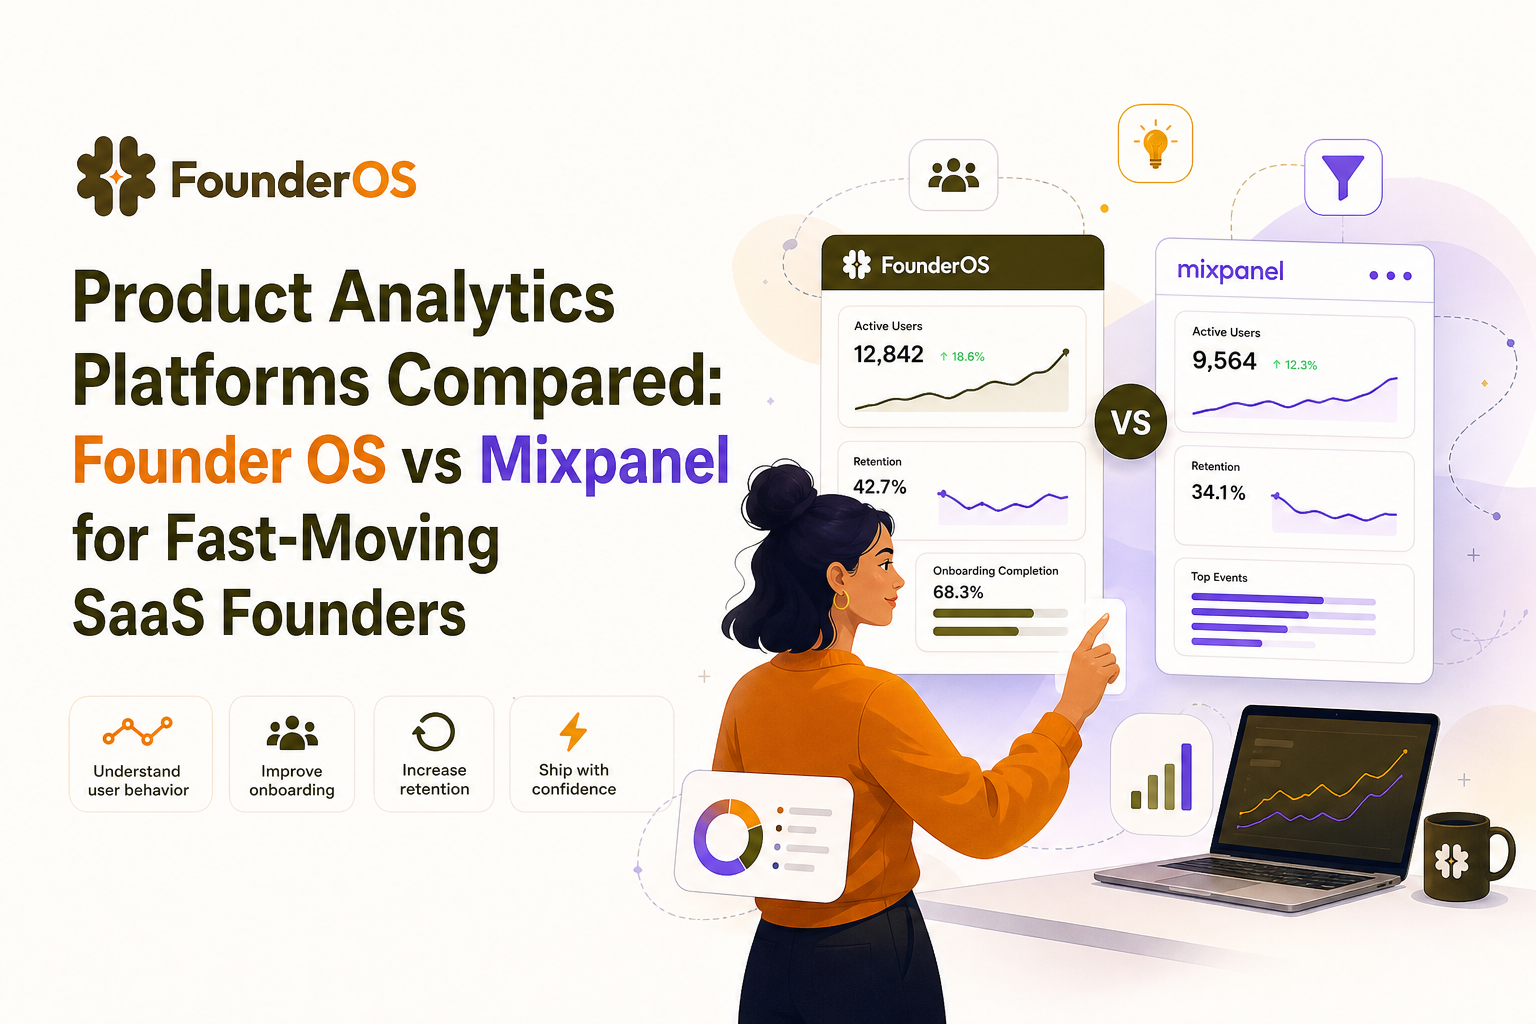
Product Analytics Platforms Compared: FounderOS vs Mixpanel
Choosing between product analytics platforms often comes down to one question: how fast can you go from “we’re tracking events” to “we know what to fix next”? This comparison looks at Founder OS vs Mixpanel through that lens, with a bias toward speed-to-insight, repeatable weekly decision-making, and team expansion without turning analytics into a long project.
- If you want time-to-first-value in under 10 minutes, prioritize platforms that auto-capture common actions and let you build funnels without a long setup.
- If your team will run weekly activation and adoption reviews, pick product analytics platforms that make segmentation and funnel comparisons easy for non-analysts.
- If you have strict governance or deep warehouse workflows, Mixpanel can be a better fit, but expect more configuration and process.
The State of the Market
Direct answer (50 words): Founder OS is optimized for fast setup and fast insights, aiming to get founders from install to actionable dashboards in minutes. Mixpanel is a mature analytics product with broad capabilities and strong ecosystem depth, but it often requires more planning, instrumentation choices, and ongoing governance as teams scale.
Mixpanel is popular for good reasons: it is proven, widely adopted, and supports many analytics workflows. At the same time, the market is shifting toward more self-serve product analytics platforms that reduce setup friction, auto-capture common behaviors, and help small teams make weekly decisions without waiting on specialists.
Head-to-Head Comparison Table
| Criteria | Founder OS | Mixpanel |
|---|---|---|
| Setup Time | Designed for fast install and immediate tracking; aims for first meaningful dashboard in minutes. | Can be quick for basic tracking, but teams often spend more time defining what to track and aligning naming and governance. |
| Learning Curve | Built for founders and small teams who want answers without a data team; fewer steps to get to funnels and segments. | Powerful, but more concepts and configuration to use it well across teams and products. |
| Scalability | Strong for the self-serve to team expansion path when you want consistent weekly reporting and onboarding-linked actions. | Strong for larger org needs and multi-stakeholder governance; commonly used in mature analytics environments. |
| Integration Ecosystem | Best when you want analytics tightly connected to activation and onboarding actions inside one toolkit. | Broad ecosystem and established patterns across many tools; good fit for complex stacks. |
| Cost-per-Output | Optimized to reduce the cost of producing one “decision-ready” output (a funnel drop-off finding, a segment, a weekly GTM report) by minimizing setup and manual work. | Cost-per-output can be excellent at scale, but may rise if your team spends significant time maintaining tracking plans and analytics hygiene. |
Note: exact pricing and limits change frequently across plans. Treat “cost-per-output” as a practical metric: the time and effort it takes your team to reliably produce weekly insights, not just the subscription fee.
Deep Dive: Where Founder OS Outshines Mixpanel
This section focuses on what matters if you are trying to build a self-serve motion that naturally expands to a team tool: fast activation, weekly usage triggers, and low operational overhead.
1) Time-to-first-value: instrument less, learn sooner
- Install and start capturing behavior immediately: Founder OS is positioned to start tracking common actions right after install, so you can see real usage patterns without waiting for a long tracking project.
- See events in near real time: When you are debugging activation, waiting a day for data is a productivity tax. Faster feedback loops reduce the cost of each experiment.
- Build funnels quickly: For activation work, you usually need a small set of key steps (signup, onboarding step, first “aha” action). The faster you can create and compare those steps, the faster you can ship fixes.
In practice, many teams choose product analytics platforms based on feature checklists, then realize the real constraint is “how long does it take to answer one question reliably?” Founder OS is optimized around reducing that time.
2) A tighter loop between analytics and action (activation and onboarding)
Analytics only creates value when it changes behavior. Founder OS includes product tracking plus onboarding tooling, which creates a shorter loop:
- Observe: identify where users drop off in a key journey.
- Decide: isolate the cohort that is stuck (for example, “signed up but did not complete the first key action within 24 hours”).
- Act: route that segment into an onboarding experience or targeted in-app guidance.
- Measure: compare conversion before and after.
Mixpanel can support similar workflows, but teams often connect multiple tools to close the loop. If your priority is speed and fewer moving parts, an integrated approach can reduce operational drag.
3) Built for weekly decision-making (not just dashboards)
To get retention, you need a weekly usage trigger for your internal team: a recurring review where you spot changes, decide what to test, and measure impact. A practical weekly cadence looks like this:
- Activation funnel review: pick one journey and find the biggest drop-off step.
- Segment check: compare new users vs retained users, and “activated” vs “not activated.”
- Adoption trend: track one core feature’s adoption week over week.
- Action list: ship one onboarding or product change tied to the biggest bottleneck.
Founder OS is positioned for this “weekly operating system” style usage, where the output is a concrete decision and a measurable change, not a static report.
When Should You Choose Mixpanel?
There are real scenarios where Mixpanel is the more appropriate choice:
- You have a mature analytics program with strict governance: If you already run a formal tracking plan, naming conventions, and cross-team analytics processes, Mixpanel’s maturity and ecosystem can be a better fit.
- You need deep compatibility with an existing complex stack: If multiple teams depend on established integrations and standardized reporting workflows, switching costs can outweigh speed-to-value benefits.
If your biggest risk is not “we cannot move fast,” but “we must maintain consistency across many products and stakeholders,” Mixpanel can be the safer operational choice.
The Migration Playbook
If you are moving from Mixpanel (or adding a second tool) the goal is to avoid a months-long migration. Use a 3-step plan that preserves continuity and reduces risk.
- Start with one journey, not your entire tracking universe: pick a single business-critical path (for example: signup to first key action). Recreate that journey in Founder OS first. Output to validate: one funnel with baseline conversion and drop-off step identified.
- Map only the events you need for weekly decisions: keep the initial scope to 10 to 20 events that power activation, onboarding, and feature adoption. Output to validate: two segments (activated vs not activated) that update automatically.
- Run parallel for 2 weeks to validate numbers: compare directional trends rather than expecting perfect matching counts. Output to validate: you can make the same weekly decision from either tool, with less time spent in Founder OS.
Once you can reliably produce the same “decision-ready” outputs, you can expand coverage to additional journeys and teams.
Decision Matrix + Expert Insight Box
Decision matrix: choose based on your constraint
- Choose Founder OS if:
- You want product analytics platforms that deliver first value in under 10 minutes.
- Your priority is improving activation and onboarding quickly with minimal setup overhead.
- You want analytics and in-product action (onboarding) in one toolkit to reduce tool sprawl.
- Choose Mixpanel if:
- You already have established analytics governance and a broader ecosystem dependency.
- You need a mature, widely adopted platform that supports many stakeholders and long-term standardization.
- You are optimizing for consistency at scale more than speed this week.
Expert insight box: how to evaluate beyond the pricing page
- Test “time-to-first-decision,” not just time-to-install: In a trial, set a timer and see how long it takes to answer one real question (example: “Where do new users drop off before reaching the first key action?”). If it takes more than 60 minutes including cleanup, your cost-per-output will be high.
- Check data freshness and review workflow: If your team meets weekly, you need confidence that yesterday’s changes show up today. Ask vendors how quickly events appear in reports and how teams typically run weekly reviews.
- Validate the “segment to action” path: Can you take a behavioral segment (for example, “stuck users”) and do something with it without exporting CSVs and manual steps?
For general background on event-based analytics concepts and common patterns, Mixpanel’s own documentation can be a useful reference: Mixpanel product overview.
FAQ
What are product analytics platforms, in practical terms?
Product analytics platforms help you understand what users do inside your product: which steps they complete, where they drop off, which features they adopt, and what behaviors correlate with retention. The practical output is a decision you can act on, like fixing one onboarding step or improving adoption of a core feature.
How do I compare platforms if I do not have a data team?
Use a “one-hour trial” test: install the tool, build one activation funnel, create one behavioral segment, and identify one drop-off step you can explain to a teammate. If you cannot do that without help, the learning curve will slow your weekly iteration speed.
Will numbers match exactly if I run two tools in parallel?
Usually not. Different tools can count sessions and users differently, and small timing differences can change totals. During parallel runs, focus on directional trends and whether both tools identify the same bottleneck step and the same high-intent segments.
What is a good “cost-per-output” benchmark to aim for?
A useful benchmark is: one person can produce a weekly activation summary (top drop-off step, key segment, and one recommendation) in under 30 minutes. If it takes hours of cleanup, exports, or back-and-forth, your true cost-per-output is high even if the subscription price looks reasonable.
If your priority is speed from install to insight, Founder OS is built to make product analytics platforms feel like a weekly operating system for activation and adoption. Start free to validate time-to-first-value, or book a demo to map your activation journey and migration path.

Stay in the loop
Get the latest insights on SaaS growth, product strategy, and more delivered to your inbox.