
Retention Cohort Analysis, Explained With a Simple Worksheet You Can Use Today
Retention cohort analysis is the fastest way to answer a simple question that decides your growth: do people come back after they try your product once? Instead of staring at one blended retention number, you group users by when they started (a cohort) and track whether they return week by week, so you can see what changed and why.
- What retention cohort analysis actually shows (and what it does not)
- The 10-minute setup worksheet (cohort, return event, and time window)
- How to read a cohort table without fooling yourself
- Turn retention into actions: 4 patterns and what to do next
- A concrete example: from “week 1 drop” to a testable fix
- FAQ
- Pick a return event that represents real value, not just “login”.
- Use weekly cohorts for most B2B SaaS; daily is usually too noisy, monthly is too slow.
- Look for patterns (cliff, slope, step-change) and tie them to a specific product moment you can improve.
What retention cohort analysis actually shows (and what it does not)
At its core, retention cohort analysis answers: “Of the users who started in the same period, what percentage returned and did the meaningful thing again in later periods?”
What it shows (useful)
- Whether retention is improving or worsening over time (cohort by cohort), instead of guessing from an average.
- When users disappear (week 1 vs week 4), which points to different causes and fixes.
- Whether a change worked: a product update, pricing change, onboarding tweak, or a new use case can create a visible “step-change” in later cohorts.
What it does not show (common traps)
- Why retention changed. Cohorts show where to investigate, not the root cause by themselves.
- Revenue retention. A cohort can retain users but lose revenue (or vice versa). If you sell seats or usage, you will eventually need revenue cohorts too.
- Quality of acquisition unless you segment. A big retention swing can simply be “we bought worse traffic” or “we targeted the wrong role”.
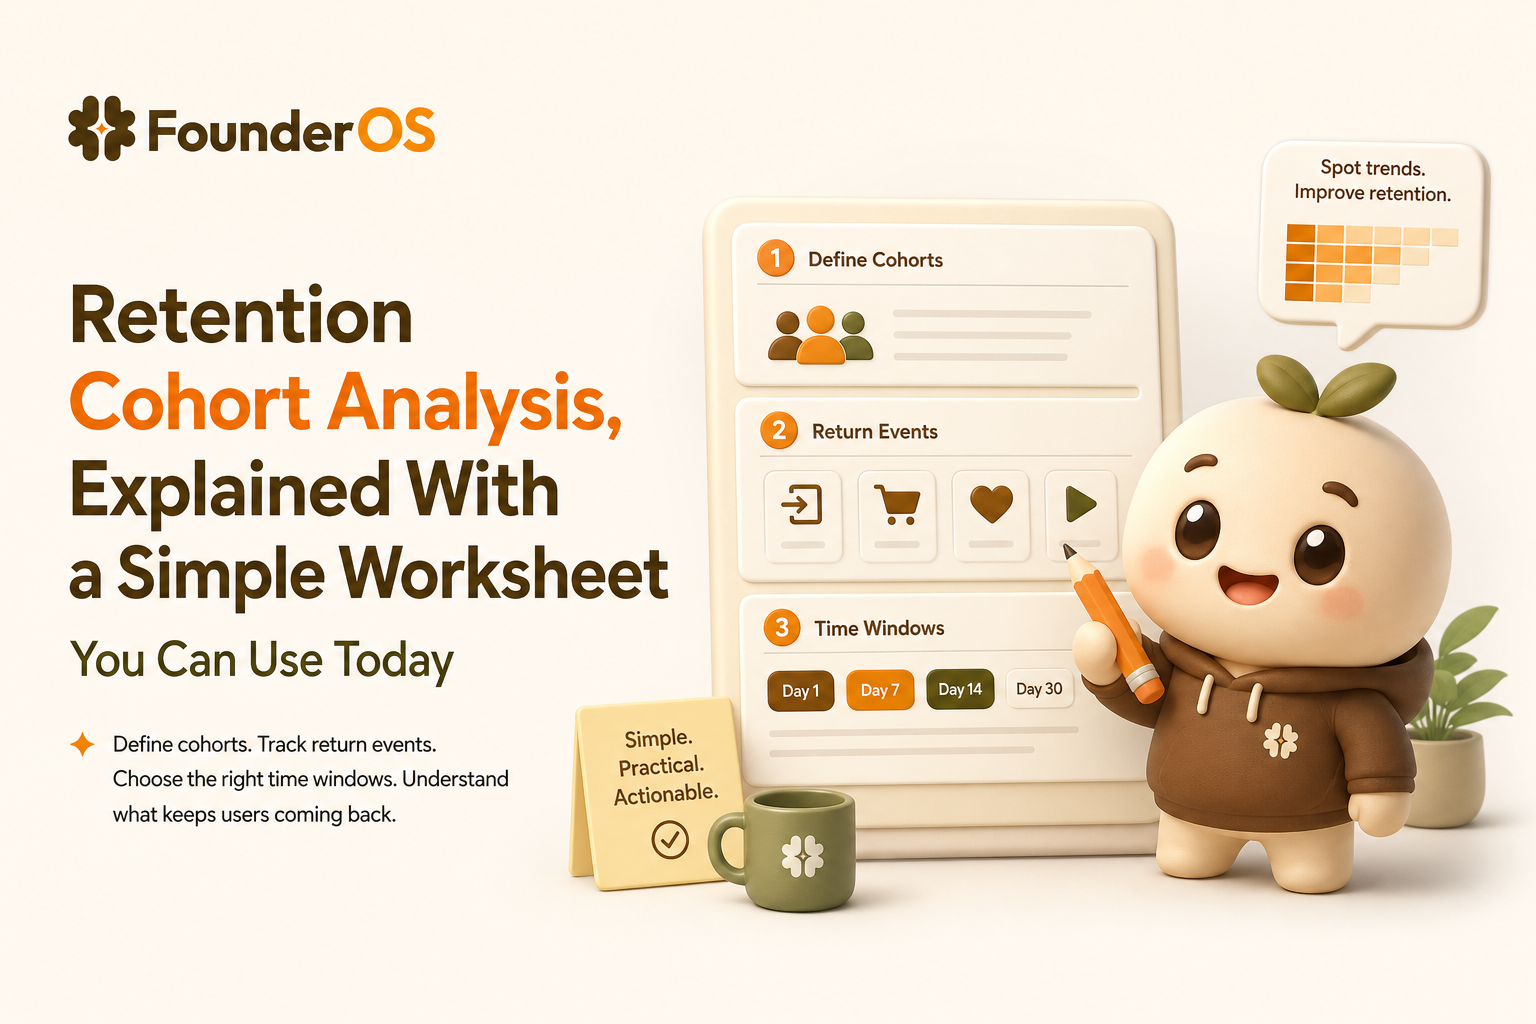
The 10-minute setup worksheet (cohort, return event, and time window)
This worksheet is designed so a founder or marketer can set up retention cohort analysis without a data team. You can do it in any product analytics tool that supports cohorts. If you are still getting your tracking in place, start with a reliable event tracking setup so your retention numbers are based on real behavior.
Step 1: Define the cohort rule (who is included)
Choose one:
- Signup cohort: users grouped by the week they created an account. Best when activation happens quickly.
- Activation cohort: users grouped by the week they first reached “aha”. Best when signup is easy but value requires setup.
- Paid cohort: users grouped by the week they first paid. Best when you want to judge post-purchase retention.
Decision rule: If your product has meaningful setup (import data, invite teammates, connect tools), use activation cohorts so you are not blaming retention for onboarding friction.
Step 2: Pick one return event (the “came back for value” action)
A good return event is:
- Repeatable (users should do it again next week if they are getting value)
- Value-linked (it is close to the outcome you sell)
- Un-gameable (not something people do accidentally)
Return event examples by product type:
- CRM: “created a deal” or “logged an activity” (not “opened dashboard”)
- Email tool: “sent a campaign”
- Project tool: “completed a task”
- Analytics: “viewed a report” can be OK if it indicates a decision workflow
Checklist: If you can’t name a single return event, you likely need to clarify your core workflow before you trust retention cohort analysis.
Step 3: Choose the time window (daily, weekly, monthly)
| Product usage rhythm | Recommended cohort window | Why |
|---|---|---|
| Most B2B SaaS (teams work weekly) | Weekly | Matches planning cadence and reduces noise |
| High-frequency tools (chat, POS, support) | Daily or weekly | Daily can work if usage is truly daily |
| Low-frequency tools (payroll, quarterly reporting) | Monthly | Weekly will look “bad” even if product is healthy |
Step 4: Set a minimum sample size (so you do not chase randomness)
Use this simple rule:
- If a cohort has under 50 users, treat it as directional, not definitive.
- If you want to compare two cohorts (before vs after a change), try to have 100+ users in each.
This is not a strict statistical guarantee, but it prevents the most common mistake: shipping changes based on tiny cohorts.
How to read a cohort table without fooling yourself
Most cohort charts are a grid: rows are cohorts (for example, “users who signed up the week of May 1”), columns are weeks since start (week 0, week 1, week 2), and each cell is the percentage that did the return event.
Use these 5 reading rules
- Start with the shape, not the exact numbers. Are you seeing a cliff, a steady decline, or a stable plateau?
- Compare the same column across rows. For example, week-2 retention for the last 8 cohorts. That shows improvement more clearly than scanning diagonally.
- Watch for “week 0 inflation”. Week 0 often includes onboarding behavior. It is not retention; it is initial engagement.
- Segment before you panic. If overall week-1 retention drops, split by channel, plan, or persona. One bad acquisition source can drag everything down.
- Pair cohorts with a funnel check. If week-1 retention is low, confirm whether users even reached activation. A quick funnel analytics view often reveals whether the problem is “did not reach value” vs “reached value but did not return”.
Turn retention into actions: 4 patterns and what to do next
Retention cohort analysis is only useful if it leads to a concrete next step. Here are four patterns you can diagnose and the next action that usually pays off.
Pattern 1: The week-1 cliff (big drop right after first use)
- What it often means: Users tried the product but did not reach a clear outcome.
- Action checklist:
- Define one “first value” moment (a screen, report, or result)
- Remove 1-2 steps before that moment
- Add an in-product prompt that guides users to that outcome
Pattern 2: Slow decay (gradual decline every week)
- What it often means: Value is real, but there is no habit trigger or recurring reason to return.
- Action checklist:
- Create a weekly “reason to come back” (review, summary, alerts)
- Make the return event easier (fewer clicks, saved views)
- Identify what retained users do in week 1 and nudge others toward it
Pattern 3: A sudden step-change (newer cohorts are clearly better or worse)
- What it often means: Something changed: onboarding, pricing, positioning, or acquisition.
- Action checklist:
- Write down the exact date of changes shipped or campaigns launched
- Compare cohorts before vs after that date for week-1 and week-2 retention
- Segment by channel to confirm it is not just “different users”
Pattern 4: Good retention for one segment, bad for the rest
- What it often means: You have product-market fit for a narrow use case, but you are attracting broader users.
- Action checklist:
- Identify the segment with the best retention by behavior
- Describe their workflow in plain language
- Adjust onboarding and messaging to lead more users into that workflow
If you are unsure how to create those groups, start with a practical guide to behavioral market segmentation using actual product actions, not demographics.
A concrete example: from “week 1 drop” to a testable fix
Scenario: A B2B SaaS tool that helps teams create reports. You run retention cohort analysis with weekly signup cohorts and the return event “generated a report”. You see:
- Week 0: 60% generate a report
- Week 1: 12% generate a report again
- Week 2: 8%
Interpretation using a simple decision table
| Observation | Likely cause | What to check next |
|---|---|---|
| High week 0, low week 1 | One-time curiosity, not ongoing value | Do users save templates or schedules? |
| Return event is “generate report” | May be too heavy for weekly repeat | Is “view report” or “share report” a better weekly signal? |
| Some cohorts slightly better after a date | Onboarding change helped | Compare new onboarding path completion rates |
Turn it into one testable fix (not a long roadmap)
- Hypothesis: Users do not return because they are not reminded when new data is available.
- Small product change: Add a weekly email and in-app notification: “Your weekly report is ready”, linking to the saved report.
- Success criteria:
- Week-1 retention for “view report” increases by 3-5 points in the next two cohorts
- At least 30% of week-0 report creators save a report template
- Guardrail: Ensure the notification is only sent if the report has new data, so you do not create spam.
Limitations: cohort improvements can lag (you only know week-2 retention after two weeks). Also, if acquisition channels changed, you must segment by channel to avoid false attribution.
FAQ
What is the difference between retention cohort analysis and a single retention rate?
A single retention rate blends many user start dates together. Retention cohort analysis groups users by when they started (or activated) so you can see whether retention is improving and when users drop off.
Should my return event be “login”?
Usually no. Login is easy to inflate and may not represent value. Use a repeatable action tied to the outcome you sell, like “created invoice”, “sent campaign”, or “completed task”.
Weekly or monthly cohorts for B2B SaaS?
Weekly is a strong default because most teams plan and review weekly. Use monthly if your product is naturally used monthly (for example, payroll or billing reconciliation).
How many users do I need before I trust the cohort chart?
If a cohort has fewer than about 50 users, treat it as directional. For before-and-after comparisons, aim for 100+ users in each cohort so you are not chasing noise.
If you want to run retention cohort analysis without spreadsheets and tie it directly to segments and onboarding prompts, you can try Founder OS: install once, track real product actions, and build retention cohorts you can act on the same day.
Unknown Author
Stay in the loop
Get the latest insights on SaaS growth, product strategy, and more delivered to your inbox.