
Web Analytics Tools: Google Analytics vs Product Analytics for SaaS Teams
If you are evaluating web analytics tools, the most common question is whether Google Analytics is enough or if you need a product analytics tool built for SaaS behavior. The right answer depends on what you are trying to measure: marketing traffic and pages, or in-app actions that drive activation, retention, and expansion.
- Google Analytics is optimized for acquisition and website behavior; product analytics is optimized for in-app actions and user journeys.
- For SaaS teams, time-to-first-value and cost-per-output often improve when event tracking and user profiles are unified.
- Use a simple decision matrix: choose based on the output you need weekly (activation, feature adoption, churn risk), not feature checklists.
The State of the Market: What is changing in web analytics tools
Direct answer (50 words): Google Analytics is primarily a website analytics system, while product analytics tools are designed to measure what users do inside your SaaS product. While Google Analytics remains popular, the market is shifting toward self-serve, faster setup, and behavior-based reporting that ties actions to real users and teams.
In practice, many SaaS companies now run both categories of web analytics tools:
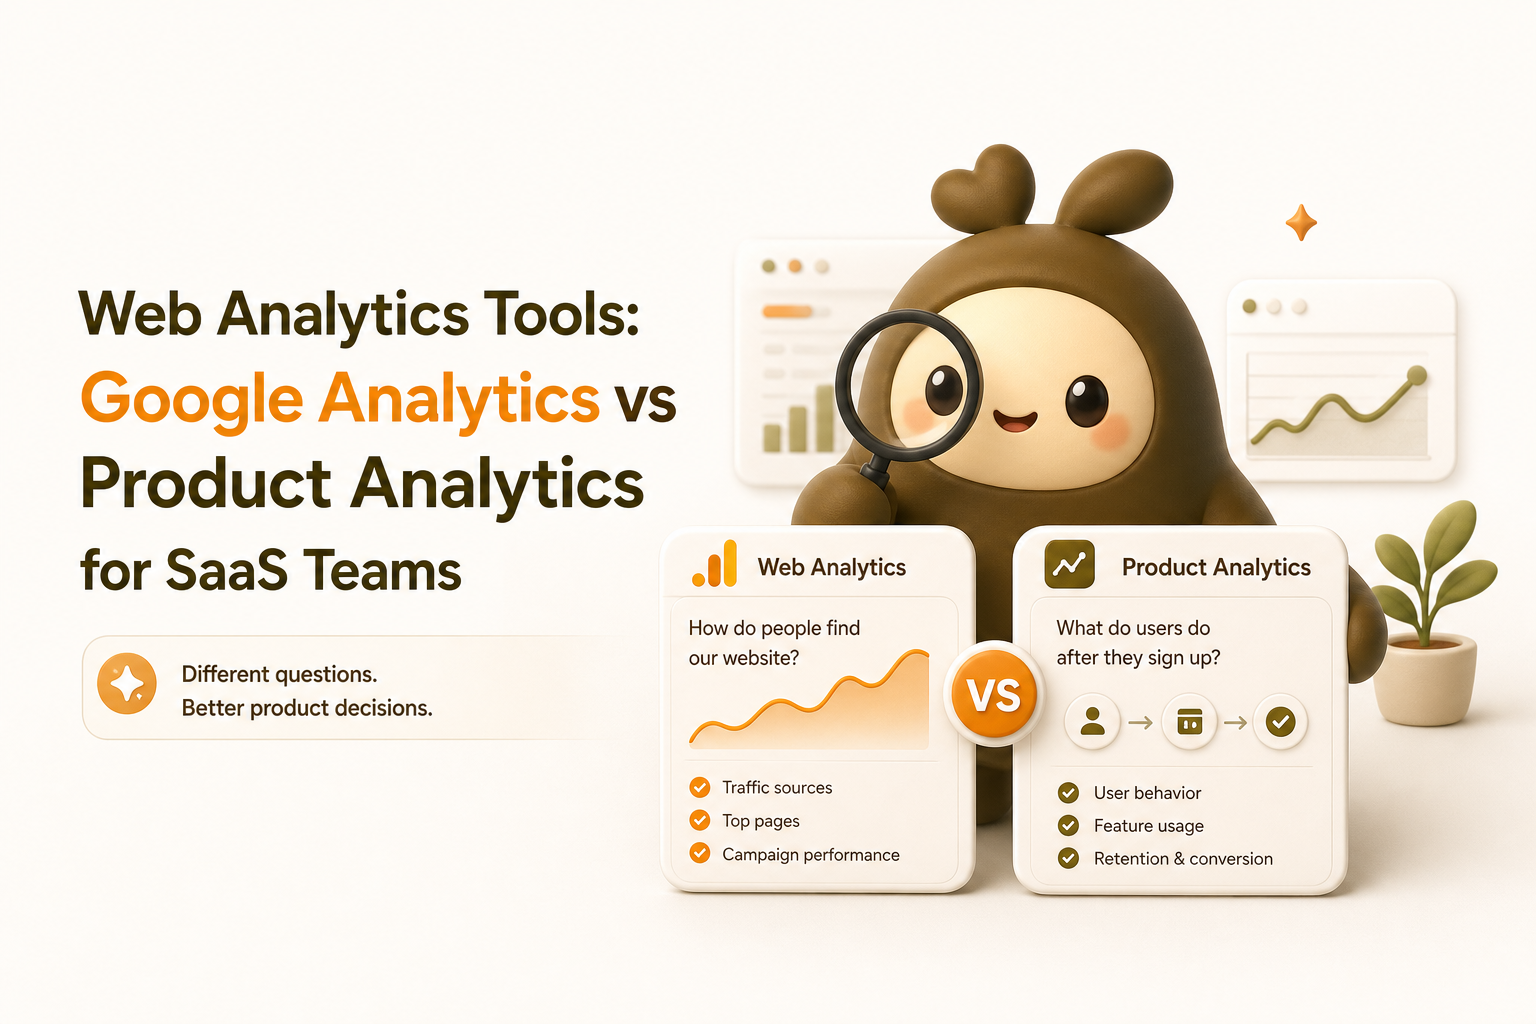
- Website analytics to answer: Where did signups come from? Which pages convert?
- Product analytics to answer: Did users reach activation? Which features drive retention?
The shift is less about replacing Google Analytics and more about closing the gap between “someone visited” and “someone adopted the product.” That gap is where most conversion and churn problems hide.
Head-to-Head Comparison Table: Google Analytics vs Product Analytics
Use this table as a buying shortcut. It compares the categories, not just one vendor, because most teams are really choosing between two measurement models.
| Criteria | Google Analytics (Website Analytics) | Product Analytics Tools (SaaS Product Analytics) |
|---|---|---|
| Setup Time | Fast for page tracking; deeper event setup can take longer depending on your site and tagging plan | Often fast to start; best-in-class options can show meaningful in-app behavior within minutes after install |
| Learning Curve | Moderate; many reports, but common marketing use cases are well documented | Moderate; requires deciding what “activation” and “key actions” mean for your product |
| Scalability | Strong for high traffic websites; less native focus on user-level product journeys | Strong for user journeys, cohorts, and feature adoption; built for retention and expansion analysis |
| Integration Ecosystem | Broad ecosystem across ad platforms and website tooling | Strong across product, CRM, and onboarding workflows; varies by vendor |
| Cost-per-Output | Low for traffic reporting; can become “high” if your team spends hours translating reports into product actions | Often lower for product decisions because outputs are closer to actions (activation funnels, adoption, retention cohorts) |
Benchmark: define “output” before you compare price
To keep this objective, define the output you want weekly. Examples:
- Activation output: % of new users who complete 1-3 key actions in the first session
- Adoption output: % of active users using Feature X at least once per week
- Retention output: week-1 return rate by signup cohort
If a tool makes those outputs easy to produce and act on weekly, its cost-per-output is usually better even if the subscription price is higher.
Deep Dive: Where Product Analytics Outshines Google Analytics
This is where many SaaS teams outgrow “website-first” measurement. The key difference is how quickly an individual can get value, then expand usage across a team.
1) Self-serve time-to-first-value (under 10 minutes)
For product-led teams, the first win is not “we see page views.” It is “we can see the user journey from signup to value.” A practical checklist for time-to-first-value:
- Install and confirm live activity (you should see real actions coming in quickly)
- Identify 5-10 key actions (signup, invite teammate, create project, connect integration, export report)
- Build a simple journey view (signup to first value action)
- Spot drop-offs and click into examples (what did users do right before they quit?)
This is where product analytics tools tend to be superior: they are designed to make in-app actions visible fast, so a founder or PM can diagnose issues without waiting on a data specialist.
2) Behavior tied to people, not just visits
Most SaaS decisions require user-level context:
- Who reached activation but did not return?
- Which users adopted Feature A but never tried Feature B?
- What do retained users do in their first day that churned users do not?
That is why many teams pair web traffic reporting with product analytics focused on the in-app journey.
3) A clearer “Self-Serve to Team Expansion” path
In SaaS, expansion often happens when one user proves value and then invites others. To measure that, you need reporting that naturally answers:
- Individual value: Did the user reach the first meaningful outcome?
- Collaboration value: Did they invite teammates or share work?
- Team habit: Do multiple users return weekly to complete the same workflow?
A concrete way to implement this is to combine event tracking with segmentation. If you want an example workflow, see how teams structure event tracking setup so it supports both self-serve onboarding and team reporting.
4) Better operational outputs: funnels, cohorts, and drop-off diagnosis
Many teams start with Google Analytics and later add product analytics when they need answers that are closer to product work. A simple decision table you can use internally:
| Question you need answered | Best fit | Why |
|---|---|---|
| Which channel drives the most signups? | Google Analytics | Optimized for acquisition and website attribution |
| Where do users drop off between signup and activation? | Product analytics tools | Built for step-by-step in-app journeys and user-level drilldowns |
| Which features correlate with week-4 retention? | Product analytics tools | Designed for cohorts and behavior-based comparisons |
| Which landing page converts best? | Google Analytics | Strong page and campaign reporting |
If you are specifically trying to fix conversion drop-offs, you will likely end up using funnel analytics that connects steps to real users and sessions, not just aggregated page paths.
When Should You Choose Google Analytics?
Being honest: Google Analytics can be the better choice in several common scenarios.
Choose Google Analytics if
- Your main goal is marketing performance: campaigns, landing pages, content performance, and channel attribution
- Your product is not a logged-in SaaS app: for example, a content site, marketplace browsing, or a simple lead-gen site
- You need a widely recognized standard that many agencies and marketers already know how to operate
Choose product analytics tools if
- Your main goal is improving activation and retention inside the product
- Your team ships onboarding and feature changes weekly and needs fast feedback loops
- You need user-level visibility to understand why people disengage and what to do about it
Reality check: most SaaS teams end up with both
A common pattern is: Google Analytics for acquisition, and product analytics for what happens after signup. The mistake is forcing one tool to do both jobs, then blaming the tool when it cannot produce the outputs you need.
The Migration Playbook: Switch without breaking reporting
This 3-step playbook is designed for a small SaaS team that wants better in-app measurement without a long project.
-
Define your “weekly decision dashboard” (30 minutes)
- Pick 1 activation metric, 1 adoption metric, 1 retention metric
- Write each metric as a sentence: “A user is activated when they do X and Y”
- List the 5-10 actions needed to compute them
-
Run parallel tracking for 2 weeks
- Keep Google Analytics for website reporting
- Add a product analytics tool for in-app actions and user journeys
- Compare answers to the same question (example: activation rate by signup date) and resolve differences
-
Operationalize: turn insights into weekly actions
- Create 2-3 behavior-based segments (new activators, stuck users, at-risk users)
- Assign an owner for a weekly review and one experiment per week
- Track whether changes move the metrics you defined in step 1
Expert Insight Box: how to evaluate SaaS analytics tools beyond the pricing page
- Ask “what breaks first?” For analytics, it is usually data limits, sampling, or unclear definitions across teams.
- Check how the tool handles identity (one person across devices and sessions). If this is weak, your retention and conversion numbers will be noisy.
- Audit permission controls if multiple teams will use it. Without clear access rules, reporting becomes fragile.
- Confirm data export options so you are not locked in. Even if you never export, having the option reduces risk.
For background on how Google positions its own measurement model, see Google Analytics 4 documentation.
FAQ
Are web analytics tools the same as product analytics tools?
Not exactly. Many people use “web analytics tools” as a broad term, but in practice there are two categories: website analytics (focused on pages and traffic) and product analytics (focused on in-app actions and user journeys). SaaS companies often need both.
Can I measure activation with Google Analytics?
You can approximate activation if your key actions are tracked reliably, but it is often harder to tie actions to a consistent user profile and follow the full in-app journey. If activation is a weekly product metric, product analytics tools are typically a cleaner fit.
What is a practical definition of “cost-per-output” for analytics?
Cost-per-output is the total cost to produce a decision-ready metric or report. Include subscription fees plus the hours your team spends setting up, cleaning up, and explaining the numbers. A tool can be inexpensive but still have a high cost-per-output if it creates ongoing manual work.
What should I set up first if I am new to web analytics tools?
Start with one acquisition question (which channels bring signups) and one product question (what users do after signup). Then add tracking only for the actions needed to answer those questions. Avoid tracking everything “just in case,” because it slows down learning.
If you want a fast way to apply this framework in a SaaS product, Founder OS is one option that combines product analytics, user profiles, segmentation, and onboarding so you can get from install to first insight quickly. Start with a small dashboard (activation, adoption, retention) and iterate from there.
Unknown Author
Stay in the loop
Get the latest insights on SaaS growth, product strategy, and more delivered to your inbox.