PostHog Pricing Explained, Plus the Real Costs That Don’t Show Up on the Plan Page
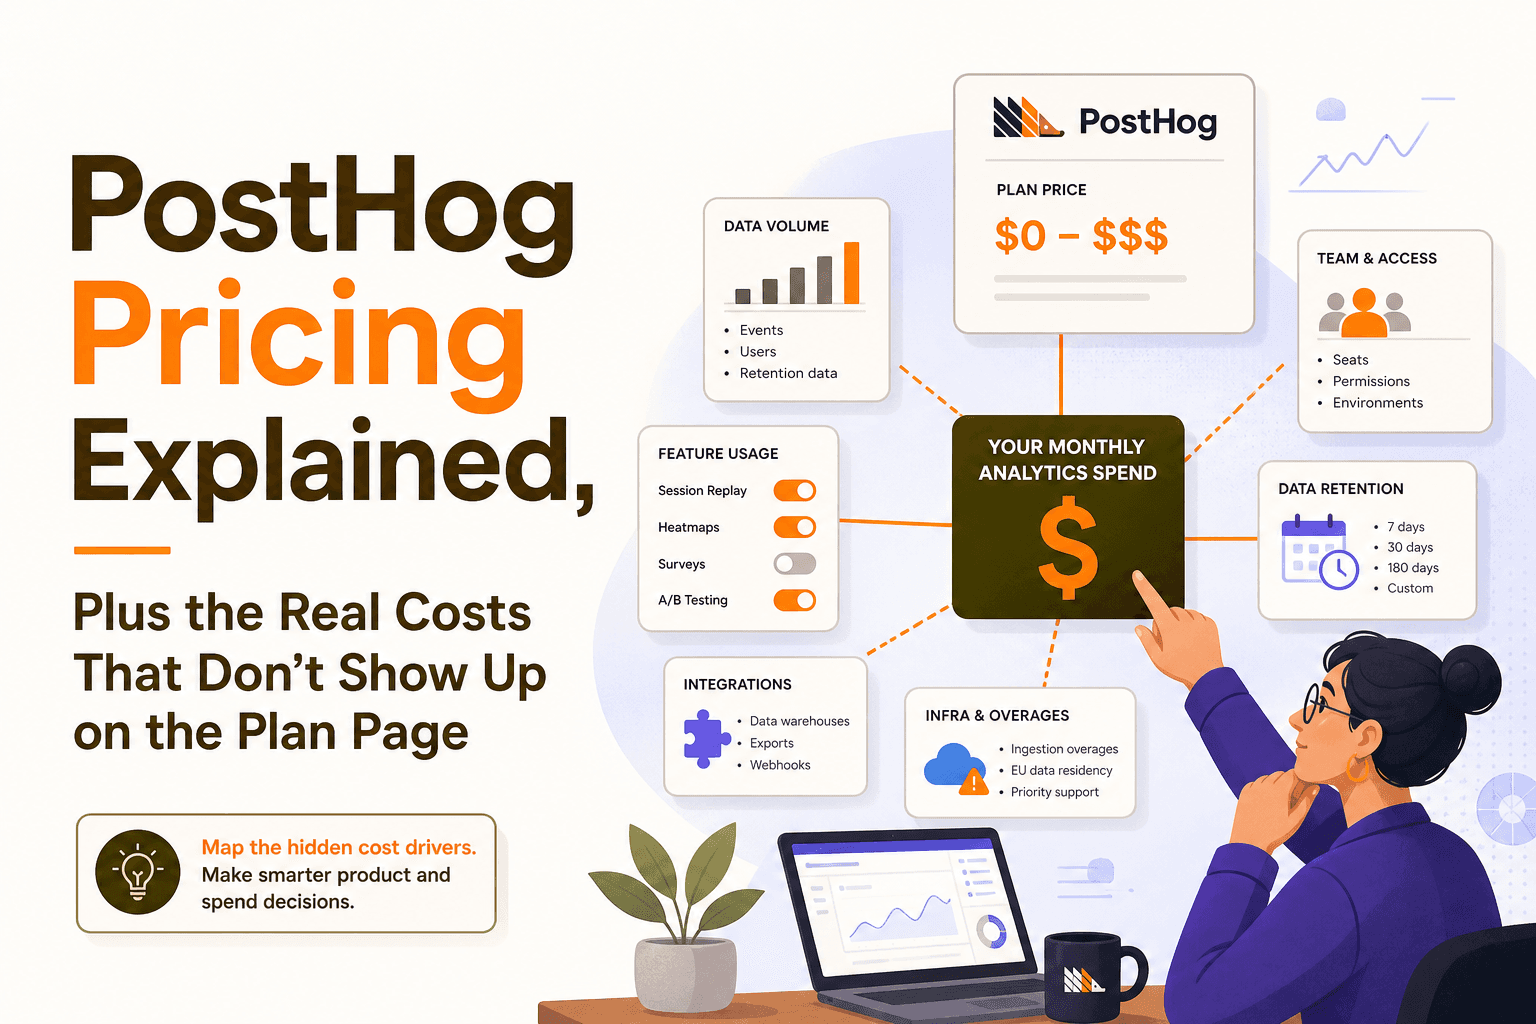
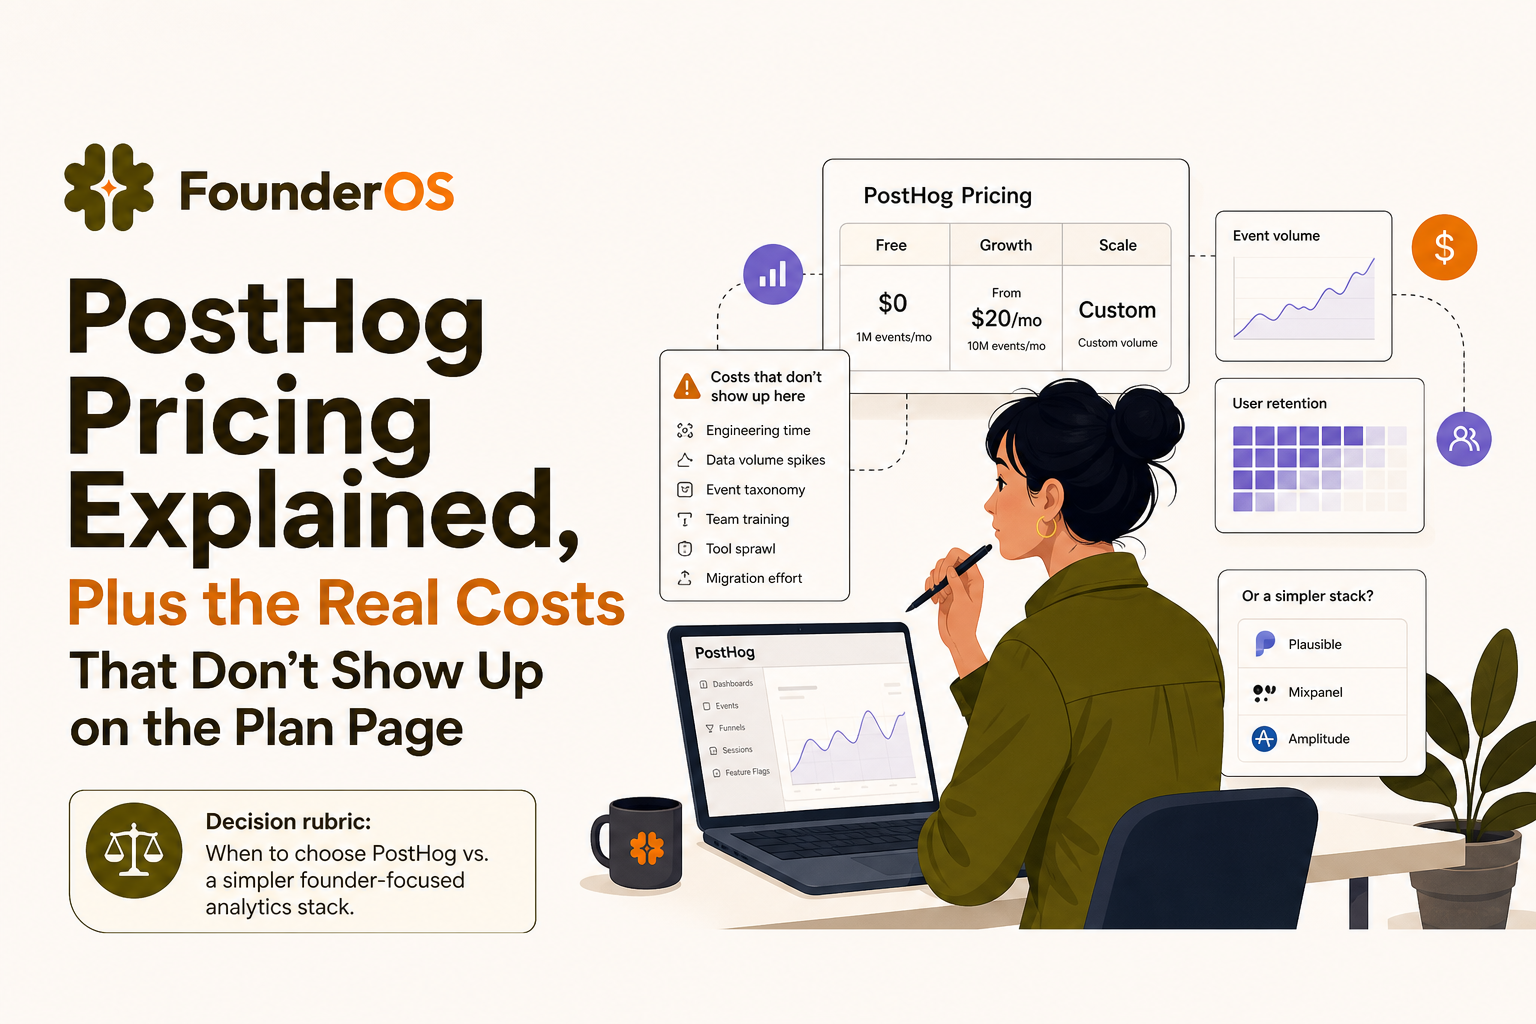
Most teams researching posthog pricing expect a simple plan comparison, then get surprised when the real bill is driven by events, add-ons, and the operational cost of keeping analytics clean. This guide breaks down what actually moves your spend, the hidden costs buyers miss, and a practical alternative when you want reliable product insights without building an internal analytics program.
- Your bill is usually moved by volume and scope: event volume, retention window, and which products you enable often matter more than the headline plan.
- Self-hosting can reduce vendor spend but adds real overhead: infra, upgrades, governance, and data quality work can outweigh savings for small teams.
- Choose based on your operating model: if you need deep customization and can staff it, PostHog can fit; if you need speed and simplicity, consider a founder-focused stack.

How PostHog pricing works in practice and what actually moves your bill
Use a simple cost-driver checklist before you compare plans
Instead of starting with plan names, start with a cost-driver checklist. This makes posthog pricing easier to sanity-check because you are mapping your actual usage to the levers that tend to change month to month.
- Event volume: how many events you send per month (page views, clicks, feature usage, API actions).
- Event definition strategy: raw events vs curated events (raw volume can explode fast).
- Retention window: how long you need to query history for product decisions (30, 90, 365 days).
- Products enabled: product analytics, session replay, feature flags, experimentation, surveys, etc.
- Seats and access patterns: who needs access, and whether you need role-based controls.
- Data destinations: whether you replicate data to a warehouse and how often.
A concrete way to estimate event volume (so you do not guess)
Here is a quick estimation method you can do in a spreadsheet. It is not perfect, but it is good enough to prevent surprises.
- List your core user actions (for a B2B SaaS): sign up, login, create workspace, invite teammate, connect integration, create first object, run report, export, etc.
- Assign events per active user per day. Many products land between 20 and 200 events per active user per day depending on how granular you track.
- Multiply by active users and days:
events/month = events per user per day × daily active users × 30. - Add non-user events: background jobs, API calls, webhooks, retries. These can add 10% to 50% if you are not careful.
Example: 1,500 daily active users × 60 events/user/day × 30 days = 2.7M events/month, plus 25% background and API events = ~3.4M events/month. If your instrumentation is “track everything” by default, that number can double quickly.
Common scenarios that change cost after month 1
Teams often approve a budget based on an initial month, then see usage drift. Watch these scenarios when evaluating posthog pricing:
- Adding session replay: replay can be extremely valuable for diagnosing drop-offs, but it changes data volume and storage needs. Decide upfront which users and which pages you will record.
- Expanding tracking to marketing pages: tracking anonymous traffic can multiply event volume. Consider sampling or tracking only key steps.
- Instrumenting internal tools and admin panels: often forgotten, often noisy.
- Turning on more teams: sales, support, and success want access. That can increase seats, dashboards, and governance needs.
The hidden costs buyers miss: data, engineering time, and operational overhead
Cloud vs self-host is not just a hosting decision
Self-hosting is frequently considered as a way to control posthog pricing, but it changes the work you own. A fair comparison includes both vendor spend and internal cost.
- Cloud: faster time to value, vendor-managed upgrades, predictable ops. You still own instrumentation and data quality.
- Self-host: more control and potentially lower vendor fees, but you take on reliability, scaling, backups, and security patching.
Operational overhead framework: the 6 workstreams you will pay for
Whether you self-host or use cloud, teams underestimate the ongoing work required to keep analytics trustworthy. Use this framework to estimate the true cost:
- Instrumentation maintenance: keeping event names consistent, updating tracking when UI changes, and preventing duplicate events.
- Taxonomy and governance: deciding what gets tracked, who can create events, naming conventions, and documentation.
- Identity resolution: handling anonymous-to-known transitions, merges, and cross-device behavior.
- Data quality monitoring: alerting when key events drop to zero, spike unexpectedly, or break by platform.
- Access control and privacy: role permissions, PII handling, retention policies, and deletion workflows.
- Enablement: training teammates so dashboards are used correctly and decisions do not rely on misread charts.
If you are a small team, these responsibilities can quietly become a part-time job for a founder or one engineer. That is often the biggest “hidden” line item behind posthog pricing.
Analytics hygiene benchmark you can use in planning
As a planning benchmark, many SaaS teams end up spending ongoing time on analytics hygiene somewhere between:
- Early stage: 2 to 6 hours/week (instrumentation fixes, dashboard updates, basic governance).
- Growing teams: 0.25 to 1.0 FTE equivalent (taxonomy, QA, enablement, and cross-team requests).
Even if your vendor cost is low, those hours have an opportunity cost. That is why a pure “plan page” comparison can be misleading.
When PostHog is the right choice vs when it is overkill
Decision criteria by team stage and operating model
Use the criteria below to decide whether posthog pricing is likely to be a good value for your team.
- Choose PostHog when:
- You want a flexible, modular analytics stack and you can invest in instrumentation quality.
- You expect to run multiple experiments, need feature flagging, or want deep control over how data is captured and queried.
- You have an engineer or data owner who can maintain tracking and governance.
- It can be overkill when:
- Your primary goal is fast activation and retention insights without spending weeks defining schemas and cleaning events.
- You need a simple path from “users did X” to “what should we change in onboarding” with minimal setup.
- You are a small B2B SaaS team where analytics ownership is unclear or constantly context-switching.
A quick scoring rubric (print this and use it in your buying call)
Score each item 1 to 5. If your total is 22+, PostHog is more likely to be worth the operational cost. If you are below 22, consider a simpler stack.
- Instrumentation maturity: do you already have consistent event naming and QA?
- Ownership: is there a clear person responsible for analytics health?
- Need for customization: do you need custom queries and advanced analysis frequently?
- Cross-team adoption: will multiple teams actively use analytics weekly?
- Time to value requirement: do you need insights in days, not weeks?
A practical alternative for B2B SaaS founders: Founder OS for product tracking plus GTM reporting
The need: fewer moving parts, faster answers
If you are evaluating posthog pricing and your main concern is not just the vendor bill but the time it takes to get to trustworthy answers, a founder-focused platform can be the cheaper path in total cost. Founder OS is built for B2B SaaS teams that want immediate visibility into the user journey, activation drop-offs, and retention signals without a long setup cycle.
What “faster to operationalize” looks like in real workflows
Here is a practical way to compare based on work output, not feature lists:
- From install to first insight: a single snippet starts capturing user behavior immediately, including common interactions like page views and clicks, so you can see a live event stream quickly.
- Diagnose activation issues: build a conversion path from signup to a key action, then drill from aggregate drop-off into individual user sessions to understand what happened.
- Turn behavior into action: create dynamic audiences based on what users actually did, then use those segments to drive onboarding experiences and re-engagement.
If your team is currently debating whether to self-host to control posthog pricing, it is worth asking a simpler question: “How many engineering hours are we willing to spend per month just to keep analytics usable?”
Switching checklist (so you do not lose history or break reporting)
If you are moving from an existing analytics setup, use this checklist to avoid common migration mistakes:
- Define the 10 to 20 events that matter for activation and retention (start small and expand).
- Map identities: ensure anonymous users can be stitched to known users after signup.
- Rebuild core views: funnels, retention cohorts, and key segments first.
- Run a 2-week parallel period: compare counts and conversion rates to catch tracking gaps.
- Deprecate noisy events: reduce volume and improve signal before you scale tracking.
For teams that also want to improve onboarding, pair analytics work with an onboarding checklist so your tracking and product changes stay aligned.
| What you are optimizing for | PostHog (typical fit) | Founder OS (typical fit) |
|---|---|---|
| Time to first useful dashboard | Good, but depends on instrumentation discipline and event design | Very fast setup focused on immediate journey visibility |
| Cost predictability | Can vary with event growth, add-ons, and expanded tracking scope | Designed for founders who want fewer moving parts and clearer operating cost |
| Engineering ownership | Best with a clear owner for taxonomy, QA, and governance | Lower ongoing overhead for small teams without a dedicated analytics owner |
| Activation diagnosis | Strong when you build and maintain clean funnels and events | Built around quick funnel diagnosis and drilling into real user behavior |
| GTM alignment | Possible, but often requires extra setup and process to operationalize | Combines product tracking with GTM reporting to keep teams aligned |
FAQ about PostHog pricing and total cost
Why does posthog pricing feel higher in month 2 or 3?
Because usage expands after initial setup. Common drivers include tracking more surfaces (marketing pages, admin tools), enabling additional products like replay, and adding more teammates. The best prevention is an event budget: decide which events are “must-have,” sample high-volume events, and review volume weekly for the first month.
Is self-hosting the best way to control posthog pricing?
Self-hosting can reduce vendor fees, but you trade that for infrastructure and maintenance cost: upgrades, scaling, backups, monitoring, and security patching. For small teams, the internal time cost often outweighs the savings unless you already have strong DevOps capacity.
What should I measure to estimate my real analytics cost?
Track (1) events per active user per day, (2) total monthly events, (3) percentage of events that are actionable vs noise, and (4) hours per week spent on analytics hygiene. Those four metrics usually explain most surprises tied to posthog pricing and operational overhead.
How do I decide between tools if I mainly need conversion insights?
If your main need is funnel analysis and activation diagnostics, prioritize tools that get you from install to reliable funnels quickly, with minimal event cleanup. If you also need deep customization and have an owner for governance, PostHog can be a strong fit.
If you are evaluating posthog pricing and want a faster, lower-overhead way to get trustworthy activation and retention insights, consider Founder OS. You can start free, instrument once, and get immediate visibility into what users do, where they drop off, and which segments need better onboarding.

Stay in the loop
Get the latest insights on SaaS growth, product strategy, and more delivered to your inbox.