
Funnel Analysis for SaaS Teams - A Diagnostic Playbook When Conversions Don’t Make Sense
If your dashboards say the conversion rate is down but revenue is flat (or the opposite), you do not have a “growth problem” yet, you have a funnel analysis problem. When the steps look right but the story does not match what sales, billing, and retention are seeing, the fastest path to clarity is to audit how the funnel is defined, measured, and segmented before you ship more changes.
- Start with a revenue-truth funnel definition: clear entry rules, a single success event, and a time window that matches your buying cycle.
- Before optimizing UX, eliminate seven common measurement failure modes that create fake drop-offs (identity, event design, timing, missing steps, and more).
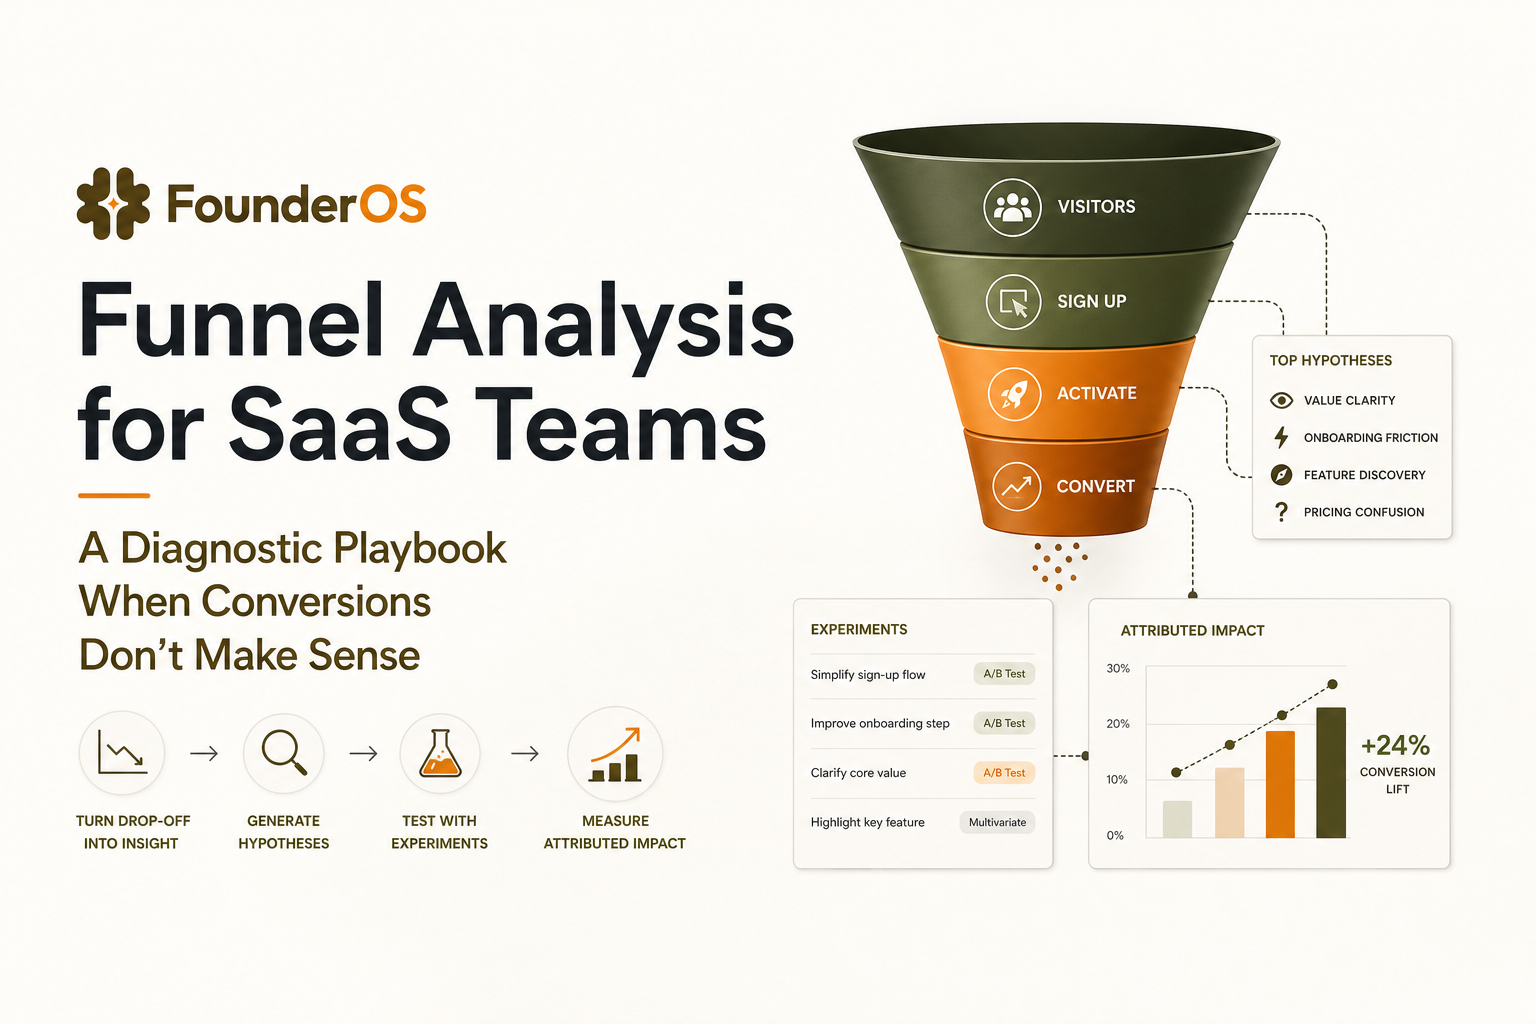
- Turn each drop-off into a test plan with explicit hypotheses, guardrails, and attribution so you can prove impact, not just “movement.”
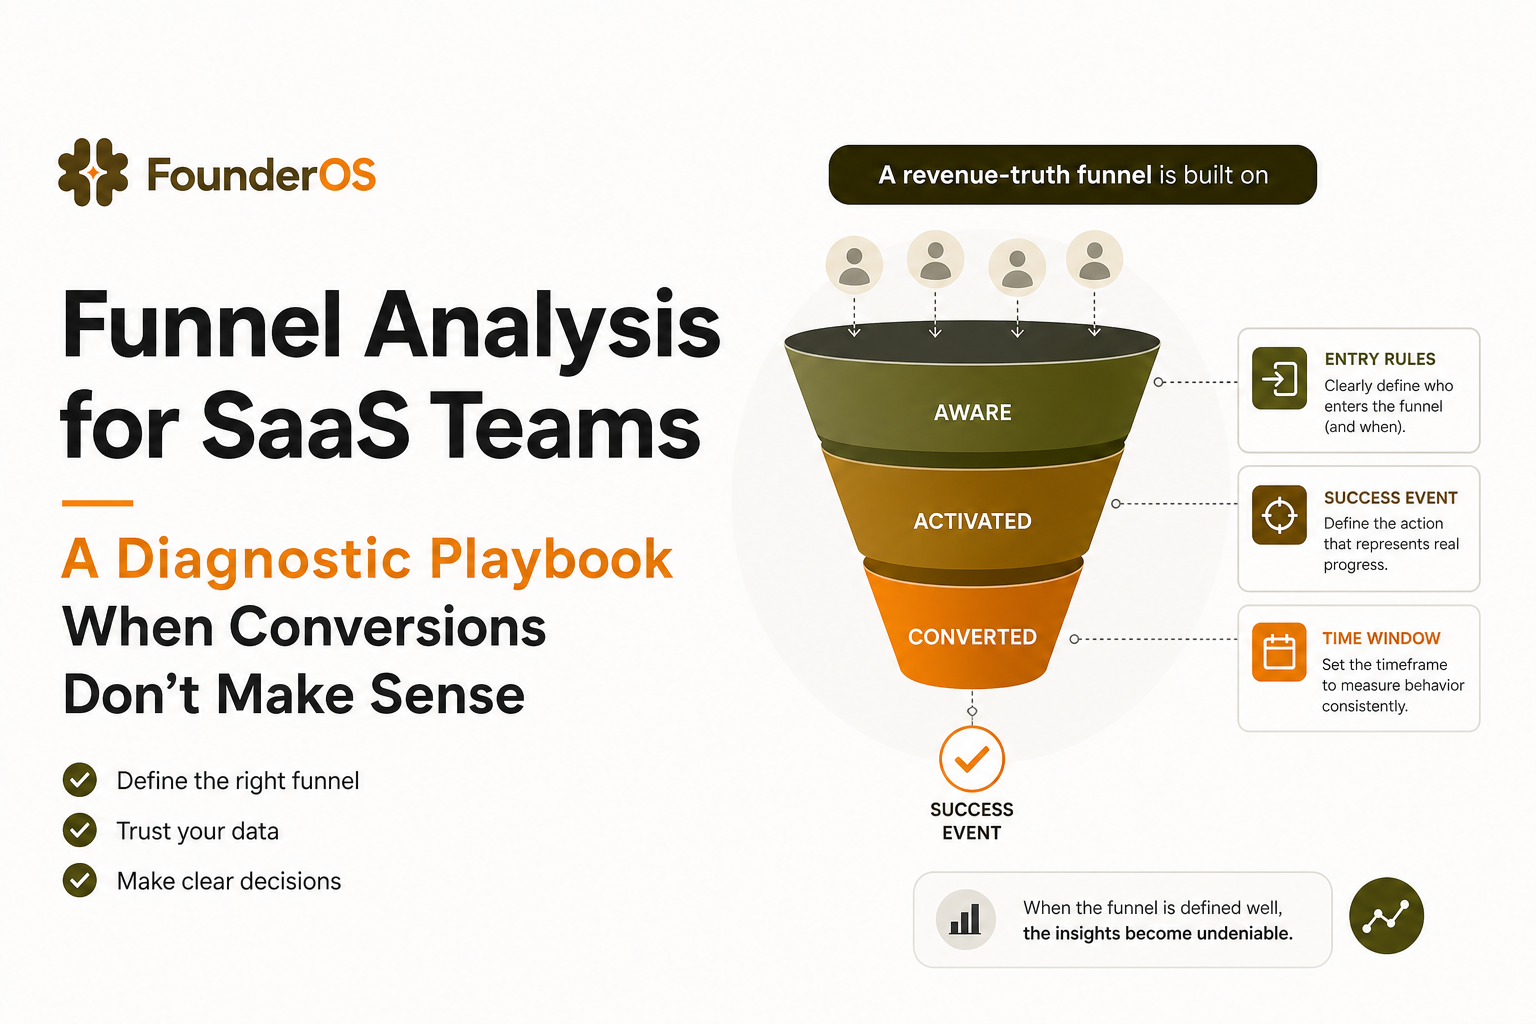
Start with a funnel that matches how revenue actually happens
Most “nonsense” conversions happen because the funnel answers the wrong question. A product team often builds a funnel that reflects UI steps, while revenue follows a different path: multiple sessions, multiple devices, multiple stakeholders, and sometimes a human-assisted close.
Step 1: Choose the funnel scope by revenue motion
Pick the smallest funnel that still predicts money. Use one of these scopes and commit to it:
- Self-serve revenue scope: signup → activation → checkout started → paid.
- Sales-assisted scope: signup (or lead created) → activated account → qualified intent action → meeting booked → opportunity created → closed-won.
- Expansion scope: active account → key feature adopted → limit reached → upgrade intent → upgraded.
Criteria: Your success event must have a direct, auditable mapping to billing or pipeline, not just “engagement.”
Step 2: Define entry rules that prevent “junk starts”
Entry rules are the #1 source of fake drop-offs. If your funnel includes users who were never meant to convert, every step will look broken.
Use this entry checklist:
- Channel constraints: include only acquisition sources you expect to monetize (exclude internal, partners, test traffic).
- Account constraints: exclude duplicates, spam, and free-email domains if you sell mid-market only.
- Eligibility constraints: include only users who can reach the success event (permissions, plan availability, geo restrictions).
Practical example: If only admins can start a trial, your funnel should start at “admin created” or “admin invited and accepted,” not “any signup.”
Step 3: Pick one success event tied to revenue outcomes
Choose a single event that is the “truth” of conversion for the funnel. If you pick multiple, your denominator shifts and your funnel analysis becomes an argument.
- Self-serve: subscription_created or invoice_paid.
- Sales-assisted: opportunity_created or closed_won (from CRM), with product events as leading indicators.
- Activation: a specific “value moment” that correlates with paid conversion, such as first_report_generated or first_integration_connected.
Rule: If your success event can happen without the user receiving value, it is not a success event. “Trial started” is often a setup action, not value.
Step 4: Set time windows that match your buying cycle
Time windows can manufacture drop-offs. If you measure signup → paid in 7 days but your median sales cycle is 21 days, your funnel will always look “bad.”
Use a simple window-setting method:
- Compute median and 75th percentile time-to-success for converted users (from first touch to success event).
- Set your funnel window to the 75th percentile for the motion you are measuring.
- Track a second “fast path” window (for example, 24 hours or 7 days) to monitor speed, not just completion.
For benchmarks, OpenView and other SaaS research frequently highlight that conversion and activation timelines vary widely by ACV and complexity. Use your own distribution first, then compare to broader benchmarks. One useful reference on SaaS metrics definitions is SaaS metrics guidance to align terminology across teams.
Funnel analysis diagnostics - the 7 failure modes that create fake drop-offs
Before you “optimize the product,” assume the funnel is lying. The goal of this section is to make your funnel analysis resilient: the same funnel should tell the same story when you slice by cohort, device, and time.
Failure mode 1: Event names describe UI, not intent
If your steps are “Clicked button A” and “Visited page B,” you are measuring navigation, not progress. UI events change often, and they do not always represent the user achieving something.
Fix with an intent event design:
- Define events as verbs with outcomes: workspace_created, integration_connected, report_exported.
- Attach properties that explain context: plan, role, integration type, template used, error codes.
- Keep UI events only when they are the only proxy for an outcome, and then version them.
Diagnostic: For each funnel step, answer: “If this event fires, did the user move closer to value?” If not, redesign the step.
Failure mode 2: Identity is fragmented across devices and roles
B2B conversion often involves multiple people. If your identity stitching is weak, your funnel analysis will show users “dropping” when they actually continued on another device or as another teammate.
Common symptoms:
- High drop-off between “signup” and “activation,” but support tickets show users are active.
- Activation appears to happen before signup (ordering anomalies).
- Paid conversion is attributed to “unknown user.”
Fix checklist:
- Use a stable account_id and user_id on every event after authentication.
- Alias pre-login anonymous IDs to user IDs at login.
- For multi-user accounts, build funnels at the account level when revenue is account-based.
In practice, teams using tools like Founder OS often resolve this by tying every event to a person profile and also persisting an account identifier, so you can analyze either user journeys or account journeys without re-instrumenting.
Failure mode 3: Time windows and conversion logic do not match the step relationship
Some steps must happen in order (create workspace before invite teammates). Others can happen in any order (read docs, then come back later to connect an integration). If you force strict ordering everywhere, you will create drop-offs that are just “non-linear behavior.”
Fix with step typing:
- Ordered steps: enforce sequence.
- Unordered milestones: allow completion in any order within the window.
- Repeatable steps: measure first occurrence only, then separately measure frequency.
Diagnostic: Rebuild the funnel twice: once ordered, once “any order.” If conversion jumps dramatically, your users are non-linear or your instrumentation is inconsistent.
Failure mode 4: Missing “system events” that bridge the user journey
Many funnels break at steps that are not user actions: webhook received, background job completed, permission granted, email verified, payment confirmed. If you do not track system outcomes, the funnel will show a drop-off that is actually a processing delay or failure.
Fix: Add system events with explicit success and failure properties:
- integration_sync_completed with status=success|failed and error_code
- email_verification_completed with method
- payment_confirmed with provider and decline_reason
Diagnostic: If a step depends on async processing, measure “time to system success” and plot the distribution. A long tail usually signals reliability issues, not UX.
Failure mode 5: Properties are inconsistent or nullable, breaking segmentation
A funnel can look fine overall and still be nonsense when segmented. Often the segmentation is wrong because properties are missing for a subset of events.
Fix with a property contract:
- For each event in the funnel, define required properties (for example, plan, role, source).
- Alert when required properties are null or outside allowed values.
- Version changes explicitly (for example, onboarding_variant=v2).
Diagnostic: Create a “data quality segment” for events missing required properties. If that segment is large, your segmentation conclusions are unreliable.
Failure mode 6: You are measuring the wrong unit, user vs account vs workspace
If revenue is per account but your funnel is per user, your drop-offs will look worse as teams grow, because more users participate in the journey. Conversely, if your product is truly single-player but you measure at account level, you may hide churn risk.
Decision rule:
- Choose account-level funnels when payment, limits, and activation are shared.
- Choose user-level funnels when each user can independently reach value and convert.
- Use hybrid when activation is user-level but conversion is account-level: measure both and connect them.
For teams trying to understand buying signals, pairing this with behavioral segmentation is powerful. If you want a concrete method, see how to identify high intent users in saas.
Failure mode 7: Bots, internal users, and retries inflate the top of funnel
Fake starts create fake drop-offs. This is especially common when you auto-track clicks and page views and then start funnels too early.
Fix checklist:
- Exclude internal domains and known IP ranges.
- Filter obvious bot patterns (0-second sessions, extreme event rates).
- Deduplicate retries: if signup_submitted can fire multiple times, create a canonical signup_completed event.
Diagnostic: Compare conversion rate for “clean cohort” (verified email plus non-internal domain) vs overall. If the gap is large, your funnel analysis is polluted at the top.
Turn drop-off into a test plan and prove impact
Once your measurement is trustworthy, the job changes: convert each drop-off into a ranked list of hypotheses, then run experiments where you can attribute the lift to a specific step. This is where funnel analysis becomes a revenue tool, not a dashboard.
Step 1: Translate each drop-off into a falsifiable hypothesis
Use this template:
- Observation: Step X → Y has 55% drop-off for segment S within 14 days.
- Hypothesis: Users drop because they cannot complete requirement R (permission, data, clarity, time).
- Prediction: If we remove or simplify R, conversion from X → Y increases by N% with no increase in refunds/churn.
- Measurement: Primary metric is step conversion; secondary metrics are time-to-value, support tickets, and downstream paid conversion.
Concrete example: If “integration_connected” is the largest drop, the hypothesis might be “users do not have credentials ready.” Prediction: adding a credential checklist and saving progress increases connection rate by 10% and reduces median time-to-connect by 20%.
Step 2: Prioritize with an impact and confidence score
Use a simple scoring model so you do not chase noisy wins:
- Impact (1-5): estimated revenue influence if this step improves (use historical correlation to paid).
- Reach (1-5): percent of eligible users who hit this step.
- Confidence (1-5): evidence strength (session replays, interviews, error logs, support tags).
- Effort (1-5): engineering and design cost.
Rank by (Impact × Reach × Confidence) ÷ Effort. This forces you to pick tests that matter, not just tests that are easy.
Step 3: Design experiments that isolate the step you changed
To attribute lift, your experiment must change one step without moving the goalposts.
Guardrails:
- Do not change the funnel definition mid-test.
- Freeze entry rules and time window for the cohort under test.
- Track downstream effects: a step lift that reduces paid conversion is not a win.
Attribution tip: Use a holdout group when possible. If you cannot, use difference-in-differences: compare the targeted segment vs a similar untouched segment over the same time period.
Step 4: Close the loop with cohort comparisons and user-level inspection
Aggregate charts tell you what changed; user-level inspection tells you why. A tight workflow looks like this:
- Compare funnel conversion for variant A vs B for the target cohort.
- Drill into the users who dropped at the same step in both variants.
- Tag the dominant failure reason (missing data, confusion, technical error).
- Ship the next iteration focused on the dominant reason.
This is also where onboarding content matters. If the drop-off is education-related, align the fix with an adaptive onboarding checklist that triggers based on what the user actually did, not what you hope they did.
A worked example from acquisition to activation to paid
Here is a practical example you can copy. Imagine a B2B SaaS with a free trial. Revenue is self-serve for SMB and sales-assisted for larger accounts. The team complains: “Activation is up, but paid is flat.”
Define the revenue-truth funnel
- Entry: verified email AND non-internal domain AND created workspace.
- Activation success event: first report generated (value moment).
- Paid success event: subscription_created.
- Window: 21 days (75th percentile time-to-paid for converted users).
- Unit: account-level (billing is per workspace).
Run diagnostics before product changes
- Identity check: paid events had account_id but activation events had only user_id for 18% of accounts. Fix stitching.
- System event check: report generation depends on data sync. 12% of sync jobs were failing with a specific error_code.
- Segmentation check: “source” property missing for 22% of signups due to a tracking bug on one landing page.
After fixing measurement, the story changes: activation did not truly increase; it was being overcounted for users whose activation event fired without a completed sync.
Convert the real drop-off into a test plan
- Observation: workspace_created → integration_connected drop-off is 48% for accounts from content marketing.
- Hypothesis: content-driven users need more guidance and are choosing the wrong integration type.
- Experiment: add an integration recommender and a progress-saving flow, plus an error-specific help panel when sync fails.
- Primary metric: integration_connected rate within 7 days.
- Secondary metrics: sync_success rate, time-to-first-report, paid conversion within 21 days.
To operationalize this, many teams pair behavior-based segments with onboarding interventions. If you are evaluating tooling, it is worth understanding how different product analytics platforms support cohort comparisons, identity resolution, and drill-down into individual sessions, because those capabilities determine whether your funnel analysis loop is hours or weeks.
| Drop-off signal | Most likely cause | Diagnostic query or check | Fix that preserves attribution |
|---|---|---|---|
| Activation rises but paid stays flat | Activation event not tied to value, or identity mismatch | Correlation of activation to paid by cohort; audit account_id coverage | Redefine activation to a value moment; stitch identities and re-run baseline |
| Big drop between two “simple” steps | Async system failure or long processing time | Track system success/fail events; measure time-to-success distribution | Add system events; fix reliability before UX tweaks |
| Segment results contradict sales feedback | Missing or inconsistent properties | Null-rate by property and event; validate allowed values | Enforce property contract; backfill where possible and re-baseline |
| Drop-off disappears when you widen the window | Window too short for buying cycle | Compare median and P75 time-to-success for converters | Set window to P75; track fast-path separately |
FAQ
How often should we redo our funnel definition?
Redo it any time your revenue motion changes: new pricing model, new sales-assisted motion, a major onboarding redesign, or a new “value moment.” Otherwise, review quarterly to confirm entry rules, time windows, and success events still match how customers buy.
What is the fastest way to tell if our funnel analysis is wrong?
Run three checks: (1) identity coverage (percent of events with stable user_id and account_id), (2) property null rates for segmentation fields like source and plan, and (3) time-to-success distribution for converters to validate your window. If any of these fail, fix measurement before optimizing.
Should we build funnels at user level or account level?
Match the unit to how you charge and how value is delivered. If billing and usage limits are shared, use account-level funnels. If each user independently reaches value and converts, use user-level. If activation is user-level but conversion is account-level, measure both and connect them through account_id.
How do we connect funnel improvements to revenue without overclaiming?
Use a holdout group when possible. If not, use difference-in-differences with a comparable segment. Keep the funnel definition fixed during the test, measure downstream conversion (not just step lift), and report confidence intervals or at least sample sizes so stakeholders can judge uncertainty.
If you want to run this diagnostic loop faster, Founder OS helps teams go from install to first insight quickly, then iterate with real-time event tracking, user profiles, segmentation, and drill-down funnel analysis so you can move from “conversion doesn’t make sense” to a measurable, attributable plan. Start with one revenue-truth funnel, fix the measurement failure modes, then ship one experiment at a time and prove impact.

Stay in the loop
Get the latest insights on SaaS growth, product strategy, and more delivered to your inbox.