
Revenue Attribution For B2B SaaS, A Practical Framework You Can Implement This Week
Revenue attribution in B2B SaaS becomes trustworthy when you define a tight scope, unify identities across systems, and apply a multi-touch model you can explain and audit. Most teams do the opposite: they start with a model in a spreadsheet, then spend months arguing about why the numbers feel wrong.
- Pick an attribution scope first (revenue definition, conversion moment, journey window) so every report answers one decision.
- Build a single buyer journey by resolving identity across CRM, billing, marketing touchpoints, and product events.
- QA your outputs (duplicates, self-referrals, offline influence, stage timing drift) before you present channel ROI.
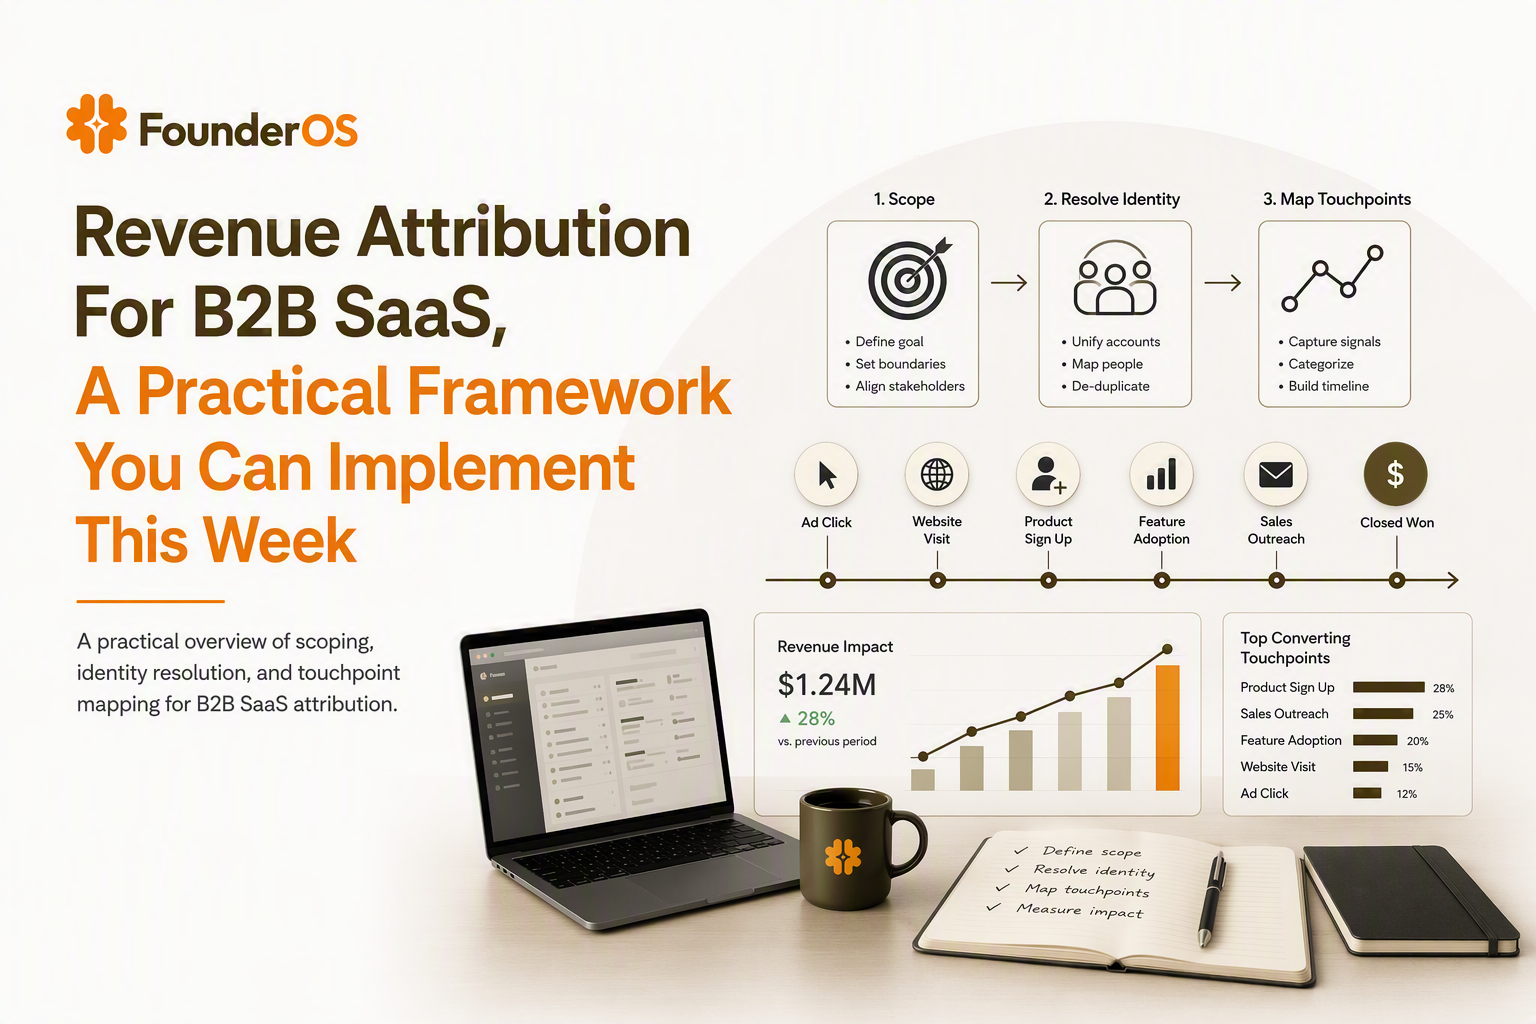
Choose the right revenue attribution scope for B2B SaaS
Revenue attribution scope is the set of rules that decides which deals count, when credit is assigned, and how far back you look for influencing touches. If you do not lock scope before modeling, every stakeholder can “win” an argument by changing definitions midstream.
Step 1: Define what counts as revenue (and what does not)
Use one revenue object for your first iteration, then expand later. Pick one:
- New ARR only: best for channel budget decisions and acquisition experiments.
- New + expansion ARR: best when PLG usage drives upgrades and sales assists upsells.
- Cash collected: best when payment failure and collections change the true value of acquisition.
Checklist (write this into your doc):
- Are refunds, chargebacks, and credits included?
- Do annual prepaids count as full contract value or normalized ARR?
- Do you exclude churned-within-X-days deals (implementation failures) from channel ROI?
Step 2: Choose the conversion moment you will attribute to
Pick one conversion moment as the “stamp” for assigning credit. Common options:
- Opportunity created: tells you what created pipeline, but it is easy to game and over-credits high-volume sources.
- Opportunity closed-won: aligns to revenue, but lag makes it slower for weekly decisions.
- First paid invoice / subscription start: best when billing is the truth source and sales stages are messy.
In our experience working with B2B SaaS teams that sell both self-serve and sales-assisted, “subscription start” reduces internal debate because finance can reconcile it and marketing can still tie it back to earlier touches.
Step 3: Set a journey window you can defend
Define two windows so you avoid mixing long-cycle enterprise motion with short-cycle self-serve.
- Lookback window: how far back touches can earn credit (example: 90 days for self-serve, 180 to 365 for sales-led).
- Engagement timeout: when a journey resets after inactivity (example: 30 days).
Decision rule: choose the shortest window that still captures most meaningful touches in your business, then track “unattributed revenue” as a first-class metric rather than silently stretching the window to make charts look better.
Map data sources to a single buyer journey
A single buyer journey requires an identity graph that links people, accounts, and products across CRM, billing, marketing touchpoints, and in-product event streams. If identity resolution is weak, every revenue attribution model becomes a math exercise on duplicate records.
Minimum dataset to start (not the dream state)
You can ship a credible first pass with these fields:
- CRM: lead/contact ID, account ID, opportunity ID, opportunity created date, close date, amount or ARR, stage history if available, owner.
- Billing: customer ID, subscription start date, plan, MRR/ARR, invoice status.
- Marketing touches: campaign/source/medium, timestamp, touch type (ad click, form fill, webinar attendance), anonymous ID if applicable.
- Product events: user ID, account/workspace ID, timestamp, key events (signup, invite teammate, connect integration, run first report, etc.).
Identity resolution rules that prevent the classic failures
Write explicit matching rules in order, and stop once you get a high-confidence link. A practical sequence:
- Hard match: billing customer ID to CRM account, or subscription email domain to account domain (excluding free email domains).
- User to contact: verified email address match between product user and CRM contact.
- Account/workspace to account: workspace domain or SSO tenant to CRM account.
- Fallback: last-seen UTM source on the user profile, only if identity is otherwise unknown.
Quality gates:
- Never merge two people solely because they share a company domain if you sell to agencies or consultants.
- Never use IP address as a stable identity in B2B; VPNs and shared networks will pollute joins.
- Store a “match confidence” flag so you can segment analysis later (high-confidence vs inferred).
Make touchpoints comparable by normalizing them
Before modeling, normalize every touch into a single schema:
- entity_id (person or account), timestamp, channel, campaign, touch_type, source_system
This is what lets you run the same revenue attribution logic across ads, outbound sequences, partner referrals, and product-led motions without rewriting the report every time a new channel appears.
Implement a practical revenue attribution model you can defend internally
A defensible revenue attribution model is one that uses consistent inputs, assigns credit with rules stakeholders can repeat, and produces stable rankings when you rerun it weekly. The easiest way to build trust is to compare multiple models on the same example and show where each one breaks.
Use one consistent example journey
Example timeline for one account that eventually buys:
- Day 0: LinkedIn ad click
- Day 3: Webinar registration
- Day 10: Product signup (self-serve)
- Day 18: Sales demo
- Day 35: Closed-won
Assume $12,000 new ARR on close-won.
Compare common multi-touch options with decision criteria
- First-touch: 100% credit to the first recorded touch. Use when your primary question is “what creates net-new demand?”
- Last-touch: 100% credit to the final touch before conversion. Use when you are optimizing conversion capture (brand vs non-brand search, retargeting, demo forms).
- Linear: equal credit across all touches. Use when you need a neutral baseline for internal alignment.
- Time-decay: more credit to touches closer to conversion. Use when your cycle is long and you want recency sensitivity.
- Position-based (U-shaped): higher credit to first and last, smaller share to middle touches. Use when you believe both demand creation and conversion capture matter.
Make the model explicit with a simple allocation table
Using the five-touch example above, credit for $12,000 ARR would look like:
- First-touch: LinkedIn $12,000
- Last-touch: Sales demo $12,000 (or the last marketing touch if you exclude sales activities)
- Linear: $2,400 to each touch
- Position-based (40/20/40): $4,800 first touch, $4,800 last touch, remaining $2,400 split across middle touches ($800 each)
When we tested position-based vs last-touch on mixed PLG plus sales-assisted motions, our team found position-based produced fewer “budget whiplash” swings week to week because it did not let one late-stage channel absorb all the credit during promo-heavy periods.
Rules you should decide upfront (or the model will be debated forever)
- Include or exclude sales touches: if included, define which events count (demo, discovery call, proposal sent) and how they are recorded.
- Handle repeated touches: cap identical touches (example: no more than 3 retargeting clicks per person) to avoid inflating noisy channels.
- Multi-person buying committees: decide whether credit is computed at the person level then rolled up, or directly at account level.
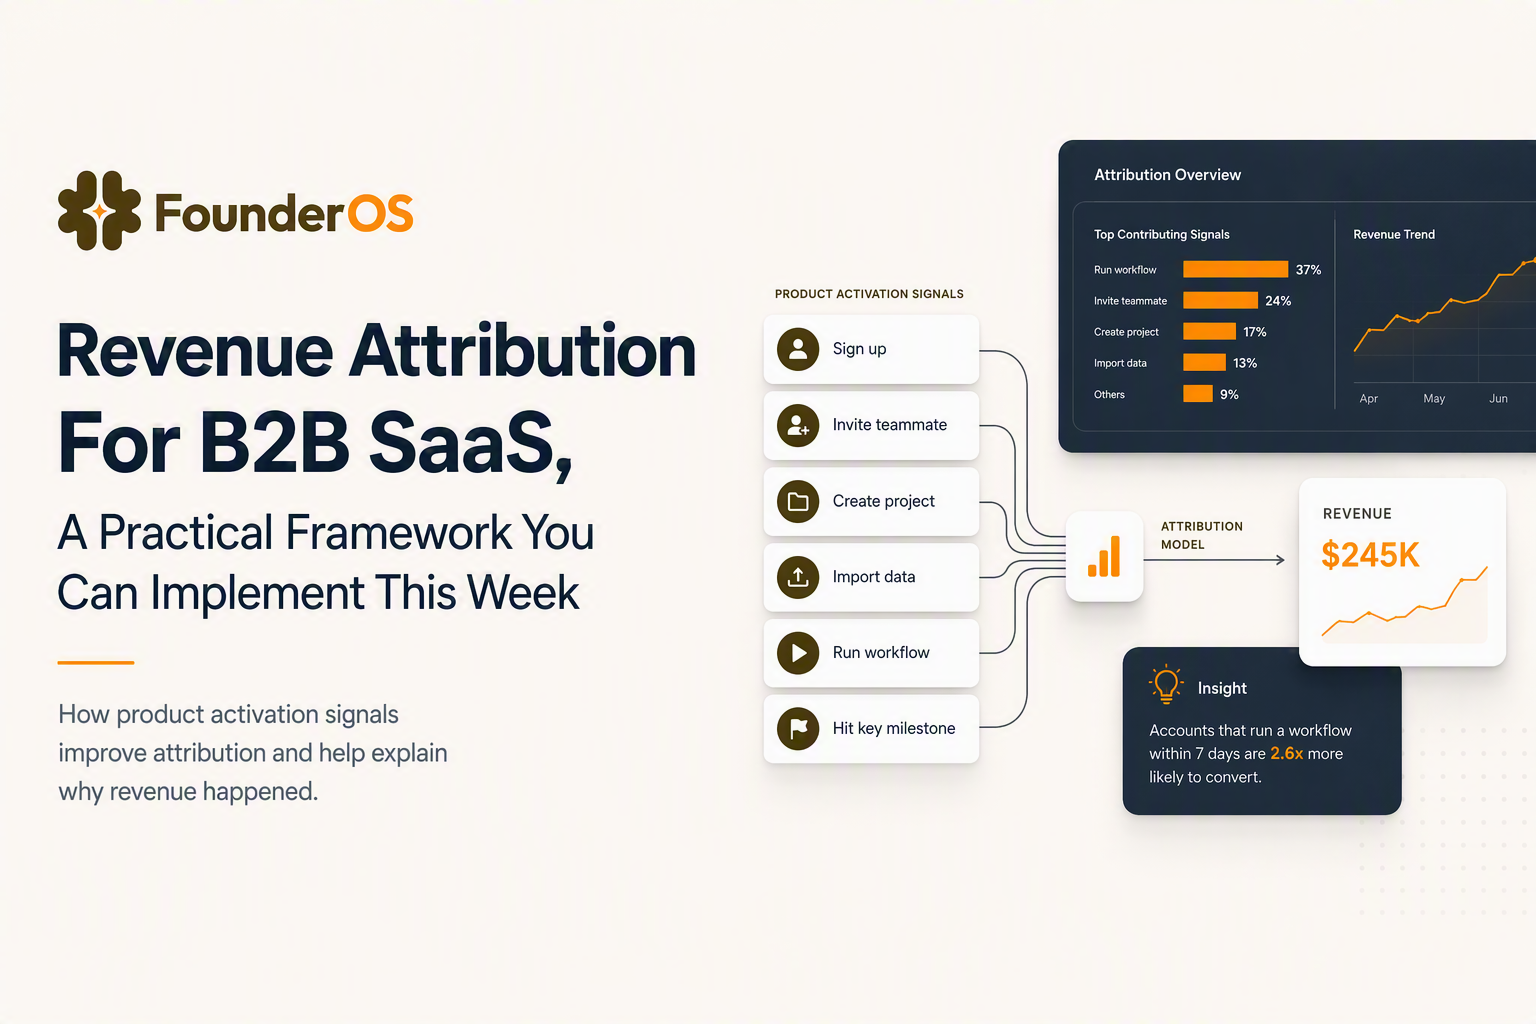
Add product-led signals to fix the biggest attribution blind spot
Product event data fixes revenue attribution blind spots by explaining why a deal converted, not just which channel appeared in the touch list. For many B2B SaaS teams, the last “marketing” touch is not the reason revenue happened; activation and key feature usage are.
Pick 3 product events that correlate with paid conversion
Start with a short list you can validate quickly:
- Activation event: the first moment a user experiences core value (example: “first project created” or “first integration connected”).
- Collaboration event: inviting a teammate, adding seats, or sharing an artifact.
- Habit event: repeated use of a sticky feature within a short period (example: 3 runs of a key workflow in 7 days).
Implementation rule: store these events on the user profile and also roll them up to the account/workspace so you can connect usage to opportunities and subscriptions.
Use product events to create attribution splits you can act on
Instead of only asking “which channel drove ARR?”, also ask “which channels drive ARR from activated accounts?”. That one segmentation step often resolves the argument between demand gen and product teams because it separates volume from quality.
- Channel ROI (all revenue)
- Channel ROI (activated revenue)
- Channel ROI (high-adoption revenue)
We initially assumed the best-performing paid channel would stay best after filtering to activated accounts, but our audits regularly show a different ranking once activation is included, which changes where the next month’s budget should go.
Connect product signals to lead scoring without turning it into a science project
A pragmatic scoring rubric uses a few discrete thresholds rather than continuous weights. Example:
- +10 points: activation event completed
- +5 points: invited 1+ teammate
- +5 points: used key feature 3+ times in 7 days
- -10 points: no activity for 14 days after signup
Then route scoring outputs into two actions: sales follow-up prioritization and lifecycle messaging. The reason this matters for revenue attribution is simple: if sales only follows up on activated accounts, your “sales touch” will look like it created revenue when it actually captured it.
Validate and debug attribution before you present ROI numbers
Attribution QA prevents false confidence by catching duplicates, self-referrals, offline influence, and timing drift between pipeline stages and billing events. A single QA pass each week is usually enough to keep revenue attribution stable and credible.
QA checklist 1: Duplicates and identity collisions
- Count unique accounts in CRM vs billing; investigate gaps rather than forcing joins.
- Look for multiple CRM accounts mapping to one billing customer ID, or one workspace mapping to multiple accounts.
- Check free email domains that slipped into B2B matching and created false merges.
QA checklist 2: Self-referrals and “direct” traffic inflation
- Exclude your own domain and internal IP ranges from marketing touch logs.
- Normalize “direct/none” so it does not overwrite prior source on redirects and subdomain hops.
- For product-to-marketing flows, preserve original UTM parameters on signup, not just last page view.
QA checklist 3: Offline and dark touches
- Add a manual touch type for events like conferences, partner intros, or outbound calls where tracking is incomplete.
- Track “unknown” explicitly; do not force unknown revenue into a convenient channel.
QA checklist 4: Stage timing drift
- Compare opportunity close date vs subscription start date; flag large gaps for review.
- Watch for backfilled opportunities that create impossible timelines (touches after close-won).
Turn attribution into weekly GTM decisions
Weekly decisions require revenue attribution outputs that map directly to three levers: budget allocation, sales follow-up priorities, and experiment backlogs. If your report does not change a weekly action, it is a data artifact, not an operating system.
Decision dashboard 1: Channel budget moves you can justify
Use a single table that shows, per channel:
- Attributed pipeline and attributed revenue (same model each week)
- Activation rate by channel (from product events)
- Median time-to-conversion (so you do not kill channels with longer cycles)
- % unattributed revenue (a health metric, not an embarrassment)
Action rule: only move budget when the channel ranking is stable across two consecutive periods and QA checks pass, otherwise you are reacting to noise.
Decision dashboard 2: Lead and account prioritization
Combine attribution and product signals into a simple follow-up queue:
- Top: activated accounts with high-intent touch (demo request, pricing page view, sales reply)
- Middle: activated accounts without high-intent touch (trigger nurture, in-app prompts)
- Bottom: non-activated accounts regardless of source (fix onboarding, not sales effort)
Decision dashboard 3: Experiment prioritization
Turn disputes into tests by mapping “attribution disagreements” to experiments. Examples:
- If last-touch says branded search wins but product activation is low, run onboarding experiments for that cohort before increasing spend.
- If first-touch says content wins but time-to-conversion is long, test retargeting or sales assist sequences rather than cutting content.
| Attribution choice | Best used for | Known bias | One validation check |
|---|---|---|---|
| First-touch | Demand creation and top-of-journey efficiency | Over-credits discovery channels | Compare to activated revenue by channel |
| Last-touch | Conversion capture optimization | Over-credits late-stage channels | Exclude sales touches and re-run |
| Linear | Baseline alignment across teams | Understates pivotal touches | Check stability week over week |
| Time-decay | Long cycles where recency matters | Discounts early demand creation | Ensure lookback window is consistent |
| Position-based | Balancing creation and conversion | Assumes first and last are most important | Review outliers with many touches |
FAQ
If you want to implement this blueprint without waiting on a data team, Founder OS can help you capture key product events, tie them to user profiles and segments, and review a weekly GTM report that connects product-led behavior to revenue attribution outcomes.

Best Analytics Software for B2B SaaS, A Category-Based Shortlist and Buyer Checklist
Find the best analytics software for B2B SaaS with a 1-minute chooser, category shortlists, GA4 parity checklist, and a 14-day rollout plan.
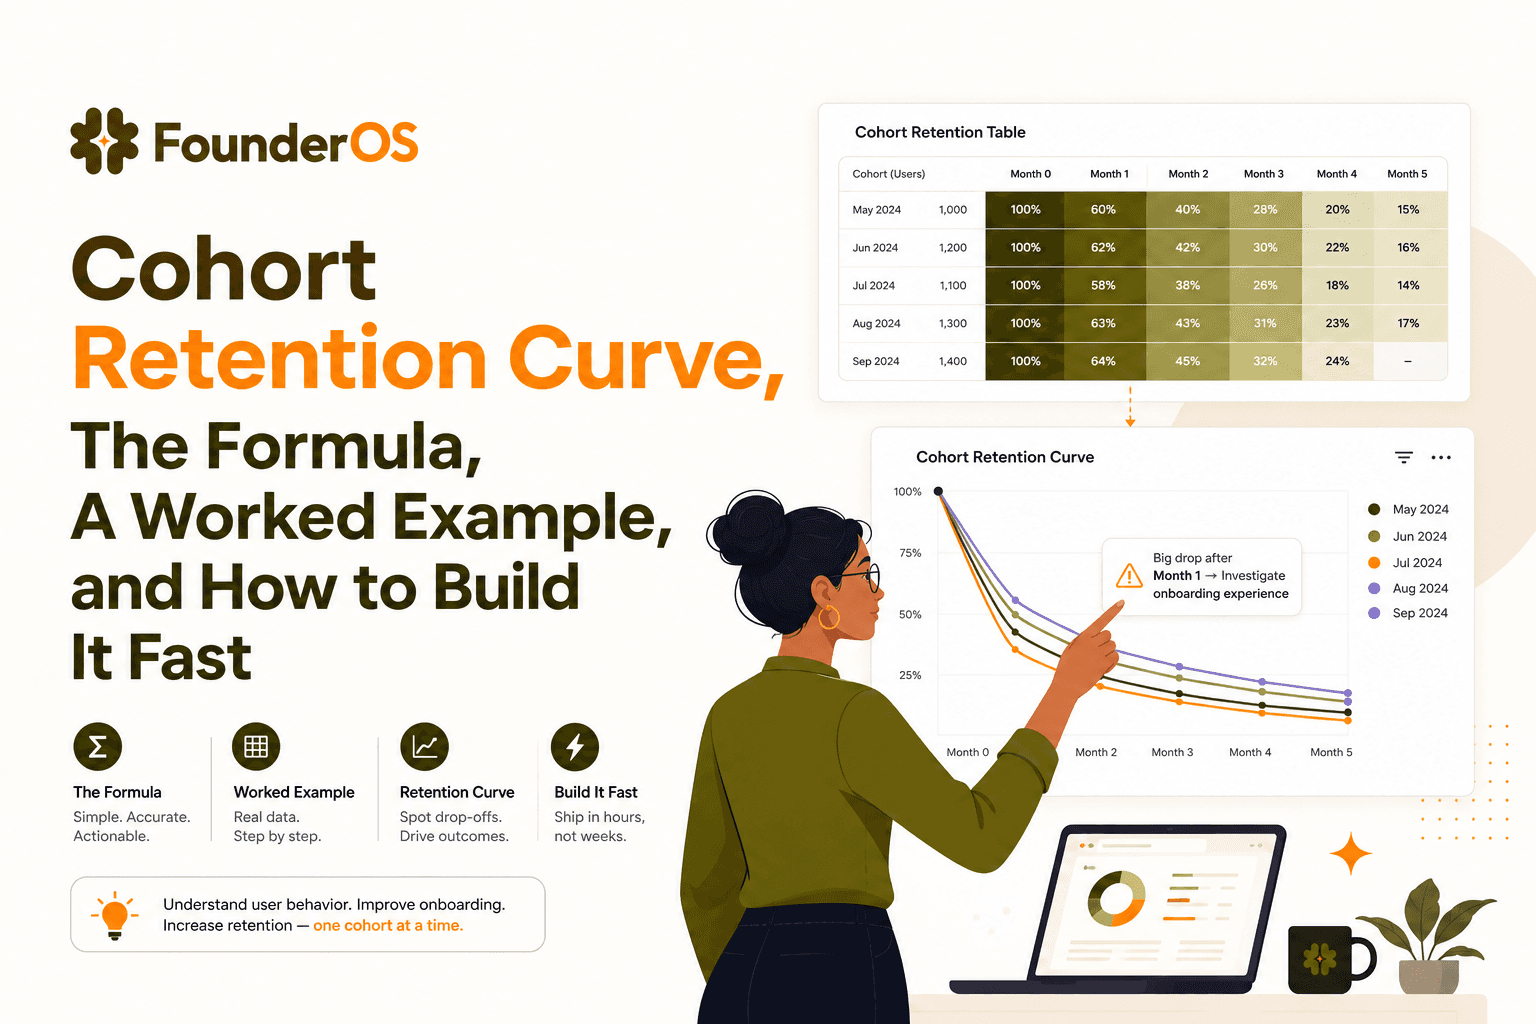
Cohort Retention Curve, The Formula, A Worked Example, and How to Build It Fast
Learn cohort retention curve inputs, formulas (bounded vs unbounded), a worked example from events to curve, plus fast setup steps.

How to Fix Lead Scoring for a Predictable Pipeline
Fix lead scoring with a practical 5-step blueprint: align intent + fit, validate with data, and route leads fast to lift pipeline quality.