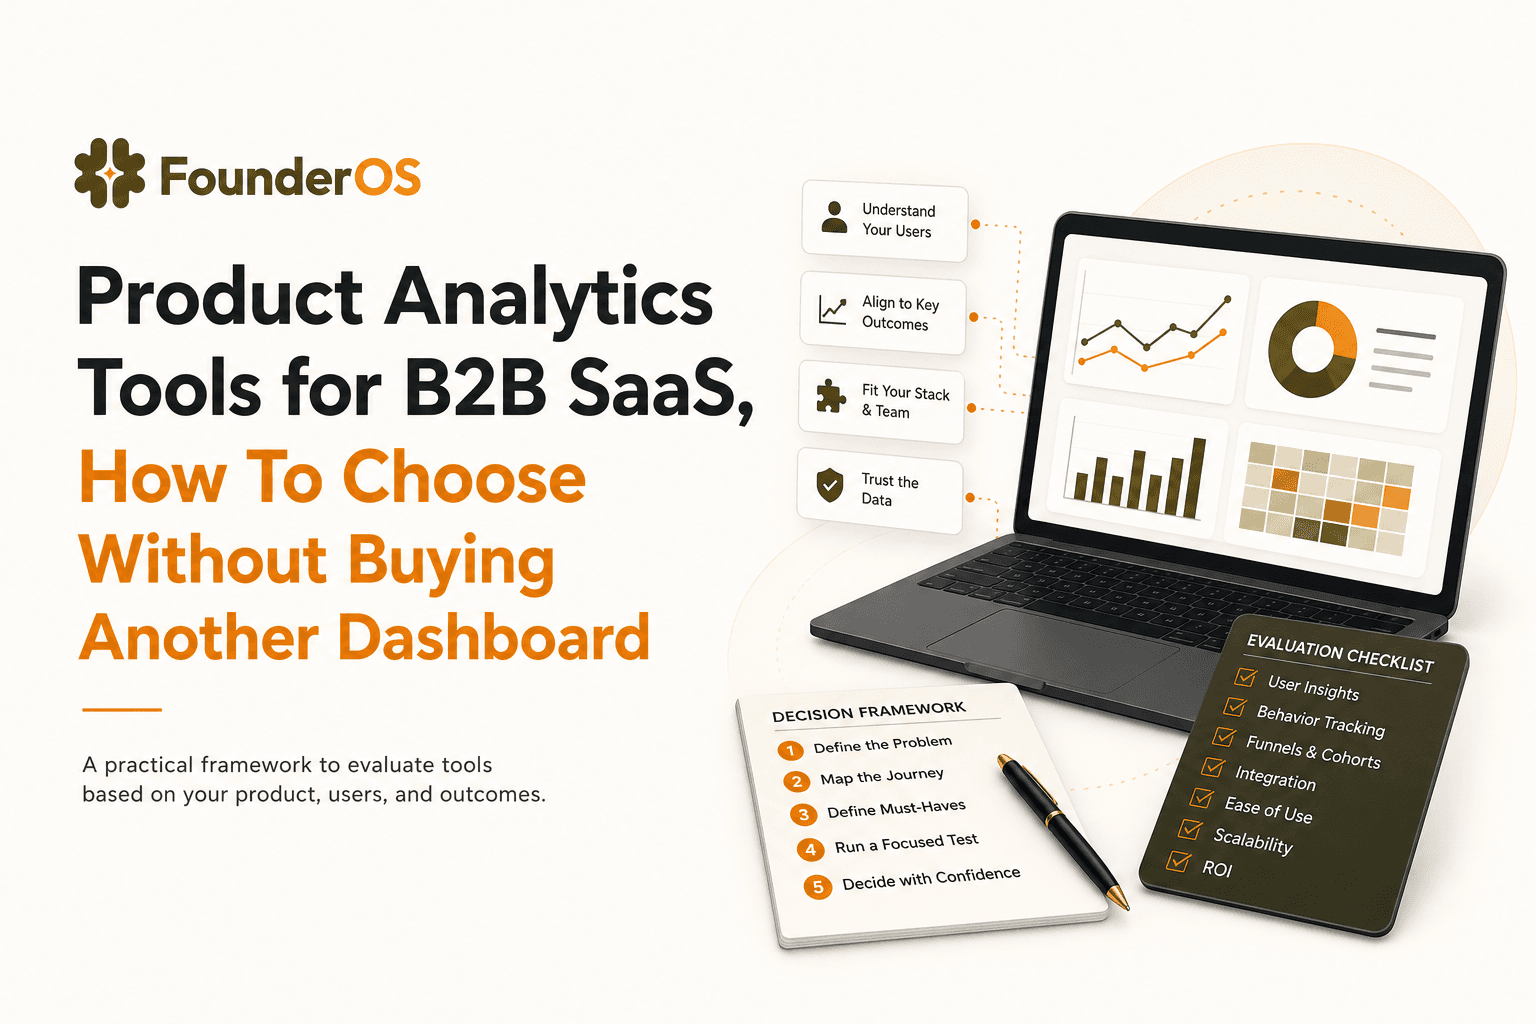
Product Analytics Tools for B2B SaaS, How To Choose Without Buying Another Dashboard
Most teams buy product analytics tools to answer simple questions like “Where does activation drop off?” and “Which features correlate with retention?” and then end up with more dashboards than decisions. The fix is not another feature checklist. It is a shortlist-ready evaluation process that forces clarity on tracking architecture, identity, and how insights turn into changes.
- Evaluate outcomes first: activation fixes, retention drivers, and revenue signals, then map those outcomes to required data model and identity rules.
- Most failures come from tracking architecture: inconsistent event naming, weak identity resolution, and unclear governance create “can’t trust it” analytics.
- Use a weighted scorecard and a short proof-of-value test (7 to 14 days) to choose product analytics tools without committing to a long rebuild.
What to Evaluate in Product Analytics Tools for B2B SaaS
The pain: you want answers, but every question turns into a debate about tracking, definitions, or “which dashboard is right.” The consequence is slow iteration: onboarding changes ship without measurement, sales and product disagree on what “activated” means, and churn surprises you.
Use a 4-step decision framework (outcomes to proof)
- Define 2 to 3 decisions you must improve in the next quarter. Examples: reduce time-to-first-value, increase adoption of one core feature, improve conversion from trial to paid.
- Translate each decision into a measurable artifact. A funnel, a cohort, or a segment you can act on. If you cannot express it as “users who did X then Y within Z days,” the tool will not save you.
- List the minimum data requirements. Events, user properties, account properties, identity rules, and governance needs.
- Run a short proof-of-value test. In 7 to 14 days, the tool should produce one insight you can ship a fix for, plus a repeatable workflow to measure impact.
Checklist: what “good” looks like for B2B SaaS
- Activation clarity: you can define activation as a sequence (not a single event) and compare cohorts by acquisition source, company size, or plan.
- Account-aware analysis: you can analyze at user and account level (because B2B buying and retention happen at account level).
- Identity durability: anonymous to known user stitching works consistently, and user-to-account mapping is explicit.
- Time-to-value: a new PM can build a funnel and find drop-offs without SQL or a data team.
- Trust: event definitions are documented, changes are governed, and dashboards are reproducible.
Data Model and Tracking Architecture That Won’t Break at Scale
Most “analytics disappointment” is a data model problem, not a UI problem. Before you compare product analytics tools, pressure-test how they handle event tracking, user profiles, identity resolution, and governance.
1) Event tracking: define what matters, not everything
Two common pitfalls:
- Event explosion: tracking every click without a plan creates noise and cost, and makes funnels brittle.
- Event ambiguity: “Clicked Button” events with no context cannot explain behavior across screens or roles.
Evaluation criteria:
- Can you capture both auto-captured events (page views, clicks, form submits) and intentional product events (created workspace, invited teammate, connected integration)?
- Can you enforce naming conventions and required properties (for example, feature name, plan, workspace_id)?
- Can you version event definitions so changes do not silently break historical analysis?
2) User profiles and account context: B2B needs both
B2B SaaS analytics breaks when everything is modeled as a “user.” You need a clear relationship between:
- User (person-level behavior and onboarding)
- Account/workspace (seat expansion, multi-user adoption, churn risk)
Evaluation criteria:
- Can you attach events to a person and also roll them up to an account?
- Can you filter funnels by account attributes (industry, ARR band, seats) and user attributes (role, persona)?
- Can you handle multi-seat scenarios where one champion activates and others lag?
3) Identity resolution: the make-or-break capability
In B2B SaaS, one buyer might browse anonymously, sign up with a personal email, then later join via SSO. If identity stitching fails, your funnel will show fake drop-offs and your retention cohorts will be wrong.
Evaluation criteria:
- Anonymous to known stitching: can the tool merge pre-signup activity into the same profile after signup?
- Merge rules transparency: can you see why two identities merged (or did not)?
- Account mapping: can you map user_id to workspace_id reliably, including when users switch workspaces?
For standards and governance, align your tracking plan with widely used practices like a documented event taxonomy and consistent identifiers (see W3C Trace Context for an example of how standards improve interoperability, even if you do not implement it directly).
4) Governance and access control: trust is a feature
If you sell to larger customers, you will eventually get questions about data handling and permissions.
Evaluation criteria:
- Role-based access for dashboards and raw event views
- PII handling controls (masking, deletion requests)
- Auditability: who changed what definition and when
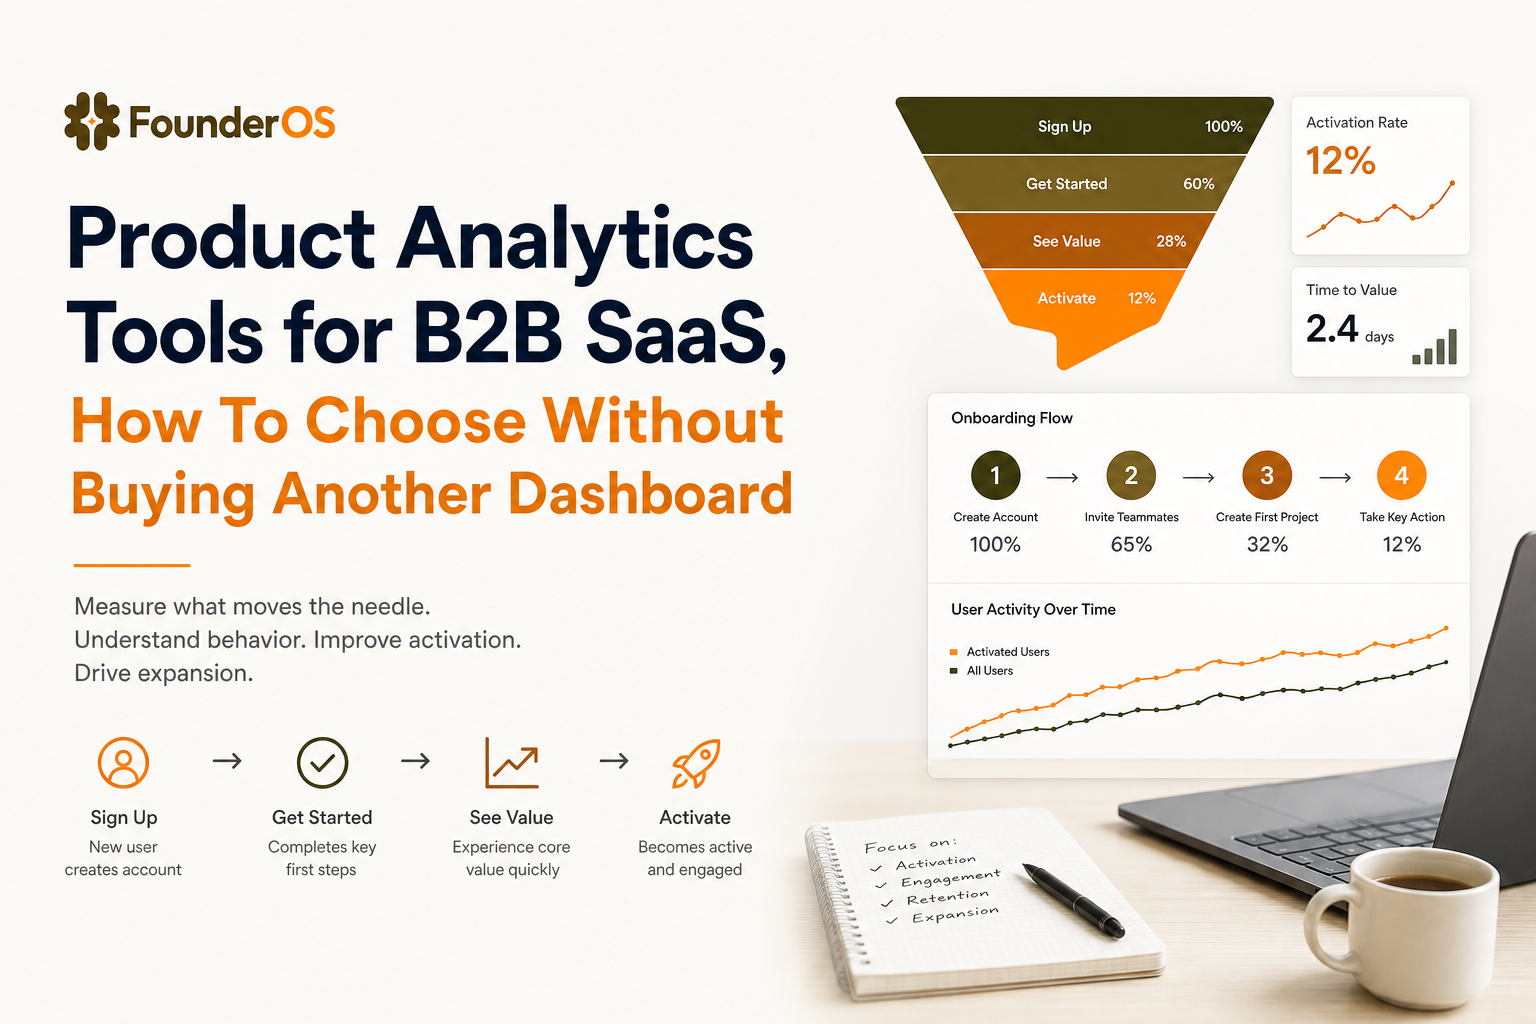
Funnels, Activation, and Onboarding Measurement That Drives Fixes
Teams often say they want funnel analysis, but what they actually need is a workflow that turns drop-offs into a specific fix and a measurable outcome. This is where product analytics tools either pay for themselves or become shelfware.
Define activation as a sequence, then measure time-to-activation
A practical B2B activation definition usually includes 3 to 5 steps. Example:
- Signed up
- Created workspace
- Connected a key integration
- Invited a teammate
- Reached “first value” event (report generated, campaign launched, ticket resolved)
Evaluation criteria:
- Can you build step-by-step funnels from any event to any event without SQL?
- Can you compare funnels by cohort (source, plan, persona) and date range side by side?
- Can you measure time between steps (median time-to-first-value), not only conversion rate?
Go from aggregate drop-off to user-level diagnosis
Dashboards tell you where drop-off happens. Fixes require knowing why. The fastest teams click from a funnel step into the actual users who dropped, then inspect sessions or event sequences.
Evaluation criteria:
- Can you drill into the list of users at each funnel step?
- Can you view recent event sequences to spot patterns (errors, repeated clicks, missing permissions)?
- Can you export a segment of “stuck users” to trigger onboarding help?
Onboarding measurement: connect guidance to outcomes
If you use in-app onboarding, measure it like a product experiment. A useful loop looks like:
- Segment new users by persona or account type.
- Show a targeted guide or checklist.
- Measure lift on the activation sequence and retention cohort.
Tools that integrate analytics with onboarding reduce the “instrumentation gap” where tours ship but nobody can prove they improved activation.
Revenue and GTM Insights From Product Usage
In B2B, product usage is often the earliest signal of expansion or churn. The goal is to connect behavior to pipeline and revenue without turning your analytics into a data warehouse project. This is where event analytics becomes a GTM advantage, not just a PM tool.
Build “product-qualified” signals you can defend
Instead of scoring leads on page views, score on behaviors that imply value and intent. Example signals:
- Activation reached within 7 days
- Multi-user adoption: 3+ active users in the same workspace
- High-intent feature use: connected integration, created automation, configured permissions
- Retention proxy: repeated core action on 3 separate days in week 1
Evaluation criteria:
- Can you create behavioral segments that update automatically in real time?
- Can you combine event sequences, recency, and profile attributes in one segment definition?
- Can you route segments to downstream actions (alerts, onboarding, CRM updates) without manual exports?
Account-level reporting: pipeline impact, not vanity metrics
A practical revenue workflow ties product behavior to account outcomes:
- Define an account health model (for example: active seats, core feature frequency, recent errors).
- Track changes over time (health trend, not a single score).
- Use it in weekly revenue reviews: which accounts are expanding, which are at risk, which need enablement.
When evaluating product analytics tools, ask for a demo of account-level cohorting and how easily you can answer: “Which behaviors in week 1 correlate with paid conversion by day 30?”
Product Analytics Tools Comparison Template and When Founder OS Is the Best Fit
To avoid subjective debates, use a weighted scorecard. This also makes stakeholder alignment easier because you can agree on weights before you see any vendor demo.
Weighted scorecard (copy/paste template)
- Tracking + data model fit (30%): event taxonomy, user and account modeling, required properties
- Identity resolution (20%): anonymous to known stitching, merge rules, workspace mapping
- Actionable analysis (20%): funnels, cohorts, drill-down to users, time-to-activation
- GTM and revenue workflows (15%): behavioral segments, lead scoring inputs, reporting
- Time-to-value (10%): install effort, first dashboard time, PM self-serve
- Governance (5%): permissions, auditability, privacy controls
Shortlist proof-of-value test (7 to 14 days)
Run the same test on each option:
- Instrument the activation sequence and one high-intent feature.
- Build one funnel and one retention cohort.
- Create a segment of users who dropped at the biggest step.
- Ship one onboarding or UX fix and measure lift.
If a tool cannot produce a trustworthy funnel and a usable segment quickly, it will not get better at scale.
When Founder OS is a strong fit (and the tradeoffs)
Founder OS tends to fit best when you want product analytics tools that get you from install to first insight quickly, and you care about activation and onboarding loops more than building a custom data stack. In practice, teams use it to:
- Install once and start capturing behavior immediately, then refine into intentional events as you learn.
- Build user profiles and segments based on behavior, then use those segments to drive onboarding interventions.
- Diagnose activation drop-offs with visual funnels and drill into the exact users who stalled.
Tradeoff to consider: if your organization requires a heavily customized warehouse-first architecture for every metric, you may prefer a more data-engineering-led setup. For many lean B2B SaaS teams, the speed and clarity of an integrated workflow is the point.
If you are also comparing categories, see product analytics platforms and how they differ in setup and day-to-day usage, or review what matters in mixpanel product analytics evaluations.
| Evaluation area | Questions to ask in the demo | Evidence you should request |
|---|---|---|
| Tracking and taxonomy | How do we enforce naming and required properties? What breaks if we change an event? | Sample tracking plan, event definition workflow, versioning or audit trail |
| Identity and accounts | How do you stitch anonymous to known users? How do you model workspace/account? | Walkthrough of a stitched user journey and account rollups |
| Activation funnel | Can we build a 5-step activation funnel and compare cohorts quickly? | Live build in the UI plus time-to-step metrics |
| Diagnosis workflow | Can we click into the users who dropped and see what happened? | User-level drill-down, session or event sequence view, exportable segment |
| GTM signals | Can we define behavioral segments like “PQL” and keep them updated automatically? | Real-time segment refresh demo and downstream action options |
FAQ
How many events should we track when evaluating product analytics tools?
Start with 15 to 30 intentional events that map to your activation sequence, core feature usage, and key failure states (errors, permission blocks). Add auto-captured events only if they help diagnose drop-offs. More events do not mean better answers.
What is the fastest way to test whether identity resolution is reliable?
Pick 20 real journeys that include anonymous browsing, signup, and workspace creation. Verify the tool shows one continuous profile, correct first-touch source, and correct workspace mapping. If you see duplicate users or missing pre-signup events, your funnels will be misleading.
How do we connect product usage to revenue without a big data project?
Define 2 to 3 defensible product-qualified signals (activation reached, multi-user adoption, high-intent feature) and track them at the account level. Then report how those signals correlate with trial-to-paid conversion and expansion. This creates a bridge between product and revenue reviews without building a full warehouse model first.
Which teams benefit most from integrated onboarding plus analytics?
Teams actively iterating on activation and feature adoption benefit most because they can segment users by behavior, trigger targeted guidance, and measure lift in the same workflow. It reduces the lag between shipping onboarding changes and knowing whether they worked.
If you want to evaluate product analytics tools with a fast proof-of-value test focused on activation, segmentation, and revenue signals, Founder OS is designed for that workflow. Install it once, build your activation funnel, and use real-time behavioral segments to ship one measurable onboarding or UX fix within two weeks.
