Event Analytics for B2B SaaS That Actually Drives Revenue, Not More Dashboards
Event analytics only drives revenue when it is tied to lifecycle decisions: what activation step matters, who is stuck, and which behaviors predict expansion. If your team is tracking hundreds of events but still arguing about “what to do next,” the issue is not data volume, it is the lack of an operational system that turns raw events into weekly product and GTM actions.
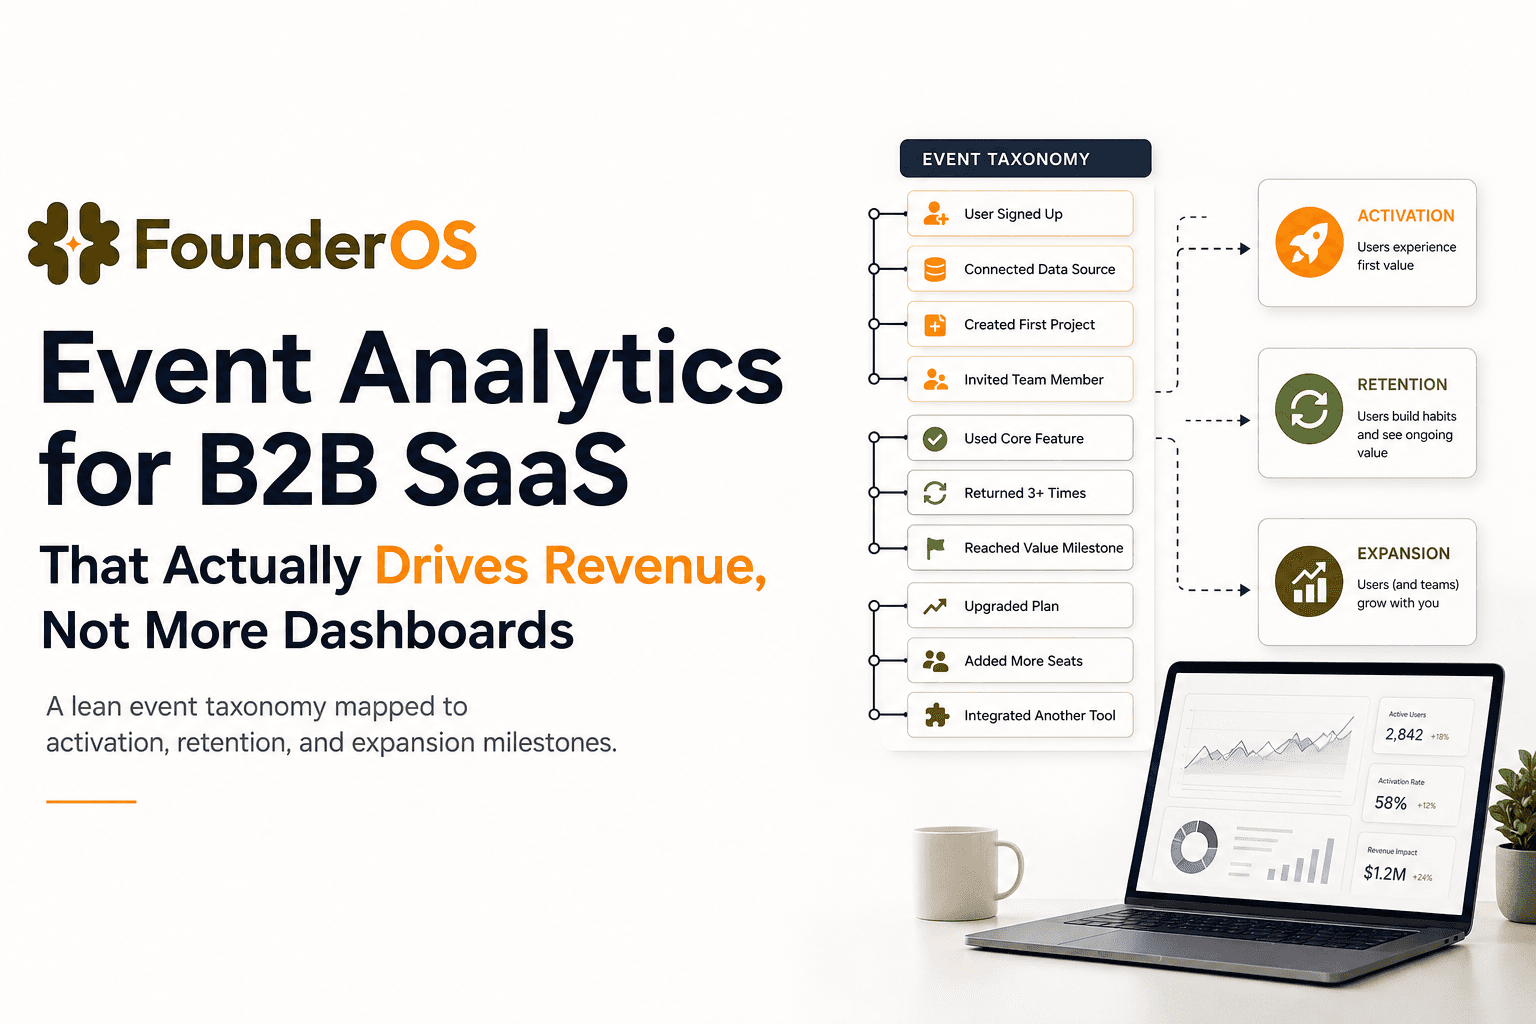
- Stop “tracking everything” and adopt a lean taxonomy: 10 to 25 core events, 3 to 8 key properties, and one owner per event.
- Map events to lifecycle milestones (activation, retention, expansion) so every chart answers a decision, not curiosity.
- Run a weekly cadence: funnel review, segment cut, experiment queue, and a one-page stakeholder report.

The Agitation Why event analytics is costing you money, time, and high-value leads
The most expensive event analytics failure mode is not missing tracking. It is collecting a mountain of events that cannot be trusted, cannot be compared, and cannot be acted on. In B2B SaaS, that cost shows up as wasted acquisition spend, misrouted sales effort, and slow activation that drags down conversion and expansion.
Failure mode 1 Noisy events create false confidence
- Symptom: Dozens of similarly named events (e.g., Clicked CTA, CTA Click, Button Click) and inconsistent properties (plan, workspace_id, role) across teams.
- Cost of inaction: You ship onboarding changes based on charts that are not comparable week to week, then “learn” the wrong lesson. That compounds into more UI changes, more experiments, and more time spent debating instrumentation rather than improving activation.
- Concrete impact: If your paid channel CAC is $800 and your activation rate is 20%, improving activation to 25% reduces effective CAC per activated account from $4,000 to $3,200, a 20% improvement. Noisy tracking blocks that upside.
Failure mode 2 Unclear ownership turns tracking into a backlog graveyard
- Symptom: Product assumes engineering owns events. Engineering assumes product owns definitions. Marketing wants attribution fields. Sales wants “high intent” signals. Nobody owns the schema.
- Cost of inaction: Events drift. Properties get renamed. Dashboards quietly break. Teams stop trusting the data and revert to anecdotes, call notes, and gut feel.
- Concrete impact: When trust drops, teams add more dashboards to “triangulate,” increasing clutter and reducing decision speed.
Failure mode 3 Dashboards are not decisions
Most dashboards answer, “What happened?” not “What should we do next?” In B2B SaaS, you need event analytics that connects behavior to outcomes: activation, retention, and revenue moments.
- Symptom: A dashboard shows daily active users and feature clicks, but nobody can say which sequence predicts retention or expansion.
- Cost of inaction: Sales chases the wrong accounts, support handles repeatable onboarding issues manually, and product ships features that do not move retention.
Quick diagnostic checklist Is your current setup revenue-relevant?
- Can you define your activation event in one sentence and measure it by segment?
- Can you name the top 3 drop-off steps between signup and activation?
- Can you produce a weekly list of accounts with “high intent” behavior based on product usage, not page views?
- Can you tie at least one product behavior to expansion within 30 to 90 days?
The Strategic Blueprint to overcome event analytics failure without dashboard clutter
This blueprint is designed for B2B SaaS teams that want a lean, decision-driven system. It avoids “instrument everything” and instead creates a small set of verified signals tied to lifecycle milestones.
Step 1 Define a lean event taxonomy that is hard to misinterpret
Start with a strict taxonomy that reduces ambiguity. Your goal is not completeness, it is comparability.
Lean taxonomy rules
- 10 to 25 core events total for the first iteration. If you have 200, you do not have more insight, you have more noise.
- Verb + object naming (e.g., Workspace Created, Invite Sent, Integration Connected, Report Exported).
- One event, one meaning: do not overload an event to represent multiple actions.
- 3 to 8 standard properties used across most events (examples below).
- One owner per event who approves changes and keeps definitions stable.
Recommended standard properties for B2B SaaS
- account_id (or workspace_id), user_id
- plan_tier, billing_status
- role (admin, member), persona (if you use it)
- source (utm_source or channel bucket)
- integration_type (if relevant)
Step 2 Map events to lifecycle milestones and define success metrics
Event analytics becomes actionable when each event supports a milestone. Use a simple mapping: Activation, Retention, Expansion. Each milestone needs a primary metric and supporting leading indicators.
Lifecycle mapping template
- Activation milestone: the first time a new account reaches “aha.”
- Retention milestone: the behavior that indicates ongoing value (weekly or monthly).
- Expansion milestone: behaviors that precede seat growth, add-ons, or higher-tier upgrades.
Example mapping for a typical B2B workflow product
- Activation: Workspace Created + First Key Object Created + First Collaborator Invited
- Retention: Key Object Updated in Week 2 and Week 4
- Expansion: Second Team Invited, Advanced Feature Used, Integration Connected
Step 3 Build one primary funnel and two supporting cuts
Most teams build too many funnels. Start with one “North Star funnel” that represents your onboarding path, then add two cuts that make it diagnostic.
- Primary funnel: Signup Completed → Workspace Created → Key Setup Done → Aha Action → Invite Sent
- Cut 1: segment by acquisition source or ICP tier
- Cut 2: segment by role (admin vs member) or use-case path
If you want a deeper diagnostic method for conversion drop-offs, reference this guide on funnel analysis and adapt the steps to your activation funnel.
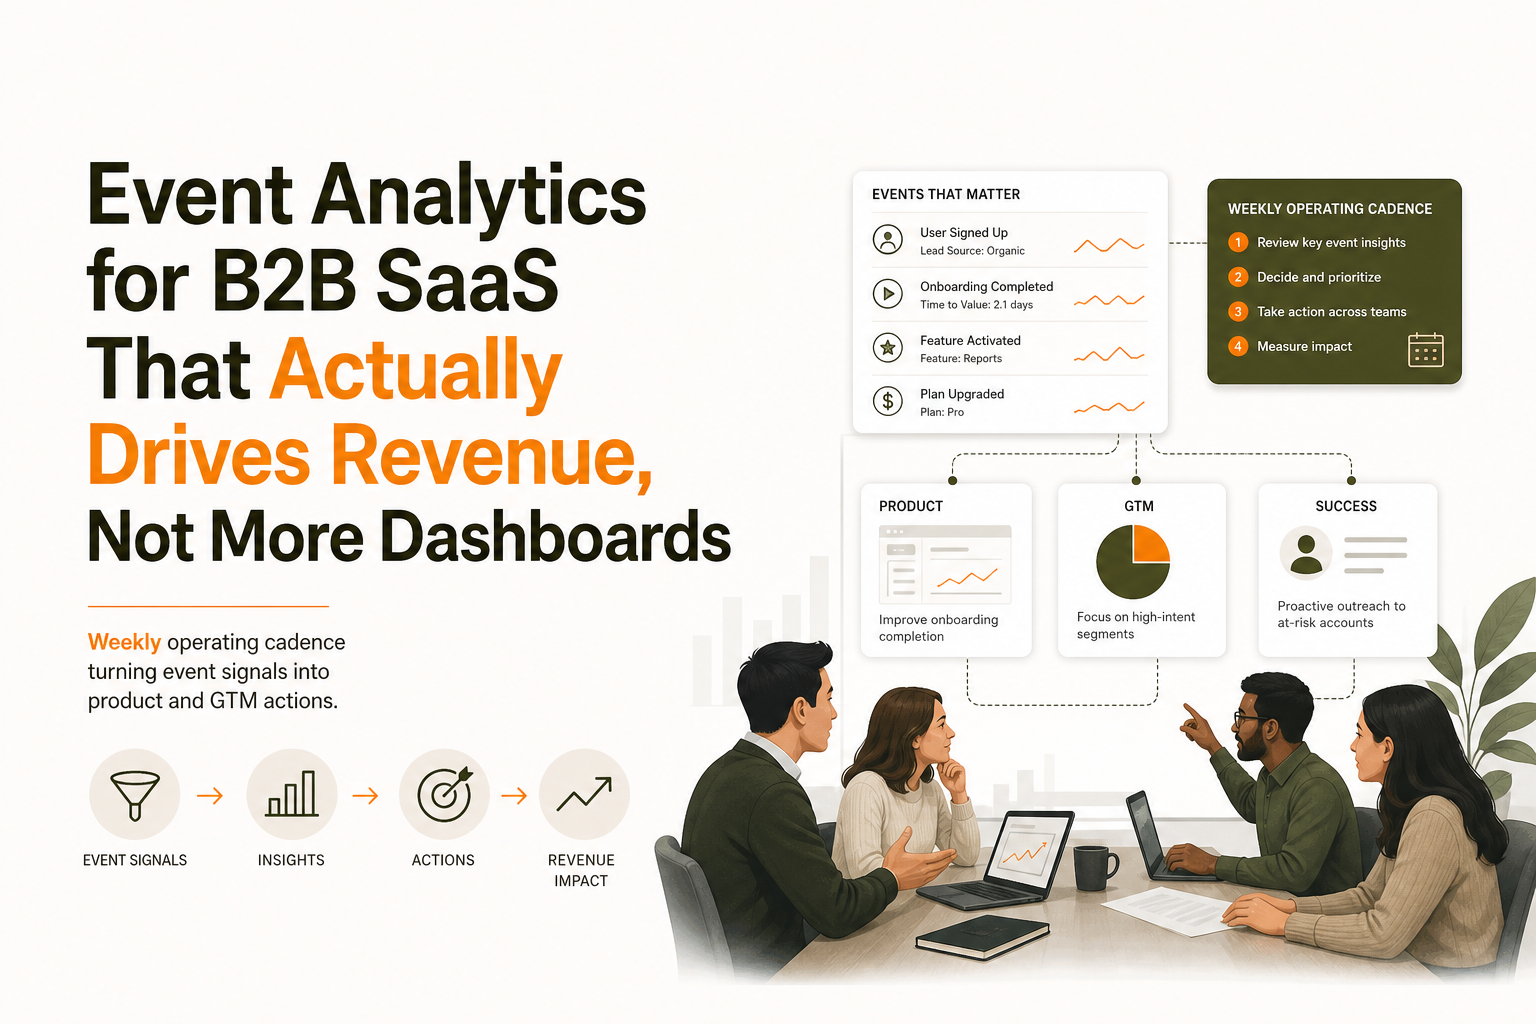
Step 4 Operationalize decisions with a weekly cadence
A weekly cadence is where event analytics turns into revenue impact. The cadence should produce four outputs every week:
- One funnel diagnosis: the biggest drop-off step and the top hypothesis for why.
- One segment update: who is high intent, who is stuck, who is disengaging.
- One experiment queue: 1 to 3 changes to test, tied to a metric and segment.
- One stakeholder summary: a one-page report that answers what changed, why, and what you will do next.
Step 5 Tie behavior to revenue outcomes with a simple scoring model
You do not need a complex machine learning model to start. Use a transparent behavioral score that sales and success can trust.
- Pick 5 to 7 intent events (e.g., Integration Connected, Invite Sent, Advanced Report Viewed).
- Assign weights based on proximity to revenue. Example: Integration Connected = +5, Invite Sent = +3, Export Report = +2.
- Set thresholds for actions: score ≥ 8 triggers sales outreach, score 4 to 7 triggers in-app guidance, score ≤ 3 stays in nurture.
For a detailed behavioral approach, see how to identify high intent users in saas.
Solving event analytics in under 10 minutes with Founder OS
The blueprint above fails when setup takes weeks, schemas drift, or only analysts can answer questions. Founder OS acts as the efficiency engine: it captures user actions immediately, ties events to user profiles, and lets you build funnels and segments without waiting on SQL or engineering sprints. The measurable output is speed and trust: faster time-to-first-insight, fewer broken definitions, and a weekly cadence that stays consistent.
Fast instrumentation that reduces event noise from day one
Instead of spending a sprint manually tagging every click, you can start with automatic capture of common behaviors and then add only the few custom events that represent lifecycle milestones. The output you want after the first session is a verified list of core events you will keep, and a list of noisy events you will ignore.
- Measurable output: a first-pass event inventory in the same day, with a shortlist of 10 to 25 events that map to activation and retention.
- Operational impact: fewer “duplicate meaning” events, fewer dashboard rewrites, faster onboarding experiments.
User-level context that turns drop-offs into fixable stories
Funnels tell you where drop-offs happen. User-level context tells you why. When you can click from an aggregate drop-off into specific user sessions and profiles, you can separate “confusing UI” from “wrong audience” and “missing integration.” This is where event analytics becomes an execution tool, not a reporting layer.
- Measurable output: a weekly list of 10 to 20 representative sessions for the top drop-off step, tagged by root cause.
- Operational impact: faster iteration on onboarding, fewer debates in product reviews, clearer bug vs UX vs positioning calls.
Real-time segmentation that feeds onboarding and re-engagement
Segments should update as users act. When segments are dynamic, you can route users into onboarding tours, success outreach, or re-engagement before churn risk becomes visible in revenue reports. If you are building a segmentation practice, this framework on user segmentation helps keep it decision-driven.
- Measurable output: a live “stuck before activation” segment and a “disengaging accounts” segment that refreshes automatically.
- Operational impact: improved activation follow-up, earlier churn prevention, better prioritization for success teams.
Expert Insight Box: Treat activation as an account-level milestone, not a user-level one
Many B2B teams define activation as a single user doing one action. That inflates activation and hides the real blocker: multi-user adoption. A more predictive approach is to define activation at the account level with a minimum collaboration threshold, for example “at least 2 users complete the aha action within 7 days.” This usually lowers your headline activation rate, but it increases the correlation with retention and expansion, which is what makes event analytics ROI-positive.
Operationalize it weekly workflows that turn events into product and GTM actions
Here is a concrete weekly operating system you can run with a small team. The goal is to make event analytics a routine that produces decisions, not a quarterly reporting exercise.
Workflow 1 Monday funnel review with a single decision
- Input: onboarding funnel for the last 14 days, segmented by ICP tier and source.
- Process: identify the highest-volume drop-off step; review 10 sessions or user profiles from that step.
- Output: one prioritized fix with an owner (copy change, UI change, onboarding tour, or sales assist).
Workflow 2 Wednesday segment cut for sales and success
- Input: intent score and key milestone events in the last 7 days.
- Process: generate three lists: high intent, stuck pre-activation, disengaging.
- Output: actions per list (sales outreach, in-app guidance, success check-in).
Workflow 3 Friday experiment scoreboard and stakeholder report
- Input: experiments shipped in the last 2 to 4 weeks and their impact on activation and retention leading indicators.
- Process: report only what changed, what you learned, and what you will do next. Avoid vanity charts.
- Output: a one-page summary shared with product, growth, and leadership.
| Artifact | What it answers | Owner | Frequency | Pass criteria |
|---|---|---|---|---|
| Lean event taxonomy doc | What events matter and what they mean | Product | Monthly review | 10 to 25 core events, stable names, clear definitions |
| Activation funnel | Where new accounts lose momentum | Growth or PM | Weekly | One primary funnel, segmented by ICP and source |
| Behavioral segments | Who needs what action now | Growth + Success | Weekly | 3 segments: high intent, stuck, disengaging |
| Experiment queue | What you will test next and why | Product | Weekly | Each test tied to a funnel step and success metric |
| One-page stakeholder report | What changed, what you learned, what’s next | PM or Founder | Weekly | No more than 5 charts, includes decisions and owners |
FAQ about event analytics for B2B SaaS
How many events should we track to start?
Start with 10 to 25 core events that map directly to activation, retention, and expansion milestones. Add events only when they support a decision you plan to make weekly. This keeps event analytics comparable over time and prevents dashboard clutter.
What is the difference between tracking and using event analytics?
Tracking is collecting events. Using event analytics means linking events to lifecycle milestones, reviewing a primary funnel weekly, cutting actionable segments, and shipping experiments tied to specific drop-off steps. The output is decisions and owners, not charts.
How do we define activation for a B2B SaaS product?
Define activation as the first time an account reaches the “aha” moment that predicts retention. In many B2B products, a stronger definition is account-level and collaboration-based, for example two users completing the core action within 7 days. For more guidance, see user activation.
What should we show leadership each week?
Show one funnel change, one segment update, and one experiment result tied to revenue-relevant milestones. Keep it to a one-page report with decisions and owners. If you need to evaluate tooling choices, compare approaches in product analytics platforms.
If you want to implement this event analytics cadence without weeks of instrumentation work, Founder OS helps you capture behavior quickly, tie events to user profiles, and run funnels and segments that stay operational week after week. Start lean, map events to milestones, and use Founder OS to keep the system fast enough that your team actually uses it.
