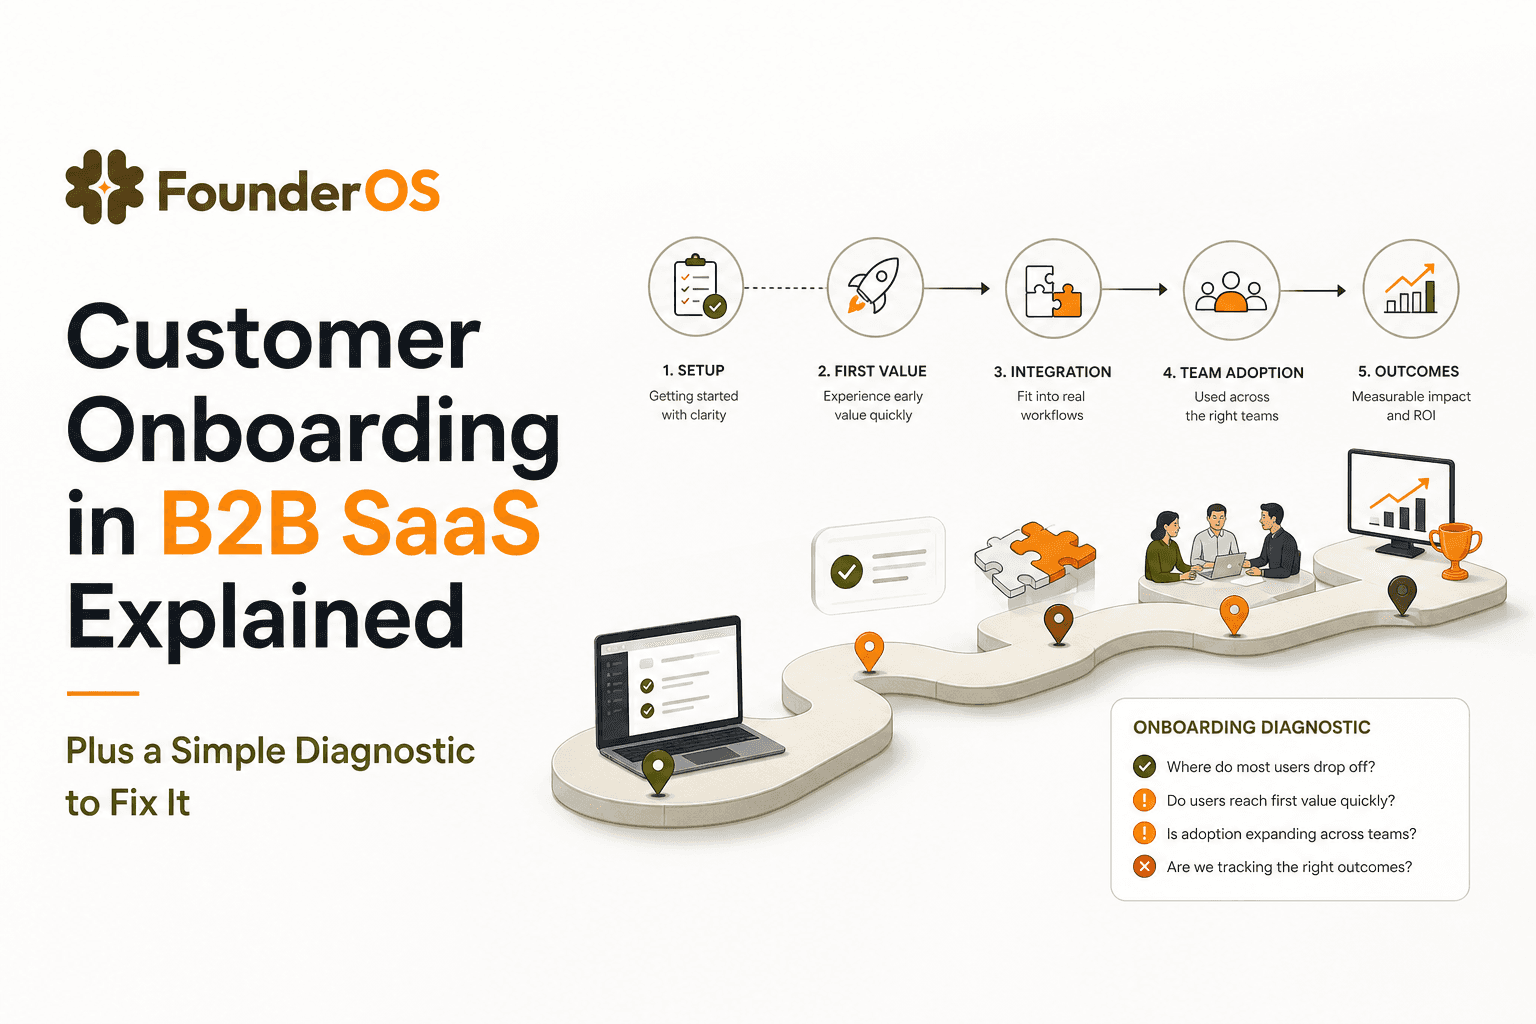
Customer Onboarding in B2B SaaS Explained Plus a Simple Diagnostic to Fix It
Customer onboarding in B2B SaaS is not a single product tour or a one-time kickoff call. It is a cross-functional system that aligns Sales, Product, and Customer Success around one outcome: getting a new account to a repeatable success moment with minimal time and confusion.
- Define onboarding by outcomes (time-to-first-value and adoption), not by “setup completed” or “tour finished.”
- Use a simple diagnostic to choose the right onboarding motion: self-serve, sales-led, or hybrid, based on complexity, risk, and buyer type.
- Fix breakdowns by closing handoff gaps, making success criteria measurable, and personalizing in-app guidance without replacing human onboarding.
What customer onboarding really means in B2B SaaS and what it is not
Most teams say “onboarding” when they mean “account setup.” In practice, customer onboarding should cover the first period where a new account moves from intent to habit. That includes setup, yes, but also activation, early adoption, and the first proof that the product works in the customer’s environment.
Define onboarding as outcomes, not activities
Activities are easy to ship: a welcome email, a checklist, a walkthrough, a kickoff call. Outcomes are harder but measurable. A practical way to define onboarding outcomes is to track three milestones:
- Time-to-first-value (TTV): time from signup or contract to the first meaningful result. If you need a framework for defining value, see time to value.
- Activation event: the first repeatable action that predicts retention in your product (for example, “invite 3 teammates,” “connect data source,” “publish first report”).
- Adoption depth: evidence the account is using the core workflow, not just clicking around (for example, weekly active usage of a key feature by 2+ roles).
This is where customer onboarding breaks for many B2B SaaS companies: they optimize for “completion rate” of a tour instead of “activation rate” of the account.
What onboarding is not
- Not a product tour alone: Tours are a tool. If the product is misconfigured or the success criteria are unclear, a tour only accelerates confusion.
- Not only Customer Success: CS can guide, but Product must remove friction and Sales must set correct expectations.
- Not a one-size-fits-all sequence: If you sell to multiple segments, “everyone sees the same steps” is usually a hidden cause of churn.
A simple way to map the onboarding system across teams
Use this three-lane map to make customer onboarding a shared system, not a department:
- Sales lane (promise): what was sold, to whom, with what constraints. Output: a clear “success definition” and implementation risks.
- CS lane (plan): the onboarding plan, owners, timeline, and checkpoints. Output: a mutual action plan tied to measurable milestones.
- Product lane (path): in-app guidance, defaults, templates, and guardrails that make the plan easy. Output: fewer steps to value and fewer support tickets.
When these lanes disagree, customer onboarding becomes a handoff game. The customer experiences it as delays, rework, and “we thought it did X.”
A simple customer onboarding diagnostic to choose the right motion
The fastest way to improve customer onboarding is to stop forcing one motion on every account. Instead, choose the motion that matches your product’s complexity and the customer’s risk profile. Below is a diagnostic you can run in 15 minutes with Sales, CS, and Product in the same room.
Step 1: Score three factors from 1 to 5
For your typical new customer, score each factor:
- Implementation complexity (1 simple, 5 complex): integrations, data migration, permissions, multi-step setup.
- Business risk (1 low, 5 high): regulated workflows, revenue impact, security review, change management.
- Buyer-user distance (1 same person, 5 very different): the person who bought is not the day-to-day user, or there are multiple roles.
Step 2: Use the score to pick the motion
- Self-serve onboarding: mostly 1 to 2 scores. The product can guide users to value without heavy human touch.
- Sales-led onboarding: mostly 4 to 5 scores. You need structured implementation, stakeholder alignment, and proactive risk management.
- Hybrid onboarding: mixed scores. Human onboarding handles the “hard parts,” while in-app flows handle repetition and reduce back-and-forth.
Step 3: Define the “first value” milestone per motion
Customer onboarding fails when teams cannot agree on what “done” means. Pick one milestone that is observable in product data:
- Self-serve example: “User completes integration A and runs report B once.”
- Sales-led example: “Admin configures roles, imports baseline data, and 3 end-users complete the core workflow.”
- Hybrid example: “CS configures SSO and permissions, users complete an in-app flow that ends with publishing their first artifact.”
Step 4: Decide what should be automated in-product vs handled by people
A useful rule: automate the steps that are (a) frequent, (b) consistent, and (c) easy to verify. Keep humans for steps that require context, negotiation, or stakeholder alignment.
In-app flows and interactive guidance are ideal for repeated UI actions and “now click here” steps, while CS should focus on outcome planning, change management, and removing blockers.
How to fix the 5 most common customer onboarding breakdowns
Below are five failure modes that show up across B2B SaaS. Each includes a first fix you can ship quickly, plus a way to measure whether it worked.
Breakdown 1: Sales-to-CS handoff gaps create rework
What it looks like: CS starts onboarding without knowing the real use case, timeline, stakeholders, or promised outcomes. Customers repeat themselves, and “implementation” becomes discovery.
First fix: standardize a one-page handoff that Sales must complete before scheduling kickoff. Include:
- Primary use case and success definition in one sentence
- Stakeholders and roles (admin, champion, end-users)
- Constraints: security, integrations, data sources, deadlines
- Activation event you will measure in-product
How to measure: reduce “time from contract to kickoff” and “number of discovery calls during onboarding.” Also track whether the activation event happens within the target window.
Breakdown 2: Success criteria are vague, so onboarding never ends
What it looks like: customers “set up” the product but do not build a habit. CS reports onboarding completion, but usage is shallow. Product sees low retention in week 2 to week 4 cohorts.
First fix: define a 3-metric onboarding scorecard per segment:
- TTV target (example: first value within 7 days)
- Activation event (example: invite teammates + complete core action)
- Adoption depth (example: 2 roles active weekly, or 3 key actions repeated)
Make the scorecard visible to Sales, CS, and Product in the same dashboard or weekly report.
How to measure: activation rate by cohort and median time-to-first-value. For benchmarks, you can anchor your thinking on widely cited retention and onboarding research such as Reforge’s retention concepts and cohort analysis resources, but always validate against your own product data.
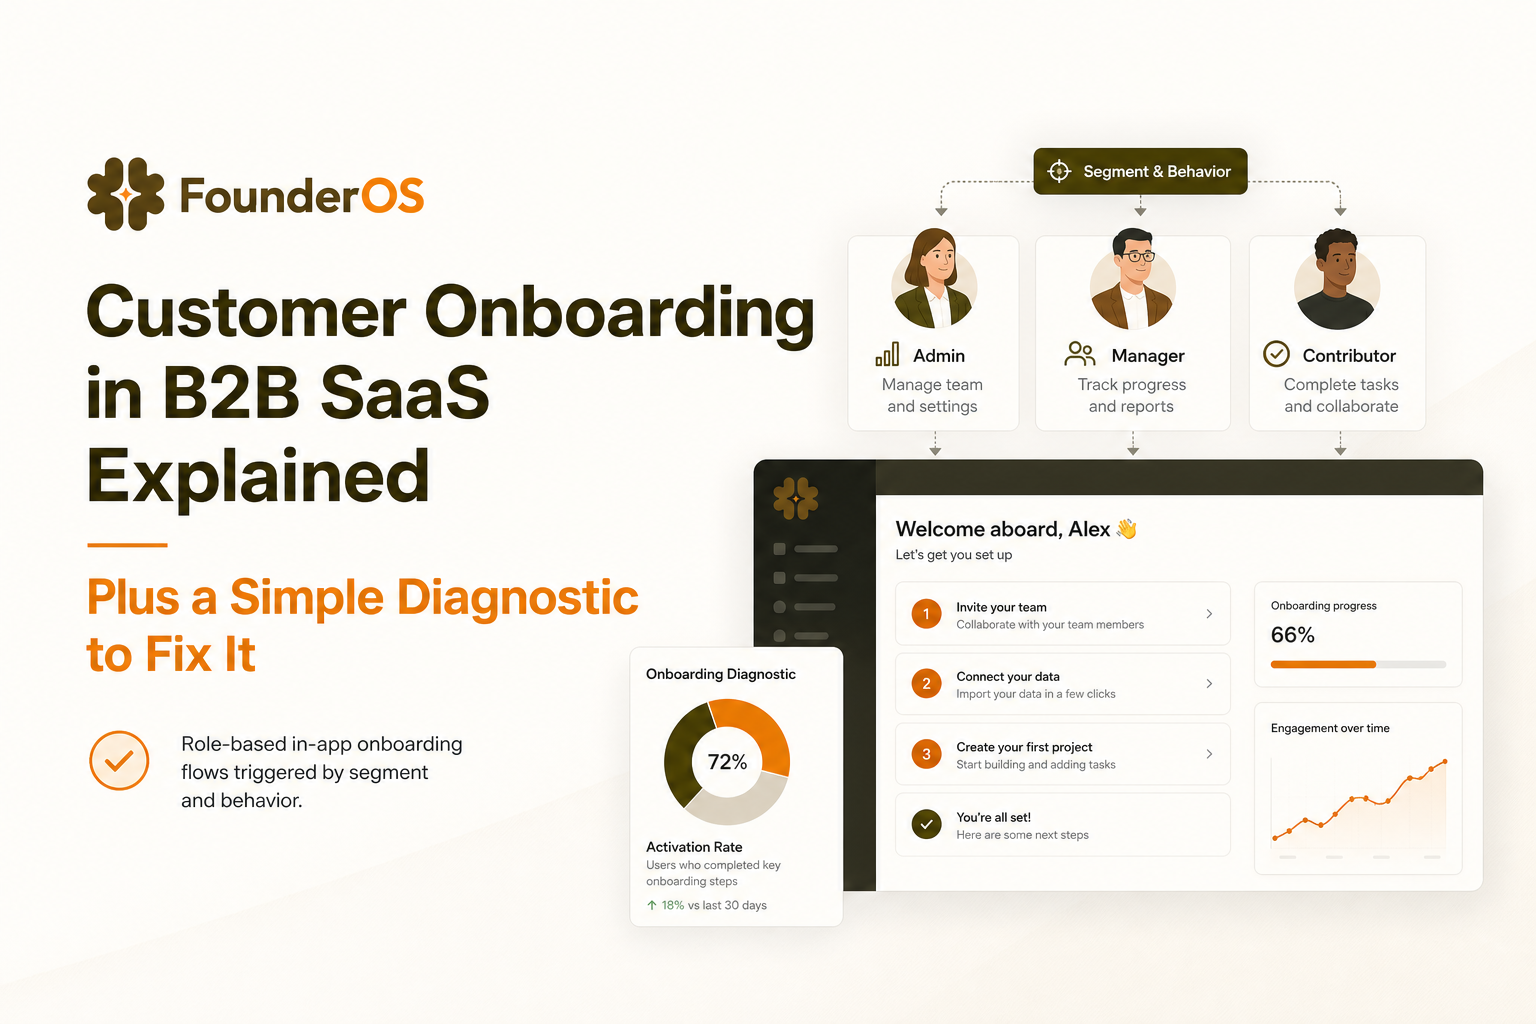
Breakdown 3: One-size-fits-all tours overwhelm users
What it looks like: new users get the same walkthrough regardless of role, plan, or intent. Admins see end-user steps. Power users get slowed down. Completion rates might look fine, but adoption does not improve.
First fix: replace a single long tour with role-based, triggered flows:
- Trigger by role (admin vs contributor), plan tier, or first action
- Keep each flow to 3 to 7 steps and end with a real outcome
- Add “skip” and “remind me later” to reduce resentment clicks
If you need a concrete build pattern, this guided product tour blueprint shows how to connect steps to measurable activation.
How to measure: step drop-off rate, completion rate by segment, and lift in the activation event for users who saw the flow vs those who did not.
Breakdown 4: Setup friction blocks value
What it looks like: users cannot reach value because setup requires too many decisions, too much data, or too many permissions. They stall, then churn silently.
First fix: do a “first value path” teardown with a stopwatch. Count:
- Number of required fields before the user can do anything meaningful
- Number of screens between signup and the activation event
- Number of times you ask for information you do not immediately use
Then pick one reduction to ship this sprint: prefill defaults, provide a template, delay non-critical fields, or add an in-app nudge exactly when the user hits the blocker.
How to measure: median time-to-first-value and the percent of users who reach the activation event within your target window.
Breakdown 5: No feedback loop, so onboarding never improves
What it looks like: the team ships onboarding content, but does not know where users drop off, which segments struggle, or which steps correlate with retention. Changes are based on opinions, not evidence.
First fix: implement a monthly onboarding review with one table and one decision rule:
- Table: top 5 onboarding steps by drop-off and top 5 blockers from support tickets
- Decision rule: every month, fix one high-drop-off step or one high-volume blocker, then re-measure the activation lift
Pair quantitative data (step completion, drop-off) with qualitative signals (short in-app surveys after key moments). Keep surveys short: one question, optional comment.
How to measure: activation lift after changes, reduction in onboarding-related ticket volume, and improved week 4 retention for new cohorts.
| Breakdown | Fastest first fix | Metric to watch | Who owns it |
|---|---|---|---|
| Sales-to-CS handoff gaps | One-page handoff with success definition and constraints | Contract-to-kickoff time, activation within target window | Sales + CS |
| Vague success criteria | 3-metric onboarding scorecard per segment | Activation rate, median TTV | CS + Product |
| One-size-fits-all tours | Role-based triggered flows (3 to 7 steps) | Step drop-off, activation lift by segment | Product |
| Setup friction | Stopwatch teardown, remove one high-friction step | TTV, activation within 7 or 14 days | Product + Engineering |
| No feedback loop | Monthly onboarding review with one fix shipped | Activation lift, onboarding ticket volume | CS + Product |
FAQ about customer onboarding in B2B SaaS
How long should customer onboarding take in B2B SaaS?
It depends on implementation complexity and risk. Instead of picking a number, set a target time-to-first-value and an activation event window (for example, first value within 7 to 14 days for self-serve, or 30 to 60 days for sales-led implementations). Then measure median and 75th percentile so you can see long-tail delays.
What is the difference between onboarding completion and activation?
Onboarding completion is finishing a sequence (a checklist, a tour, or a kickoff plan). Activation is the customer performing a behavior that predicts retention, like inviting teammates, integrating a data source, or completing the core workflow. Strong customer onboarding optimizes for activation, not just completion.
Do interactive product tours replace Customer Success?
No. Interactive tours reduce repetitive guidance and help users self-serve common steps, but they do not replace context setting, stakeholder alignment, or change management. The best approach is hybrid: CS owns outcomes and planning, while in-app flows handle repeatable UI guidance.
What should be in an onboarding checklist?
Keep it short and outcome-based. Include only steps that lead directly to first value, plus one checkpoint for validation. For a behavior-adaptive approach, use this onboarding checklist pattern so different users see different next steps based on what they have done.
If you want to make customer onboarding measurable without turning it into an engineering project, Founder OS can help you build no-code in-app onboarding flows, target them by user segment and behavior, and track completion and drop-off so you can improve activation with evidence instead of guesswork. When you are ready, start small: pick one activation event, ship one guided flow, and review the impact weekly.
