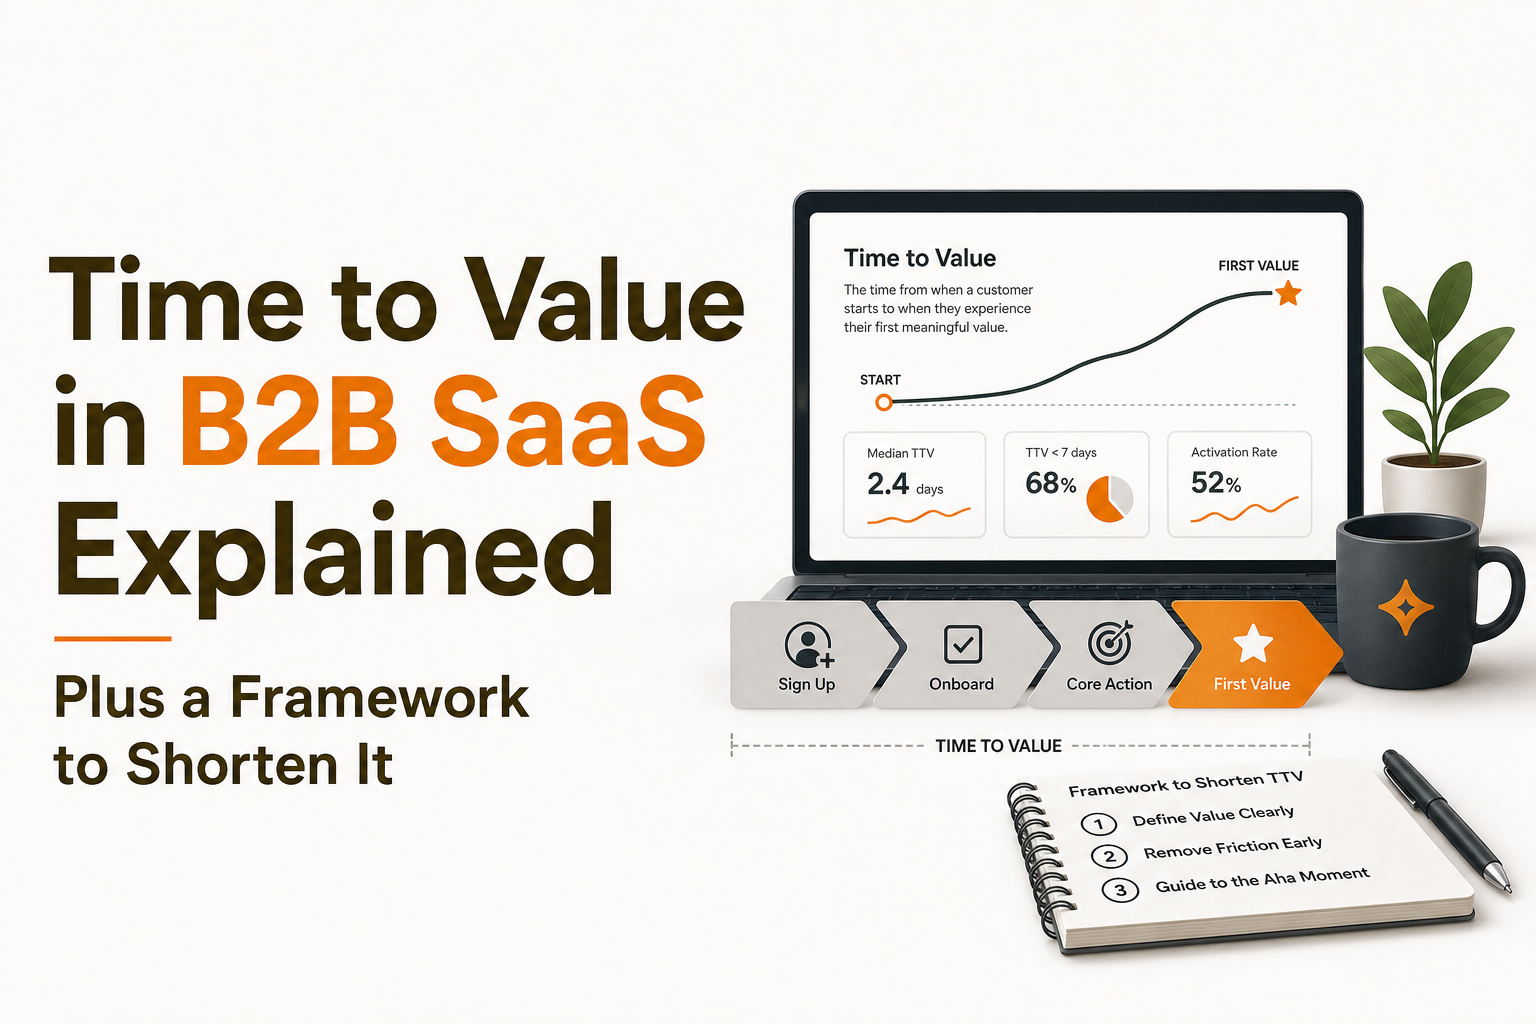
Time to Value in B2B SaaS Explained Plus a Framework to Shorten It
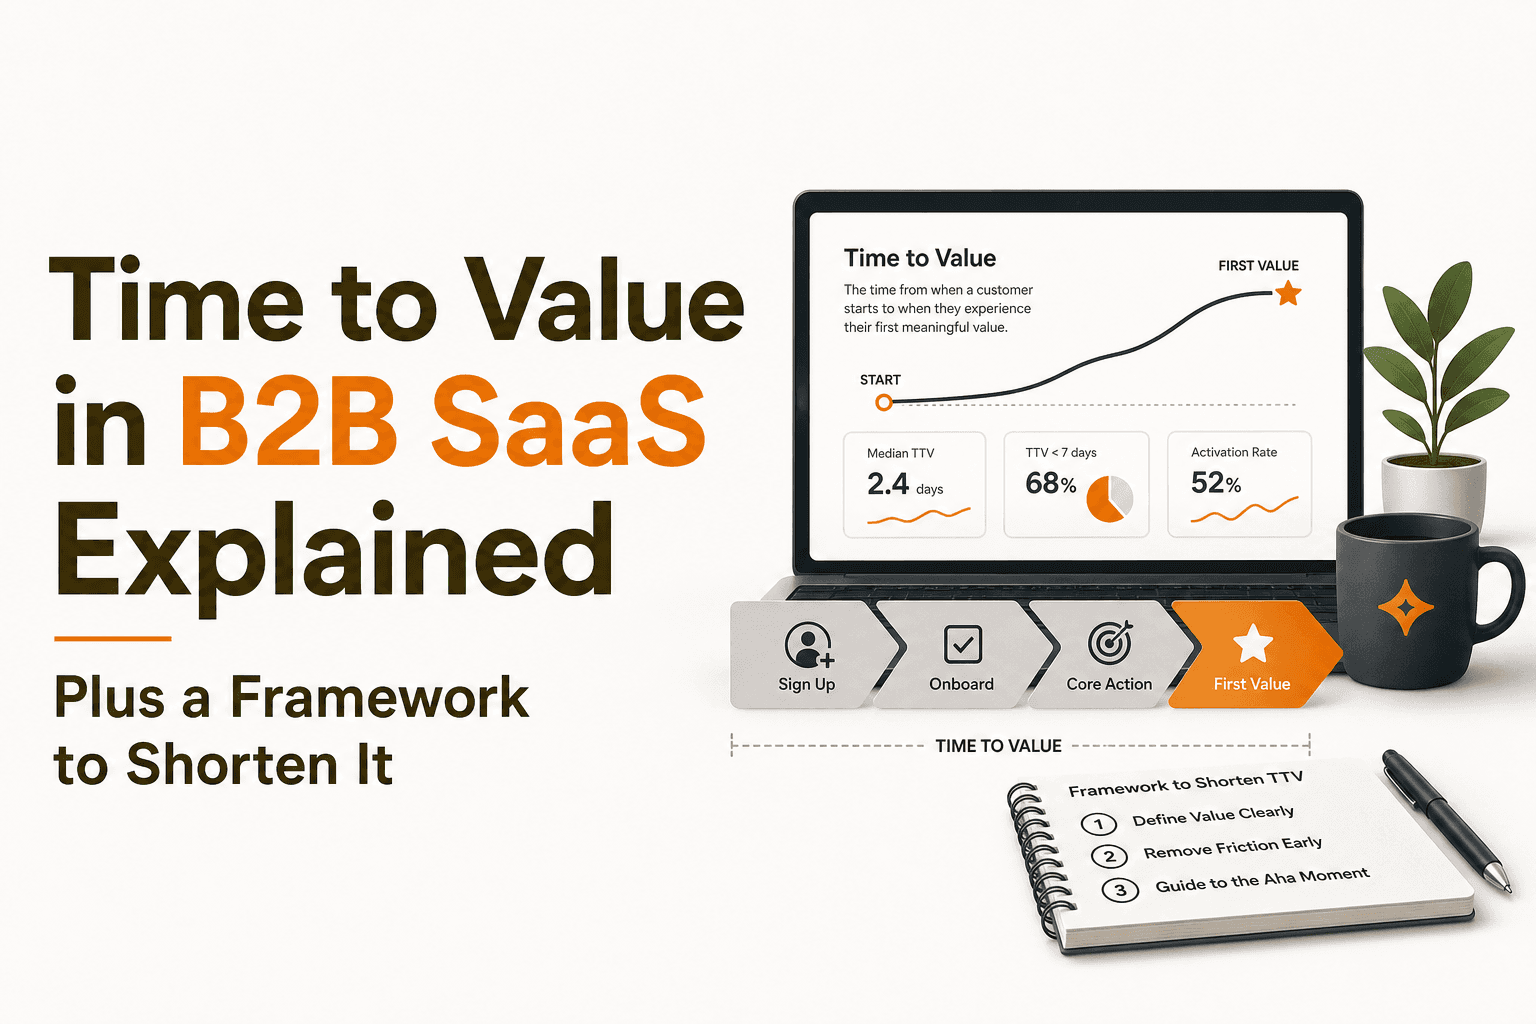
In B2B SaaS, time to value is the clock that decides whether a new account becomes an activated customer or a churn risk. If users cannot reach a clear “first value” moment quickly and repeatedly, onboarding completion rates and pretty tours will not save you. This guide defines time to value precisely and gives a simple, measurable framework to shorten it using behavior-based in-app onboarding flows.
- Time to value is the elapsed time from a meaningful start point to a measurable first-value event, not “finished onboarding.”
- To shorten TTV, pick a single first-value event, instrument it, then remove friction step-by-step with targeted guidance.
- Behavior-based in-app flows beat generic tours because they trigger when users are stuck, segmented, and ready for the next step.
What time to value means in B2B SaaS (and what it’s not)
Definition: TTV is a duration between two measurable timestamps
Time to value (TTV) is the elapsed time between a chosen start timestamp and a chosen value timestamp. The critical part is that both ends must be observable in data, not inferred from “they seemed onboarded.”
A practical definition that works across most B2B SaaS products:
- Start: first meaningful intent signal (for example: first login, workspace created, or invite accepted).
- Value: completion of the first-value event that correlates with retention or expansion (for example: first report generated, first integration connected, first teammate invited and used a key feature).
First value vs activation vs onboarding completion
Teams often conflate four concepts. Here is a concrete way to separate them:
- Onboarding completion: the user finished a checklist, tour, or setup wizard. This is a process metric.
- First value: the user achieved an outcome that feels like “this works for me.” This is an outcome moment.
- Activation: the user repeatedly demonstrates the behaviors that predict retention. This is usually a set of events over time.
- Time to value: how long it takes to reach first value from your selected start point. This is a duration metric.
What TTV is not (common traps and how to spot them)
Use this checklist to avoid measuring the wrong thing:
- Not “time to finish the tour.” If your tour completion does not correlate with retention, it is not value. Many users click through to dismiss overlays.
- Not “time to sign up.” Signup speed matters, but it is rarely the value moment in B2B SaaS. Value usually happens after configuration or usage.
- Not a single number for everyone. Different roles (admin vs contributor) and segments (SMB vs mid-market) can have different first-value moments.
- Not only a UX problem. TTV is affected by product friction, missing data, unclear positioning, and even sales handoff.
If you want to sanity-check whether your “first value” is real, run a simple correlation test: users who hit the event within the first 1 to 7 days should retain more than those who do not. For a primer on diagnosing conversion paths, see funnel analysis.
A simple framework to reduce time to value without rebuilding your product
This framework is designed to be measurable in days, not quarters. It is also intentionally narrow: you focus on one first-value event first, then iterate.
Step 1: Choose one first-value event with clear selection criteria
Pick a first-value event using the criteria below. If your team debates endlessly, score candidates 1 to 5 for each criterion and pick the highest total.
- Outcome-proxy: it represents a meaningful outcome (for example: “report exported” is closer to value than “dashboard viewed”).
- Early: reachable within the first session or first week for the right segment.
- Repeatable: users can do it again, and it leads into habitual usage.
- Segment-stable: it makes sense for your core ICP, not a niche edge case.
- Instrumentable: you can track it reliably with event properties (who, what, where, when).
Example candidates (pick one):
- First integration connected (plus first successful sync)
- First teammate invited (plus teammate completes one key action)
- First workflow created (plus first run succeeds)
- First insight generated (plus saved/shared)
Step 2: Define the start point and the “TTV clock” rules
Write your TTV definition as a single sentence and pin it in your analytics dashboard:
“Time to value is the time from [start_event] to [first_value_event] for users in [segment], measured in minutes/hours/days.”
Then decide these rules:
- Clock start: signup, first login, workspace created, or invite accepted.
- Clock stop: the first time the value event occurs (not the last step of a tour).
- Window: 7 days is common for self-serve; 14 to 30 days may fit sales-led motion. Keep it consistent for comparison.
- Unit: measure in hours if you want fast iteration; days if your product needs data accumulation.
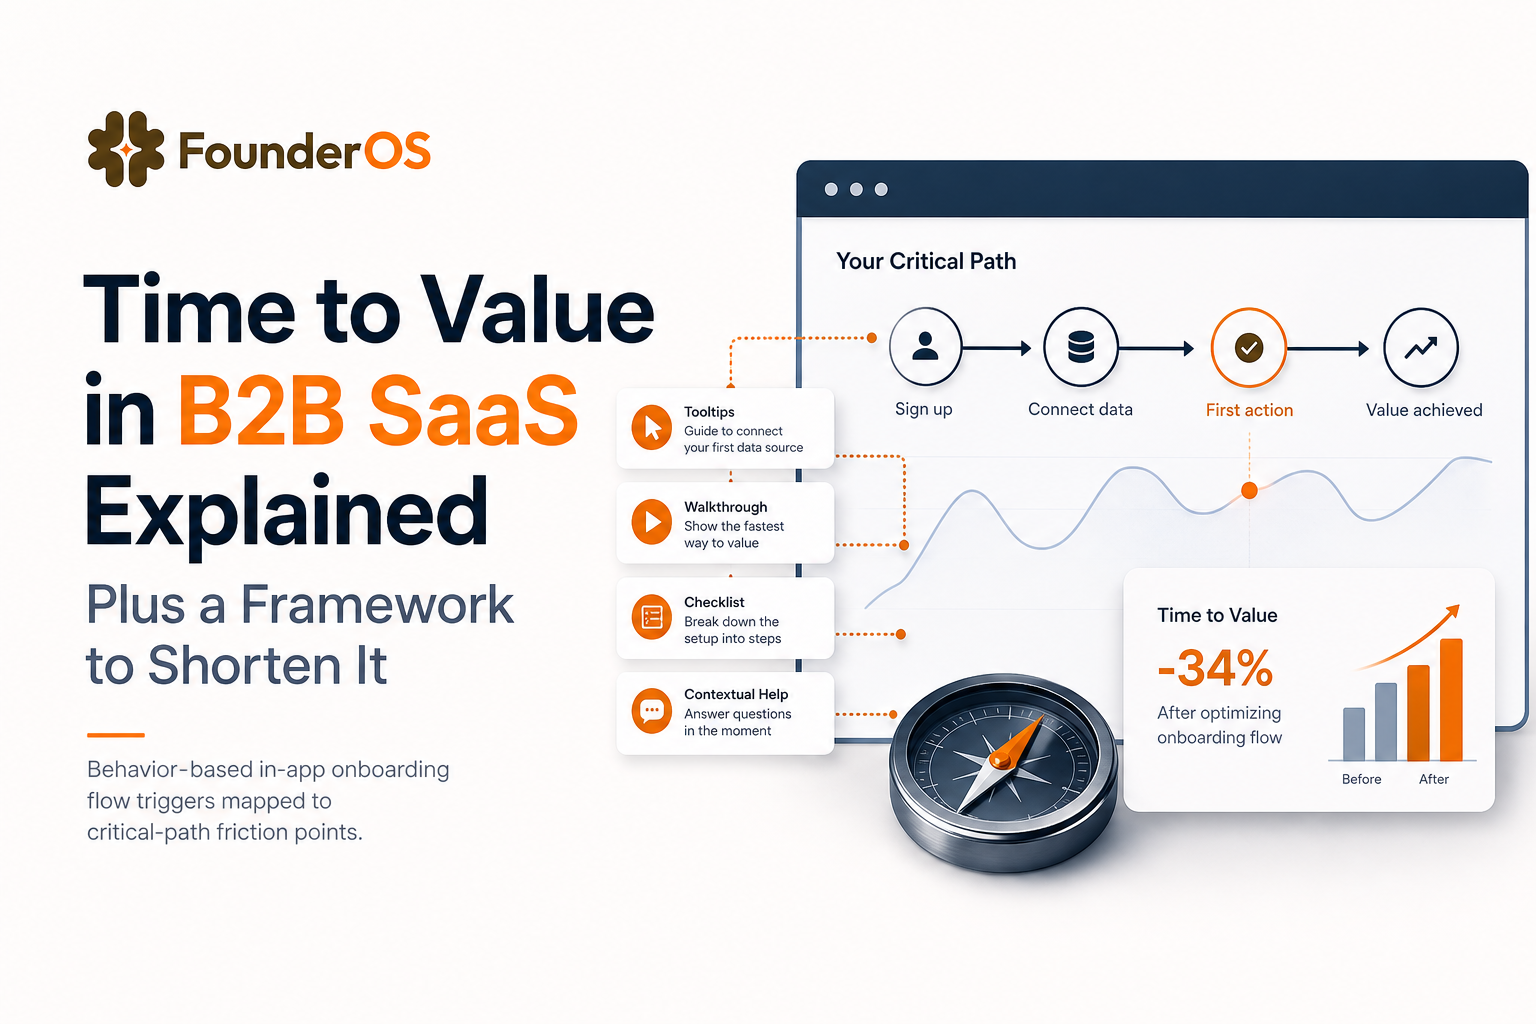
Step 3: Map the critical path and quantify friction at each step
Create a “critical path” map from start to value with 5 to 9 steps. For each step, track:
- Completion rate (step-to-step conversion)
- Time spent between steps (median and p90)
- Error rate (validation errors, failed API calls, empty states)
- Help signals (docs clicks, support chat opens, rage clicks if you track them)
Keep it concrete. Example for an analytics product:
- First login
- Create project
- Install snippet / SDK
- Send first event
- Verify event in debugger
- Create first report
This is where many teams discover that their “onboarding problem” is actually an instrumentation or data-availability problem.
Step 4: Remove friction with a ranked backlog (highest impact first)
Turn the critical path into a backlog. Rank each friction item by:
- Impact: how much it reduces time to value or increases the value-event rate
- Confidence: strength of evidence (analytics drop-off, session replays, support logs)
- Effort: engineering time, design time, or no-code time
Prioritize the items with high impact, high confidence, low effort. Many of these can be solved with better in-app guidance rather than product changes.
Step 5: Re-measure weekly and compare cohorts, not averages
Averages hide pain. Track:
- Median time to value (what most users experience)
- P90 time to value (where frustration and churn live)
- Value-event rate within 1 day, 3 days, 7 days
Then compare cohorts: users who saw a specific onboarding flow vs those who did not, new pricing page traffic vs old, admin vs member roles, and so on.
How behavior-based in-app flows shorten time to value
Generic tours are usually linear and same-for-everyone. They often increase clicks but not outcomes. Behavior-based flows reduce time to value because they show the right help at the exact moment a user is likely to need it.
Principle 1: Trigger guidance from behavior, not from “day 1”
Use triggers tied to the critical path, such as:
- User visited the integration page twice but did not connect
- User created a workspace but has zero data after 10 minutes
- User opened a key screen three times but never completed the primary action
These triggers let you intervene precisely where time to value is being lost.
Principle 2: Segment by intent and role so you do not waste attention
Segmentation is the difference between “noise” and “help.” A simple segmentation model that works for many B2B SaaS products:
- Role: admin, operator, viewer
- Use case: primary job-to-be-done chosen at signup (or inferred from first actions)
- Lifecycle: new, stuck, activated, expanding
Then tailor the next best step. For example, admins might need setup and permissions; contributors might need templates and shortcuts.
Principle 3: Use progressive disclosure, not a single “master tour”
Progressive disclosure means you reveal complexity only when it becomes relevant. This shortens time to value by keeping cognitive load low.
Use this pattern:
- Step 1: one action that unlocks value (for example: connect data, import CSV, create first project)
- Step 2: immediate confirmation (success state, example output, “what changed”)
- Step 3: optional acceleration (template, automation, invite teammate)
If you want a concrete structure for building this, see the guided product tour blueprint and adapt it to your critical path.
A practical playbook you can run this week to improve time to value
Day 1: Write your TTV spec and instrument the two endpoints
Create a one-page spec with:
- Start event name and properties
- First-value event name and properties
- Segment definition (who counts)
- Success target (for example: “reduce median time to value from 2.5 days to 1.5 days”)
If you do not already track the endpoints, instrument them first. A tracking plan should include event naming conventions, required properties (workspace_id, role, plan, source), and validation steps. For industry-specific onboarding patterns that influence what you should track, reference this app onboarding process guide.
Day 2 to 3: Build a critical-path funnel and identify the top 2 friction points
In your analytics tool, build a funnel from start to value. Then answer:
- Where is the biggest step drop-off?
- Where is the biggest time delay (median and p90)?
Pick only the top two friction points. Trying to fix everything at once usually increases time to value because it adds more UI and more steps.
Day 4 to 5: Add two behavior-based flows that remove friction
Design flows that do one of these jobs:
- Explain the “why” at the moment of hesitation (for example: why an integration is needed).
- Unblock the “how” with a contextual hint, pre-filled example, or template.
- Confirm success and point to the next step immediately after completion.
Keep each flow under 3 to 5 steps. If you need more, you are likely mixing multiple jobs-to-be-done.
Day 6 to 7: Measure impact with a simple experiment design
You do not need a perfect A/B test to learn. Start with a holdout cohort if you can:
- Variant: users who see the new flow
- Control: similar users who do not
- Primary metric: median time to value and value-event rate within 7 days
- Secondary metrics: support tickets tagged “setup,” activation proxy, and drop-off at the friction step
For flow quality control, use an onboarding checklist that adapts to behavior, not assumptions.
| Metric | How to calculate | What “good” looks like (directionally) | What to do if it’s bad |
|---|---|---|---|
| Median time to value | median(timestamp(value_event) - timestamp(start_event)) | Decreasing week over week | Remove steps, add contextual guidance at the biggest delay |
| P90 time to value | 90th percentile duration | Sharp drops after fixing a single friction point | Identify edge cases, missing permissions, unclear errors |
| Value-event rate (7-day) | % users hitting value_event within 7 days | Increasing without inflating support | Improve guidance, templates, defaults, and success feedback |
| Step drop-off rate | 1 - (users completing step N+1 / users completing step N) | Largest drop-off shrinks first | Rewrite microcopy, reduce fields, add just-in-time tooltips |
FAQ about time to value in B2B SaaS
How do I pick the right first-value event?
Pick the earliest event that (1) represents a real outcome, (2) is trackable, and (3) correlates with retention. If you are unsure, shortlist 3 candidates and check which one best separates retained vs churned users after 30 to 60 days.
What’s a reasonable time to value benchmark?
It depends on product complexity and data dependencies. Self-serve tools often aim for hours to 1 to 3 days; data-heavy or workflow products may be 7 to 14 days. The most useful benchmark is your own trend: reduce median time to value and p90 time to value month over month while increasing the value-event rate.
Why do my onboarding tours complete but activation does not improve?
Because completion is not value. Users may click through to dismiss overlays, or the tour may highlight features that are not on the critical path to first value. Replace linear tours with behavior-based prompts triggered by specific drop-offs, and measure impact on the value-event rate.
What data do I need to measure time to value correctly?
You need a start event, a first-value event, consistent user and account identifiers, and key properties like role, plan, and acquisition source. Also track step events on the critical path so you can see where time is being lost. For measurement standards and event design guidance, see Amplitude’s tracking plan guide.
If you want to shorten time to value with behavior-based onboarding flows while also measuring completion, drop-off, and downstream activation in one place, Founder OS combines no-code in-app guidance with product analytics so you can iterate quickly and prove impact. Start by defining your first-value event, then build the smallest flow that helps users reach it faster.

Stay in the loop
Get the latest insights on SaaS growth, product strategy, and more delivered to your inbox.