
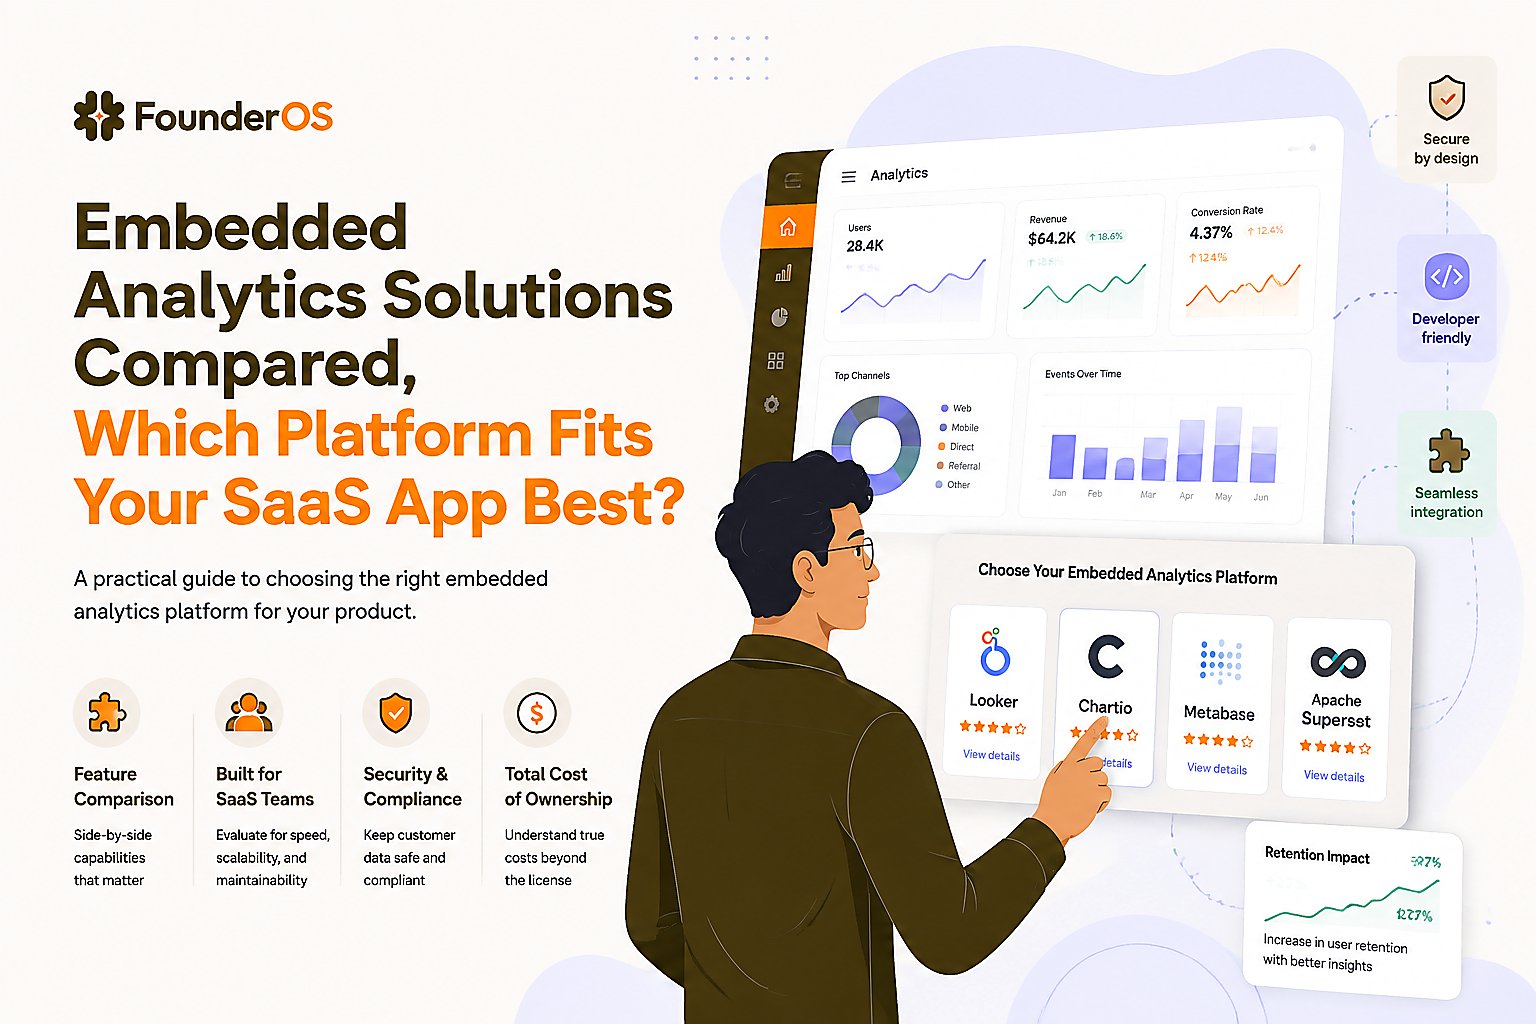
Embedded Analytics Solutions Compared, Which Platform Fits Your SaaS App Best?
Embedded analytics solutions for SaaS products succeed or fail on a few buyer-critical details: tenant-safe security, SSO, white-label control, and a pricing model that does not explode when you add customers and viewers.
- Pick a platform by deployment and security first (JWT/SSO, row-level security, tenant isolation), then design flexibility, then cost.
- Most surprises come from viewer-based pricing, multi-tenant governance effort, and the engineering time required to make embeds truly white-labeled.
- Use a shortlist checklist to confirm fit in one week: a working tenant-safe embed, SSO, branded UI, and a costed rollout plan.
Clarify embedded analytics, embedded BI, white-label analytics, and operational analytics before you buy
Embedded analytics buying decisions get easier once you separate customer-facing embeds from internal BI and from operational reporting that lives inside a workflow.
Four terms buyers mix up and what each implies technically
- Embedded analytics: charts, tables, or dashboards rendered inside your SaaS UI, typically with application-controlled authentication and tenant scoping. The key requirement is that your app controls who sees what.
- Embedded BI: a BI product (modeling, SQL, semantic layers, admin console) with embedding capabilities. This often brings more power, but also more governance and admin overhead.
- White-label analytics: embedded analytics where the end user experiences it as part of your product, not a third-party tool. This raises requirements for CSS/theming, URL/domain controls, nav removal, and consistent UX.
- Operational analytics: analytics embedded into actions, not just viewing. Example: a pipeline dashboard that links directly into “create campaign” or “export cohort”, often requiring write-backs or deep links.
A fast “fit” test for customer-facing SaaS analytics
If your customers log into your product and expect analytics per workspace or account, you are shopping for embedded analytics solutions with multi-tenancy controls. The minimum bar is: (1) app-driven authentication (SSO, JWT, or both), (2) tenant isolation (row-level security and/or separate schemas), (3) consistent rendering across tenants, and (4) operational guardrails like rate limits and audit logs.
Decision consequences you can predict upfront
- If you choose an internal BI tool and “just iframe it”, you typically inherit an admin UI your customers can discover, plus awkward permission drift.
- If you choose a lightweight embed library with no governance, your engineering team becomes the BI team (models, permissions, upgrades, query performance).
- If you need white-labeling, validate it with a real prototype, not a demo, because “theme support” often means only colors, not layout and navigation.
Compare Tableau, Sigma, Metabase, Embeddable, and SAP by fit, flexibility, and cost
Embedded analytics solutions differ most on four axes: embedding depth, multi-tenant security, deployment options, and how pricing scales with viewers.
At-a-glance comparison for SaaS customer-facing analytics
Use this table as a shortlist filter, then validate with a tenant-safe prototype (Section 3) and a costed rollout plan (Section 4).
| Option | Best fit | Embedding depth | Multi-tenancy readiness | Deployment | Cost scaling risk |
|---|---|---|---|---|---|
| Tableau | Enterprise orgs standardizing on Tableau | Strong viz, embedding available | Possible, but admin-heavy | Cloud and self-hosted (by edition) | High if priced per user/viewer |
| Sigma | Cloud data warehouse native analytics | Strong for interactive exploration | Depends on your governance model | Cloud-first | Medium to high depending on viewer model |
| Metabase | Teams wanting open-source BI with embedding | Solid basic embeds | Requires careful RLS setup | Cloud or self-host | Medium: infra and maintenance shift to you |
| Embeddable | SaaS products prioritizing embed UX and dev velocity | Built for embedding and customization | Designed for multi-tenant embeds | Typically SaaS | Medium: depends on pricing basis |
| SAP Embedded Analytics | SAP-centric landscapes needing in-suite analytics | Deep in SAP workflows | Strong within SAP constructs | Typically SAP stack | Variable, driven by SAP licensing |
How to interpret the table as a buyer
- Embedding depth is not “can you embed” but “can you embed without exposing admin surfaces, without breaking navigation, and without rewriting your UI.”
- Multi-tenancy readiness is about safe defaults: tenant filters, permission boundaries, and auditability.
- Deployment matters when customers require data residency, private networking, or strict SOC2 procurement constraints.
- Cost scaling risk is where “per viewer” models can become your biggest line item as you grow.
Quick shortlist guidance
- Choose Tableau when your organization is already standardized on it and you can staff governance and admin.
- Choose Sigma when you want business users exploring warehouse data with a spreadsheet-like model and can align on permissions.
- Choose Metabase when you want flexibility and are willing to own ops, upgrades, and performance tuning.
- Choose Embeddable when the product experience and embedded customization are primary, and you want a platform designed for SaaS embedding.
- Choose SAP Embedded Analytics when SAP is the system of record and you need analytics that live inside SAP processes.
Show the real integration flow, from SSO and JWT to tenant-safe rendering
A production-ready embedded analytics integration uses a reference sequence that starts in your app, not inside the analytics tool, so your SaaS owns identity, tenant scope, and authorization.
Reference architecture you can use in a technical review
- User authenticates to your SaaS via your standard auth (SAML/OIDC SSO, passwordless, etc.).
- Your backend issues an embed token (commonly JWT) for the analytics renderer, signed server-side.
- Token claims enforce tenant scope, for example: tenant_id, workspace_id, role, allowed_dashboards, and an expiration.
- The embed loads a tenant-safe view (dashboard or component) with server-validated claims, not client-side filters.
- Row-level security is applied at the query layer (warehouse policy, semantic layer, or tool-level RLS) so “tenant_id” cannot be bypassed by URL edits.
- Audit logging captures access (who viewed what, from which tenant) for security review and support debugging.
JWT and SSO specifics that prevent tenant data leaks
- Short TTL: use short-lived tokens (minutes) and refresh them server-side to reduce replay risk.
- Signed server-side only: never generate or sign embed tokens in the browser.
- Immutable tenant claims: treat tenant identifiers as authoritative and deny requests when a mismatch exists between SaaS session and token claims.
- Enforce RLS in the data layer: filters in the UI are not security controls; enforce in SQL policies or tool permissions.
Rendering sequence and UX considerations buyers forget
We initially assumed iframe embedding would be the fastest path, but usability tests showed that navigation, loading states, and consistent theming took more time than the auth work. Plan for: skeleton loaders, error fallbacks, responsive breakpoints, and a “no data for this tenant” state that does not look like a broken dashboard.
Break down pricing and TCO by viewer count, engineering time, and maintenance
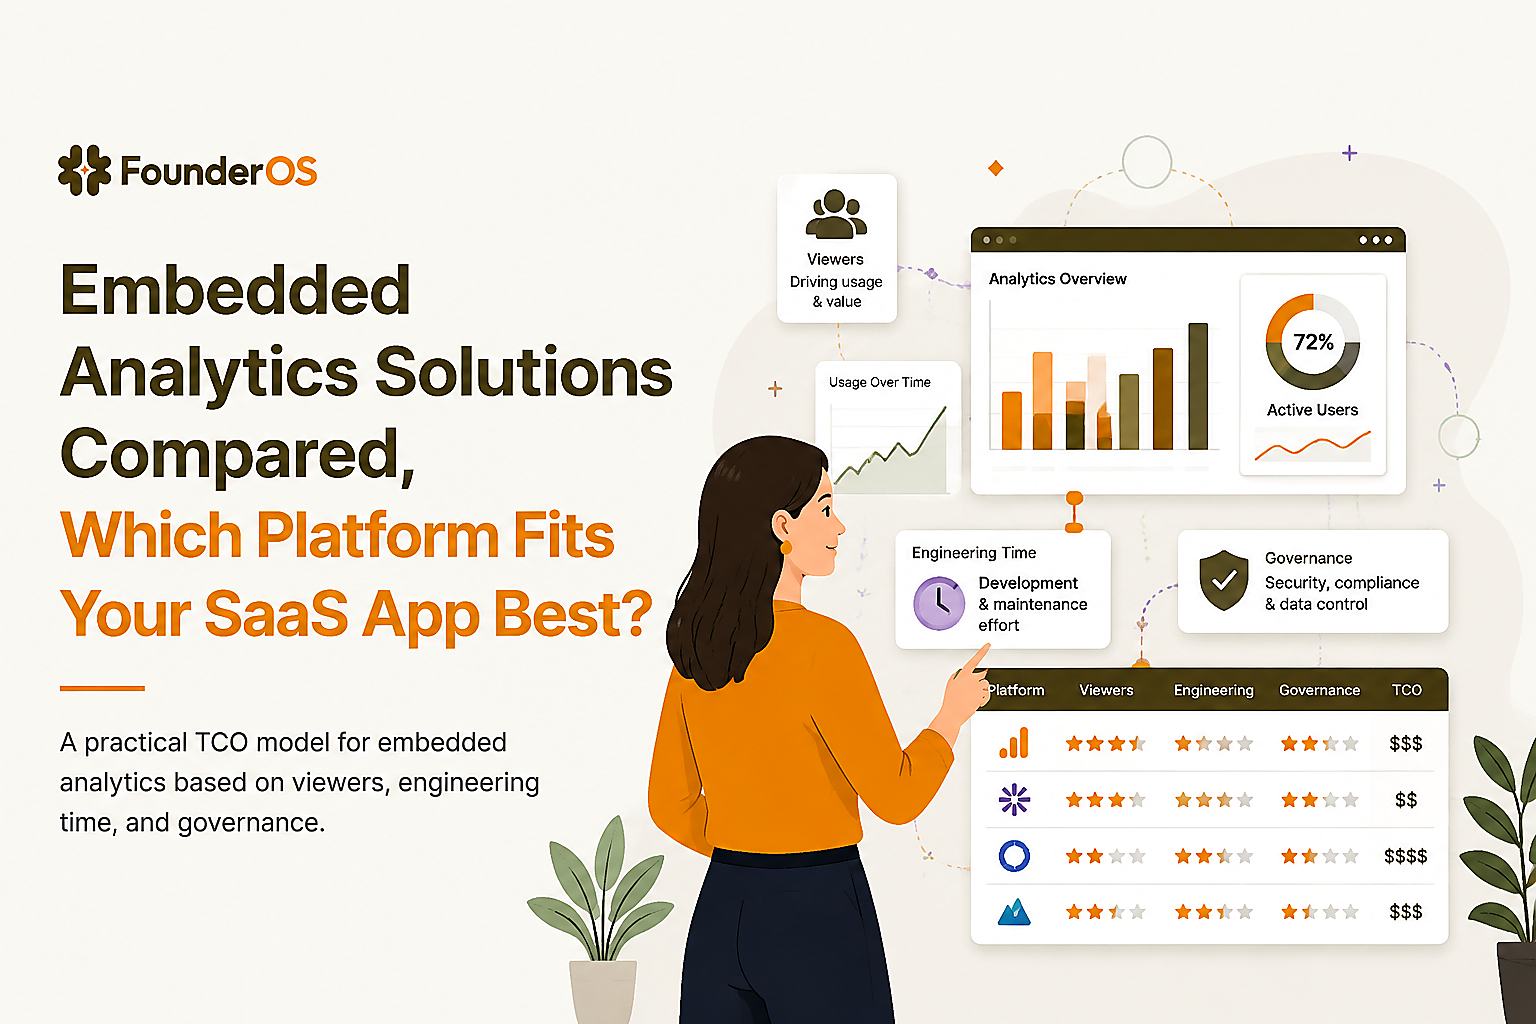
Total cost for embedded analytics solutions is usually dominated by scaling to many viewers and by ongoing governance work, not by the first proof of concept.
Three cost buckets to model in a one-page TCO sheet
- License and usage costs: per viewer, per creator, per workspace, per query, or per compute.
- Engineering costs: integration (SSO/JWT), theming, permission mapping, and automated tenant provisioning.
- Maintenance costs: model changes, dashboard versioning, customer support for “data looks wrong”, and performance tuning.
Viewer growth scenarios that change the answer
- Scenario A: a few high-value customers (tens to hundreds of users). Per-user models can be workable if the price aligns with contract value.
- Scenario B: product-led growth (thousands to tens of thousands of viewers). Per-viewer pricing can become your fastest-growing COGS line item.
- Scenario C: internal plus customer-facing. Separate creator seats from viewer access, or you will pay “builder” rates for everyone who only needs to read.
Hidden TCO items to force into the evaluation
- Tenant onboarding automation: if adding a tenant requires manual dashboard cloning, your support team will bottleneck growth.
- Data contract changes: embedded dashboards break when event names, dimensions, or joins change. Budget for versioning and compatibility checks.
- Performance and cache strategy: customer-facing analytics needs predictable latency. Determine whether caching is built-in or you own it.
- Compliance reviews: security questionnaires, pen tests, and audit evidence collection are time costs, even when the platform is secure.
After running multiple embedded rollouts, the pattern was clear: the “cheap” choice becomes expensive when you hit multi-tenant governance and support load, especially if you cannot reproduce what a customer saw with audits and per-tenant debug tools.
| Cost driver | What to measure | Why it matters | How to validate in a pilot |
|---|---|---|---|
| Viewer pricing | Price basis (viewer, MAU, query, compute) | COGS can scale faster than revenue in PLG | Ask for a pricing sheet matching 1k, 10k, 50k viewers |
| Engineering time | SSO/JWT, provisioning, theming | Delays launch and increases dependency on senior engineers | Build one tenant end-to-end with real auth and RLS |
| Governance | Permission mapping and audit logs | Prevents cross-tenant exposure and speeds support | Run a “tenant switch” test and permission regression checks |
| Maintenance | Upgrade cadence, model changes, dashboard versioning | Breakage becomes customer-facing incidents | Simulate a schema change and confirm backward compatibility plan |
Evaluate white-label depth, multi-tenancy, AI search, and governance before you buy
The fastest way to separate surface-level embeds from production-ready embedded analytics solutions is to score them against a concrete acceptance checklist.
White-label depth checklist
- Branding: theme tokens, fonts, spacing, and component styling, not only logo swaps.
- Navigation control: remove or replace vendor navigation, tooltips, and settings menus.
- Domain control: support custom domains or at least consistent URL behavior to reduce “third-party” feel.
- Error handling: customizable empty states and error messages that match your product tone.
Multi-tenancy and security checklist
- Tenant isolation strategy: RLS policies, separate schemas, or per-tenant databases, documented and testable.
- Permission mapping: map SaaS roles to analytics permissions without manual per-user admin work.
- Auditability: access logs for dashboards and queries, plus an admin trail for permission changes.
- Least privilege by default: viewers cannot discover other tenants via search, URL guessing, or saved links.
AI search and natural language features: what to demand
- Scoped answers: AI query must respect tenant claims and RLS, not just UI filters.
- Explainability: show the query or dimensions used so support can debug “why this number”.
- Governed metrics: AI should use defined metrics, not invent calculations that drift from finance or ops definitions.
In our experience working with SaaS teams shipping customer dashboards, the biggest governance failure is not malicious access; it is “permission drift” after role changes and new features. Require automated tests that validate the same user in two tenants cannot see cross-tenant results.
Explain where SAP embedded analytics fits, and when third-party tools win
SAP Embedded Analytics is usually the right path when your data model, authorization, and workflows live primarily inside SAP and your analytics must follow SAP’s security and business context.
Where SAP embedded analytics is a strong fit
- SAP as system of record: operational reporting tied tightly to SAP objects and transactions.
- In-suite user experience: analytics needs to appear inside SAP apps with consistent roles and authorizations.
- Standardized governance: organizations that already have SAP security teams and processes can extend them to analytics.
When third-party embedded platforms typically win
- Non-SAP product UI: your SaaS app is the primary interface, so you need deep UI control and white-labeling.
- Fast iteration: you ship analytics updates weekly, and you cannot afford heavy release cycles tied to core ERP governance.
- Broad data sources: product events, CRM, billing, and warehouse data need to combine into one customer-facing experience.
A practical rule for mixed environments
If SAP data is one source among many and your customer-facing experience is not SAP-native, treat SAP analytics as internal operational reporting and use dedicated embedded analytics solutions for the customer dashboard layer. This avoids forcing your SaaS UX and multi-tenant model into an ERP-shaped toolchain.
Use a final shortlist checklist to pick the right solution this week
The most reliable way to pick among embedded analytics solutions is to run a one-week evaluation that produces a working tenant-safe embed, a governance plan, and a costed rollout.
One-week evaluation plan (deliverables, not opinions)
- Day 1: Define 3 customer-facing dashboards and the exact tenant boundary (workspace, account, org).
- Day 2: Implement SSO or JWT embed with short-lived tokens and server-side signing.
- Day 3: Enforce RLS and run cross-tenant leak tests (URL guessing, filter removal, saved link replay).
- Day 4: Apply branding and remove vendor UI, then test responsive layouts in your product shell.
- Day 5: Produce a TCO sheet with viewer growth scenarios and an ops plan for onboarding new tenants.
Shortlist scoring rubric (use 1 to 5, require evidence)
- Security and isolation: evidence includes token claims design and RLS proof.
- White-label experience: evidence includes screenshots in your UI with your theme and no vendor nav.
- Multi-tenant operations: evidence includes automated tenant provisioning and role mapping.
- Performance predictability: evidence includes caching strategy and acceptable load times in your pilot.
- Cost scaling: evidence includes written pricing for viewer growth and any overage model.
Final selection guidance
If you cannot complete a tenant-safe embed with your real auth in a week, treat that as a signal: the platform may still work, but the integration and governance cost is likely to be higher than it appears in demos. Conversely, if you can validate security, branding, and ops quickly, you have found an implementation path that scales.
FAQ
If your real need is not a customer-facing embedded BI layer but instead understanding activation, feature adoption, and revenue-linked journeys, book a demo of Founder OS to see whether its product tracking, user profile segmentation, GTM reporting, and onboarding tooling can replace part of your analytics stack.
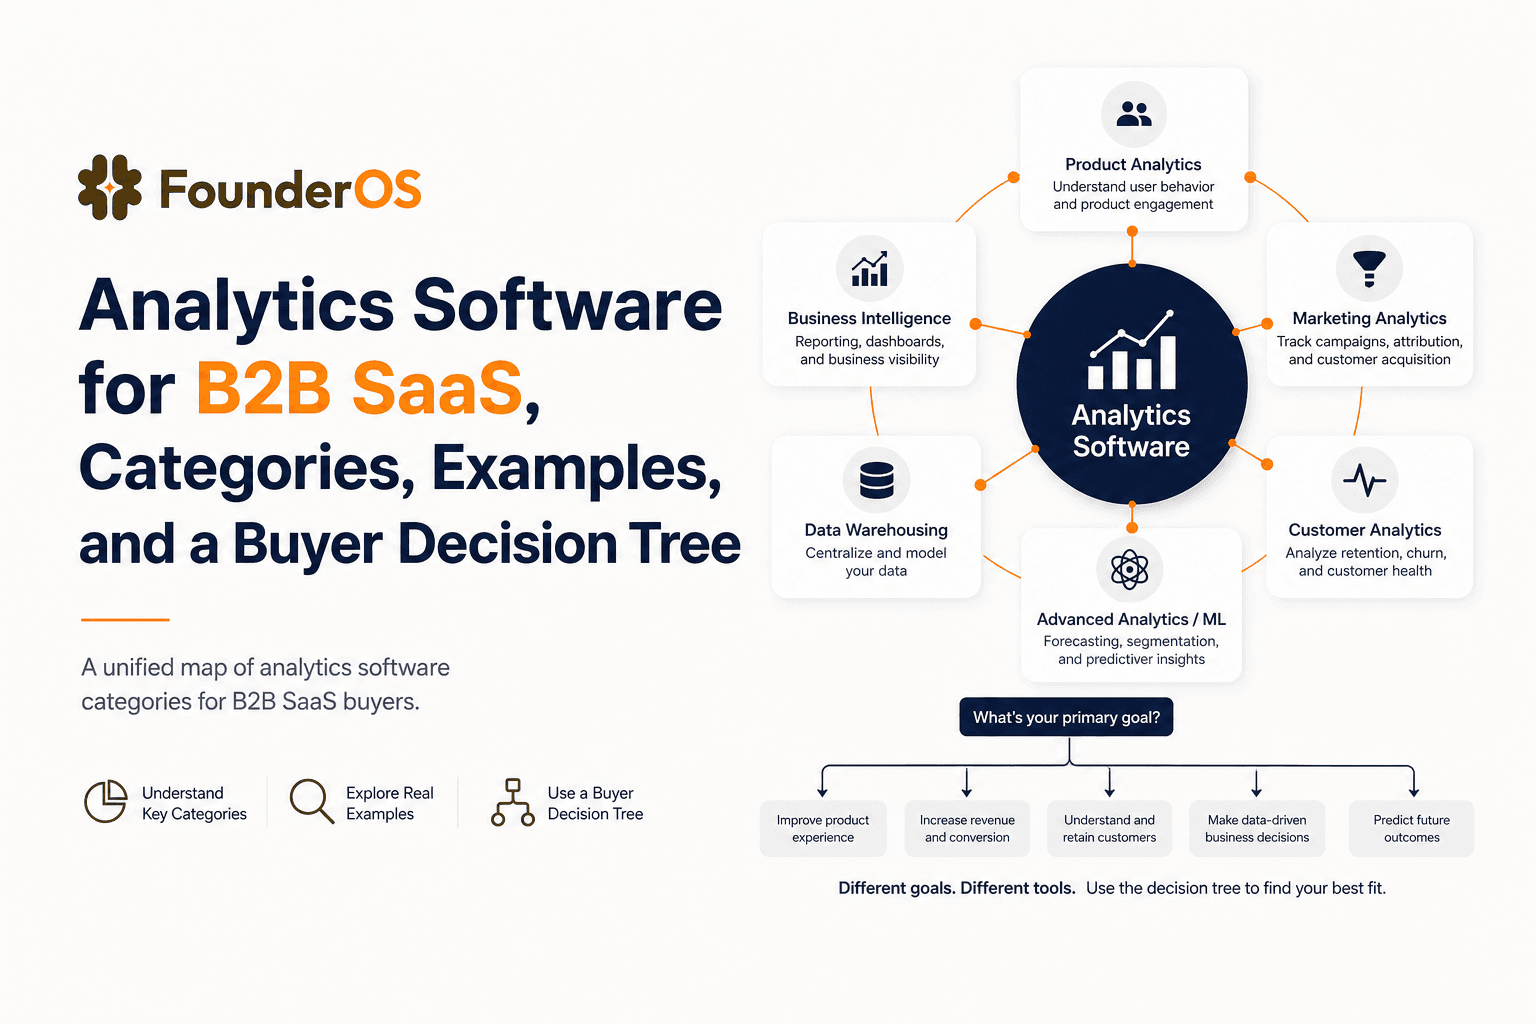
Analytics Software for B2B SaaS, Categories, Examples, and a Buyer Decision Tree
Choose analytics software for B2B SaaS with a clear category map, 10-minute decision tree, real workflows, and a practical buyer checklist.
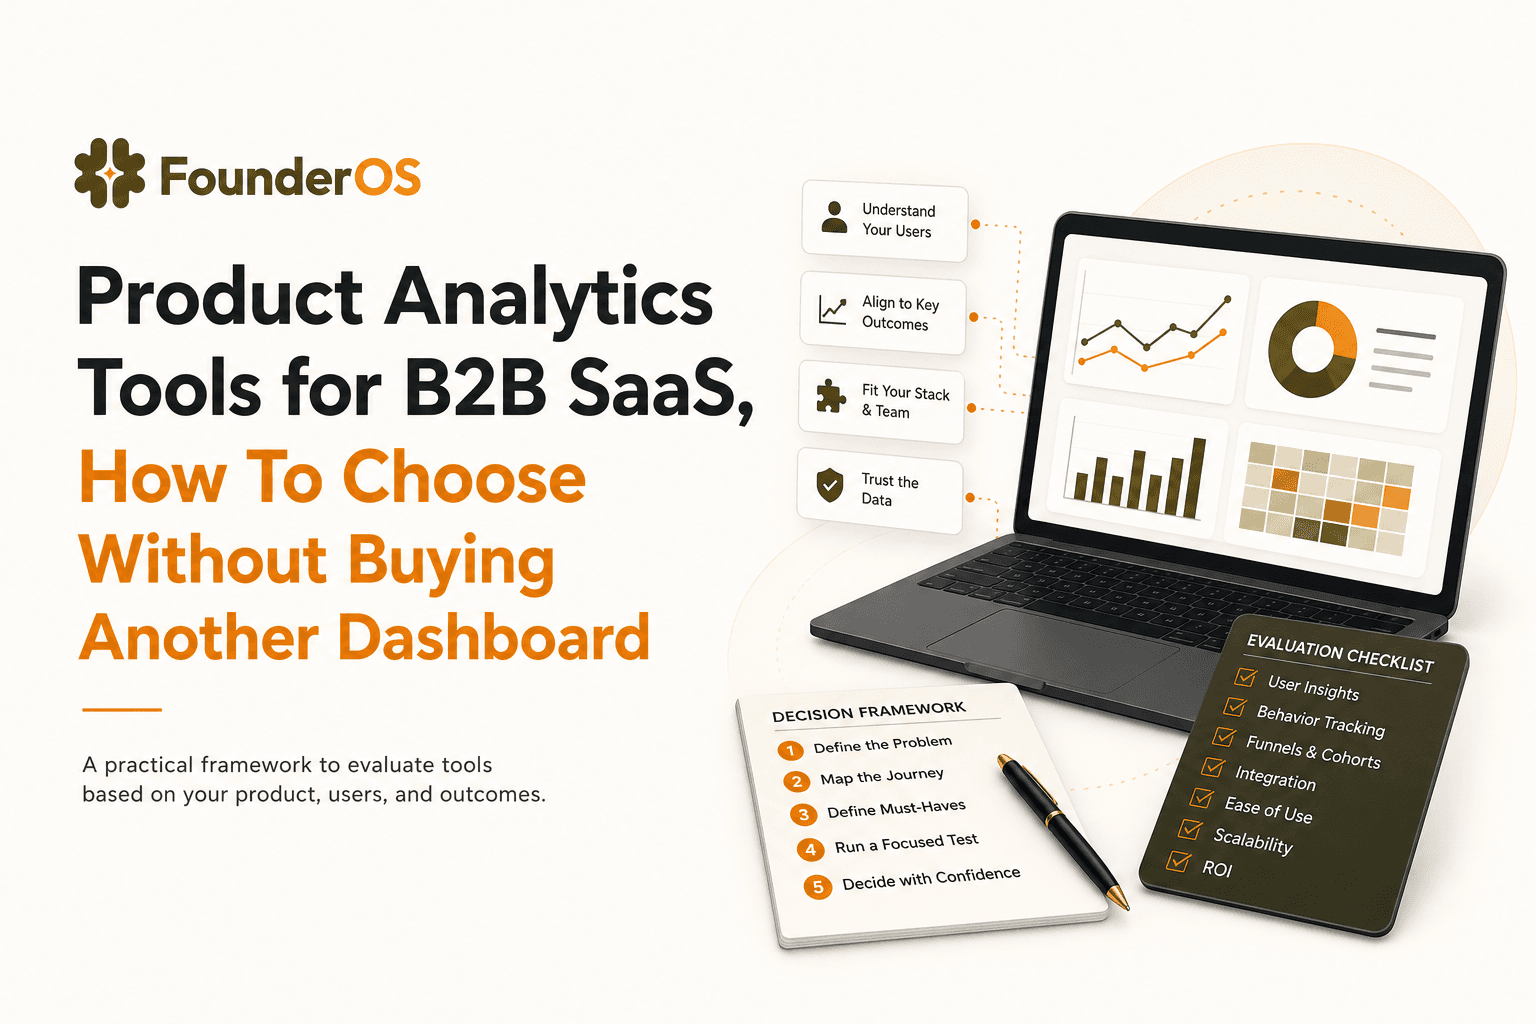
Product Analytics Tools for B2B SaaS, How To Choose Without Buying Another Dashboard
A practical guide to choosing product analytics tools for B2B SaaS: data model, funnels, identity, and revenue insights without dashboard bloat.
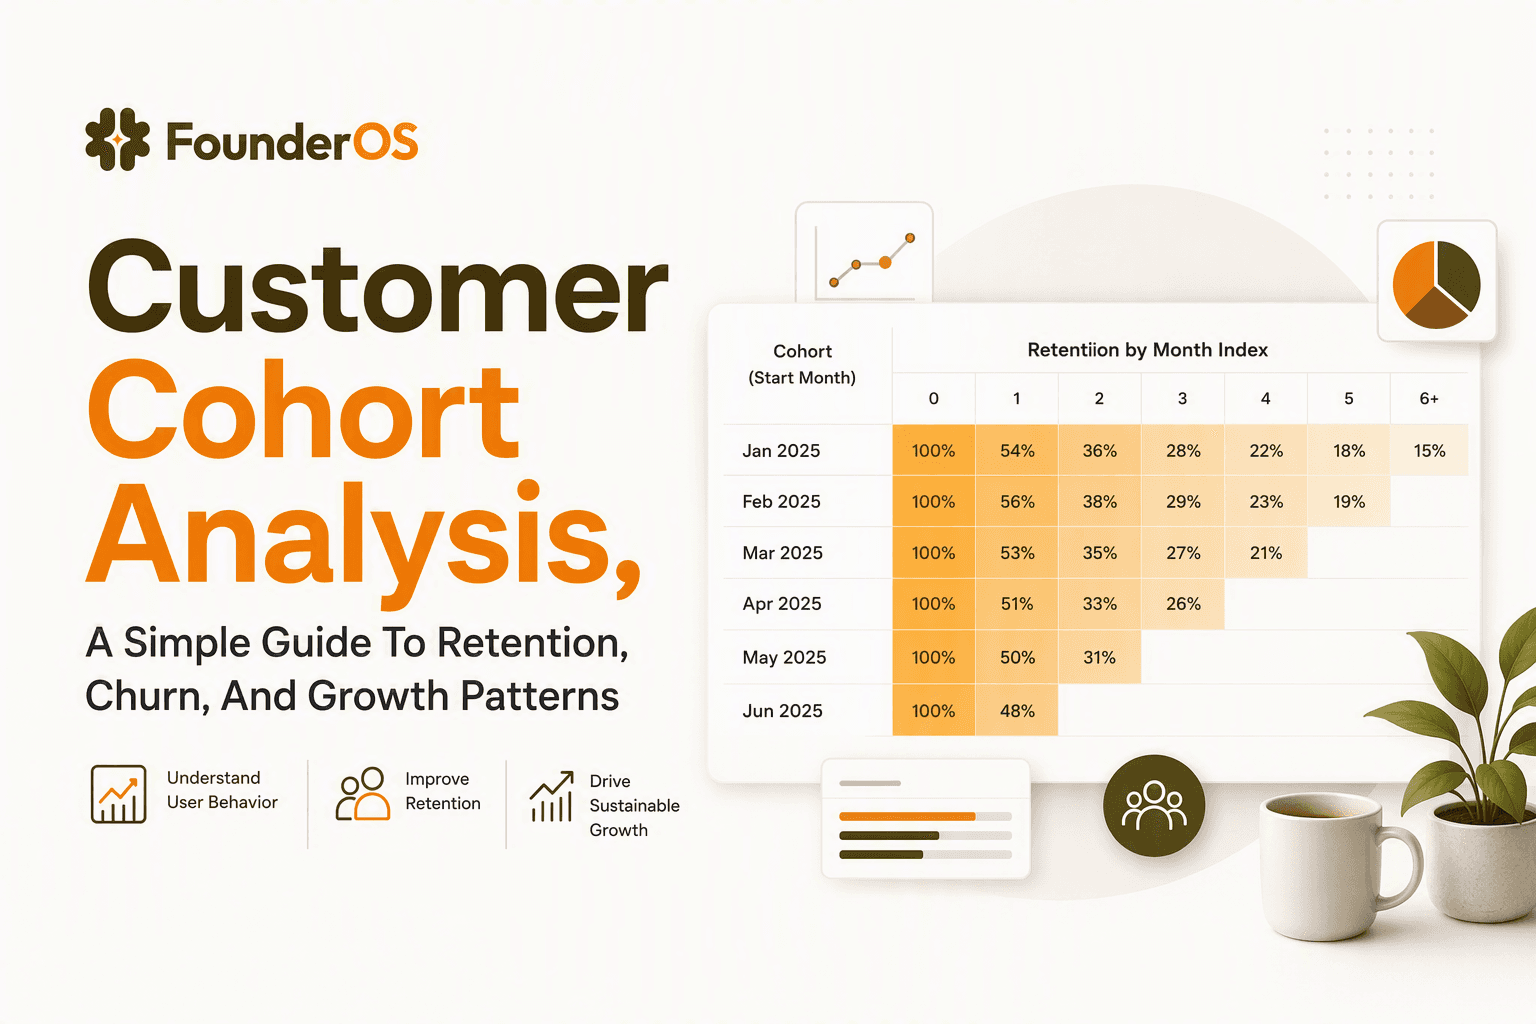
Customer Cohort Analysis, A Simple Guide To Retention, Churn, And Growth Patterns
Learn customer cohort analysis with a simple framework, how to read cohort tables, and a copyable spreadsheet template for retention and churn.