
User Behavior Explained for SaaS Teams, Types, Examples, and How to Track It
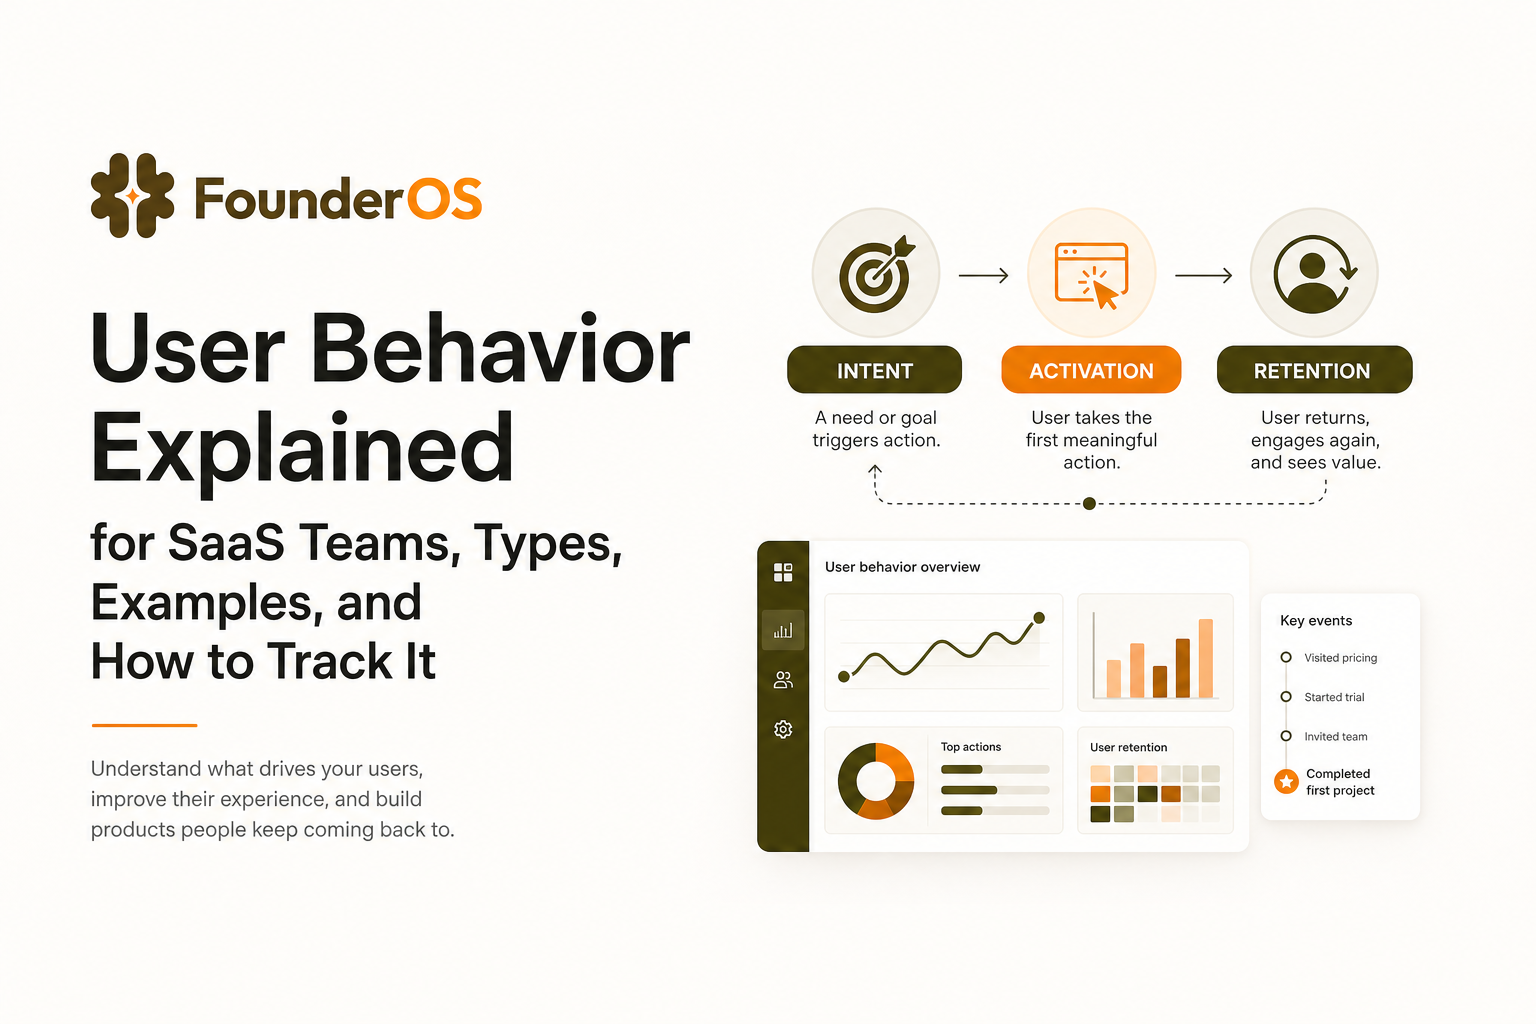
User behavior is the set of observable actions people take in your product or on your website, and it is often the fastest path to diagnosing why activation, conversion, or retention stalls.
- User behavior is about observable actions (events), not opinions, demographics, or assumptions.
- A simple event tracking playbook (goals, taxonomy, identity, QA, governance) prevents messy data and misleading conclusions.
- Behavior becomes useful when you connect it to a decision: a funnel drop-off, a segment difference, and a fix you can validate.
What User Behavior Means in Digital Products and What It Does Not
Definition: in digital products, user behavior is what a person does, in sequence, with timestamps and context. Think: “visited pricing,” “created workspace,” “invited teammate,” “ran first report,” “exported CSV.” If you can capture it as an event with properties, it is behavior.
What user behavior is (operational definition)
- Observable: you can instrument it (click, view, submit, create, invite, export).
- Time-bound: it has recency and frequency (first time, last time, count in 7 days).
- Contextual: it happens on a page/screen, in a plan, in a workspace, on a device.
- Sequenced: it forms paths (A then B then C) that correlate with outcomes like activation or churn.
What user behavior is not (common confusions)
| Often confused with | What it is | How it differs from user behavior | How they work together |
|---|---|---|---|
| User behavior analytics | The practice of analyzing behavior data (funnels, cohorts, segments) | Behavior is the raw actions; analytics is the interpretation layer | Track clean events first, then analyze |
| Web analytics | Traffic and page metrics (sessions, bounce, referrers) | Often anonymous and page-centric; product behavior is person and action-centric | Use web analytics for acquisition, event data for activation |
| UX research | Qualitative insight (interviews, usability tests) | Research explains “why”; behavior shows “what” and “where” at scale | Use behavior to pick who to interview and what to test |
| UEBA (cybersecurity) | User and entity behavior analytics for threat detection | Different domain: security anomalies, not product growth outcomes | Keep naming clear to avoid stakeholder confusion |
A practical rule: if a stakeholder can’t point to an event definition for a claim, it is not grounded in user behavior yet.
The Four Types of User Behavior and How to Recognize Them in Event Data
To make behavior actionable, we classify it into four types that map cleanly to event data and decisions. This avoids the trap of tracking “everything” and learning nothing.
1) Intent signals (what the user is trying to do)
Definition: actions that indicate motivation or evaluation. These often happen before activation.
- SaaS examples: viewed pricing, opened integrations page, compared plans, invited a teammate, created second project.
- Website examples: visited case studies, used ROI calculator, downloaded security docs, returned to pricing twice in 48 hours.
- Event signals: high-value page views + repeat visits + “depth” actions (scroll, expand FAQ, open modal) with short time-to-next-step.
If you want a deeper framework for turning intent into scoring, see how to identify high intent users in saas.
2) Activation behaviors (first value moment)
Definition: the smallest set of actions that reliably predicts a user will stick around because they experienced value.
- SaaS examples: connected data source, created first dashboard, invited 1 teammate, completed first workflow run.
- Website examples: submitted lead form and confirmed email, booked demo and attended.
- Event signals: completion of a sequence within a time window (for example, signup then connect then run report within 24 hours).
3) Habit and engagement behaviors (repeat value)
Definition: behaviors that show the product is becoming part of a routine.
- SaaS examples: weekly report run, daily check of alerts, recurring exports, repeated use of core feature.
- Website examples: returning to documentation, repeated logins from same org, consistent content consumption.
- Event signals: frequency (events per user per week), stickiness (DAU/WAU for relevant actions), and breadth (number of distinct features used).
4) Risk and churn behaviors (loss of momentum)
Definition: behaviors that predict dropout or downgrade: inactivity, failed attempts, or “dead-end” loops.
- SaaS examples: repeated errors, repeated visits to billing page, long gaps after onboarding, removing teammates, disconnecting integrations.
- Website examples: abandoning checkout or form, repeated support searches without conversion.
- Event signals: recency decay (no core events in N days), repeated failure events, high time-on-step with no completion.
In our experience working with early-stage B2B SaaS teams, the biggest unlock is separating “busy activity” (lots of clicks) from “value activity” (the 2 to 4 events that correlate with week-4 retention).
How User Behavior Is Tracked, A Tool-Agnostic Event Tracking Playbook
Good user behavior data is rarely about the tool. It is about a disciplined workflow that keeps events consistent, identities correct, and analysis trustworthy.
Step 1: Write outcome-first goals (not event-first)
- Pick 1 primary outcome per analysis: activation, conversion, retention, expansion, support deflection.
- Define success in one sentence: “A new user reaches X within Y hours.”
- List 3 candidate behaviors that plausibly cause the outcome (not just correlate).
Step 2: Build a minimal event taxonomy (start with 20 to 40 events)
A simple taxonomy prevents naming chaos. Use verbs and objects.
- Core events: signup_completed, workspace_created, integration_connected, report_run, invite_sent.
- Supporting events: onboarding_step_viewed, error_shown, help_article_viewed, billing_page_viewed.
- Avoid: vague events like “button_clicked” without context.
Step 3: Standardize naming and properties (your future self will thank you)
Use a naming convention and a property dictionary. Example rules:
- Event names: snake_case, past tense or neutral (report_run, integration_connected).
- Required properties: user_id, account_id (if B2B), timestamp, source (web, app), plan_tier.
- Context properties: feature_area, onboarding_variant, error_code, referrer, utm_campaign.
Step 4: Get identity right (anonymous to known, user to account)
- Anonymous ID: track pre-signup behavior (pricing views, docs usage).
- Identify call: merge anonymous activity into the signed-up user.
- B2B account model: attach events to both user and account so you can analyze activation per workspace, not just per person.
Step 5: Consent, governance, and QA (boring, but it prevents disasters)
- Consent: respect cookie consent and regional requirements; do not send PII as event properties.
- QA checklist: verify event fires once, properties populated, timestamps correct, and identity merges correctly.
- Governance: event owner, change log, and deprecation policy (what happens when a feature is removed).
What surprised our team was how often “activation dropped” was actually an instrumentation bug: a key event stopped firing after a UI refactor, and the funnel looked broken even though users were fine. A recurring QA pass (monthly, plus before major releases) prevented false alarms.
A Complete User Behavior Analytics Example From Events to a Product Decision
Here is a concrete example you can copy. We will go from events to a decision, without relying on vanity metrics.
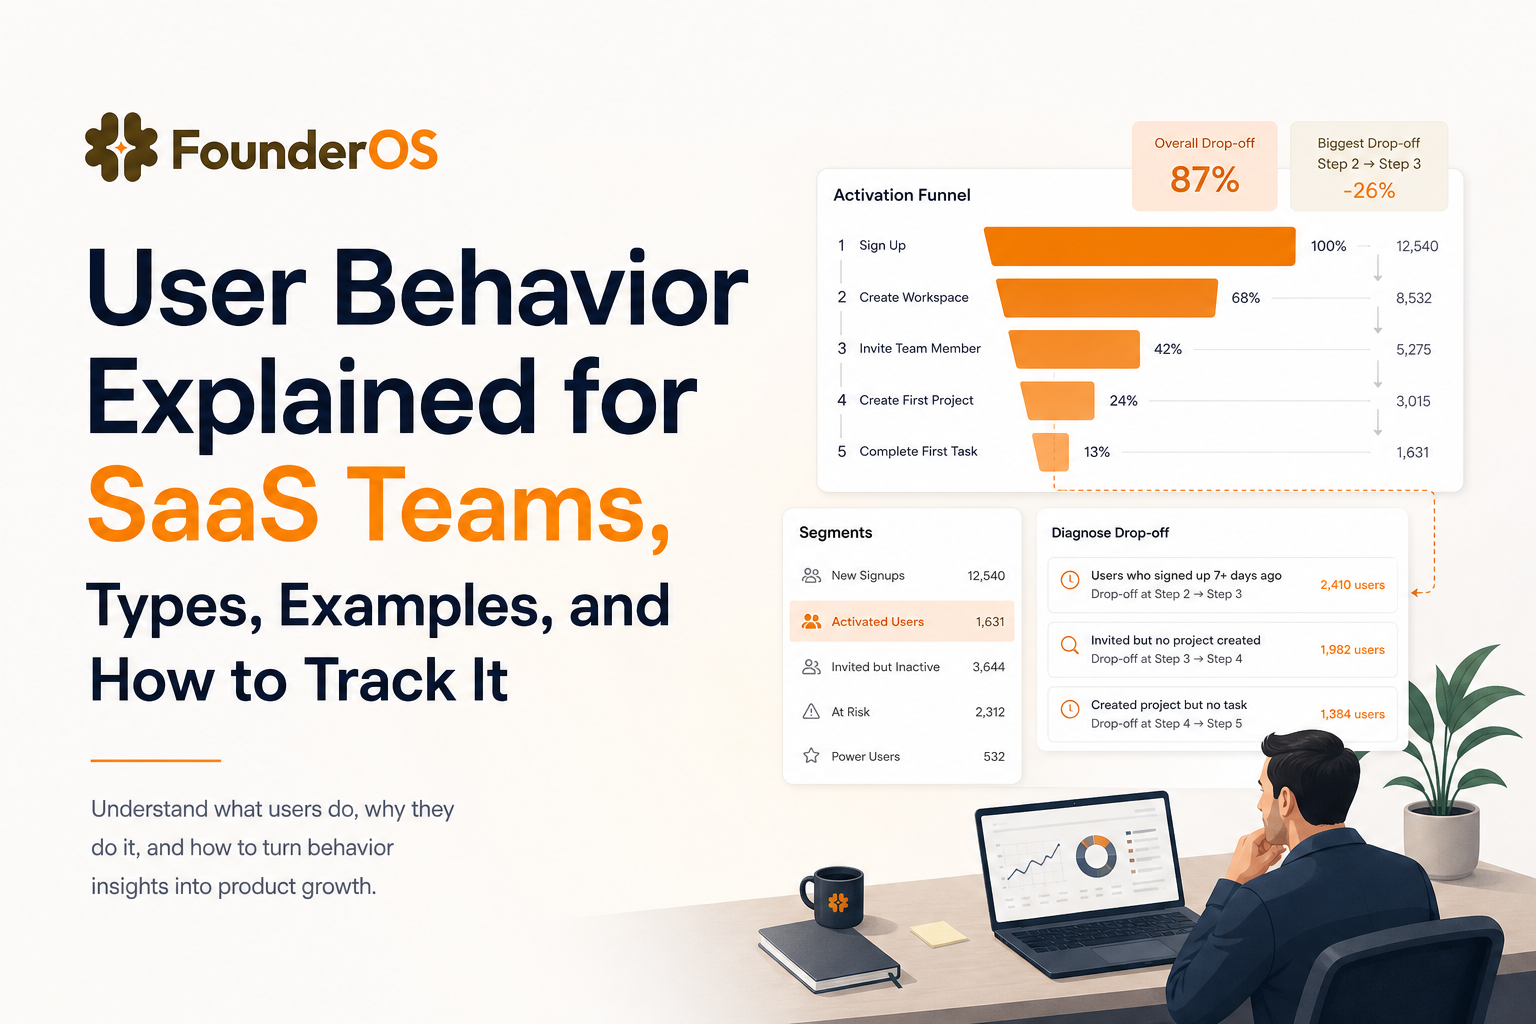
1) Define an activation funnel with explicit event steps
Activation definition (example): a new account is “activated” when it completes these steps within 24 hours:
- signup_completed
- workspace_created
- integration_connected (or data_imported)
- first_report_run (or core_action_completed)
Funnel readout: measure conversion at each step and time-to-step. A typical pattern is a sharp drop between workspace_created and integration_connected, which usually means setup friction.
2) Segment the drop-off users by behavior, not just traits
Create two behavioral segments:
- Fast activators: reached first_report_run in under 30 minutes.
- Stalled after workspace: completed workspace_created but did not reach integration_connected within 24 hours.
Then compare their event paths in the first session:
- Do stalled users view help docs or pricing more?
- Do they trigger error_shown events?
- Do they loop between settings and integrations?
If you want to go deeper on building behavioral cohorts that actually drive decisions, the user segmentation framework is a good next step.
3) Add a retention view to validate the activation definition
Check whether activated accounts retain better. A simple approach:
- Cohort: users who signed up in the same week.
- Return event: report_run (or your core value event).
- Retention window: week 1 and week 4.
If users who hit first_report_run have meaningfully higher week-4 retention, your activation definition is likely valid. If not, your “activation event” might be too shallow.
4) Turn the behavior insight into a product decision and test
Example diagnosis from user behavior data:
- Stalled users trigger error_shown with error_code=auth_failed during integration setup.
- They visit help_article_viewed for “permissions” and “API key” twice as often as fast activators.
Decision:
- Fix: rewrite the integration step with clearer prerequisites, add inline validation, and provide a “test connection” action before saving.
- Experiment: A/B the new setup flow; success metric is integration_connected rate and time-to-first_report_run.
The Core User Behavior Metrics That Matter and When to Use Each Analysis
Metrics are only useful when they map to a behavior type and a decision. Below is a practical menu we use to avoid drowning in dashboards.
Behavior to analysis mapping (use this as a checklist)
| Question you need to answer | Best analysis | Primary metric | Common pitfall |
|---|---|---|---|
| Where do users drop off? | Funnel | Step conversion rate, time-to-step | Steps not tied to value |
| Do users come back? | Cohort retention | Week-1, week-4 retention on a core event | Using “login” as the return event |
| Which behaviors predict retention? | Segment comparison | Lift in retention for users with behavior X | Confusing correlation with causation |
| Are key features adopted? | Feature usage | % of active users using feature, frequency | Counting total events instead of users |
| Who is at risk? | Recency and frequency model | Days since last core event, failure rate | Alerting on every dip without thresholds |
Simple benchmarks that keep you honest
- Activation rate: track weekly, but always alongside time-to-activation. A flat activation rate with improving time-to-activation can still be a win.
- Core event retention: define one core event that indicates value (not “session_start”).
- Feature adoption: measure per user or per account; totals hide concentration in a few power users.
For teams selecting software to support these analyses, start with criteria (identity model, event governance, funnels, cohorts, segmentation) and then evaluate user behavior analytics tools against that list.
Turn Behavior Signals Into Improvements, The Quant to Qual Loop
Event data tells you what happened. To learn why, you need a tight loop from quant signals to qualitative evidence, then back to validation.
A 6-step workflow you can run every two weeks
- Pick one behavior problem: “Drop-off at integration_connected.”
- Isolate the segment: users who reached step 2 but not step 3 within 24 hours.
- Inspect paths: top 5 preceding events, error rates, and help content views.
- Collect qual evidence: session replays, a 1-question in-app survey, and 5 short interviews with the drop-off segment.
- Write hypotheses: “Users lack permissions” or “Copy is unclear about API key scope.”
- Validate with an experiment: A/B onboarding, measure step conversion and time-to-value.
Make the loop concrete with triggers
Instead of generic onboarding, use behavior-based triggers:
- If a user hits error_shown twice in setup, show a contextual checklist.
- If a user views pricing during onboarding, surface plan limits relevant to the current step.
- If a user stalls for 10 minutes on a screen, offer a short “how-to” prompt.
After running 12 onboarding experiments across different products, the pattern was clear: interventions tied to a specific behavior (stall, error, repeat view) outperform time-based nudges because they meet the user at the moment of friction. For implementation ideas, see behavior triggers.
FAQ about user behavior
If you want to capture cleaner user behavior data quickly and turn it into activation-focused insights, Founder OS combines event tracking, user profiles, segmentation, and funnel analysis so you can move from “we think” to “we know” with less overhead.
Written by Ivy Tran
Founder of FounderOS, sharing practical insights on SaaS growth, product analytics, and user activation.
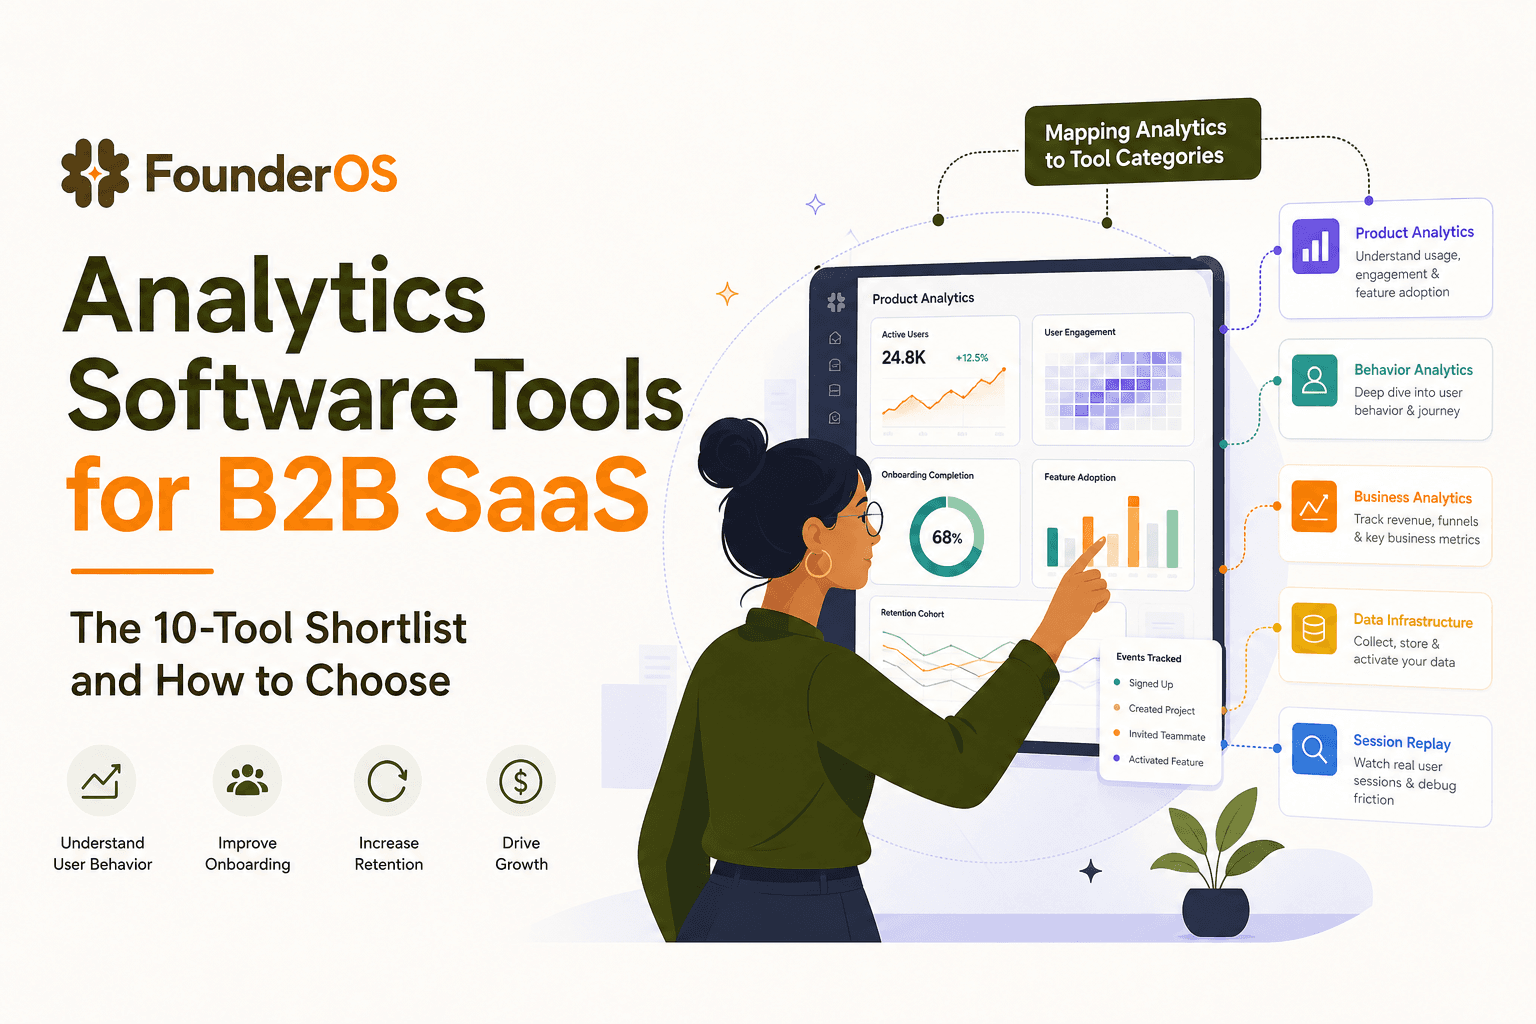
Analytics Software Tools for B2B SaaS - The 10-Tool Shortlist and How to Choose
A BOFU-ready shortlist of analytics software tools for B2B SaaS: 10 picks across categories plus a buyer rubric and rollout plan.

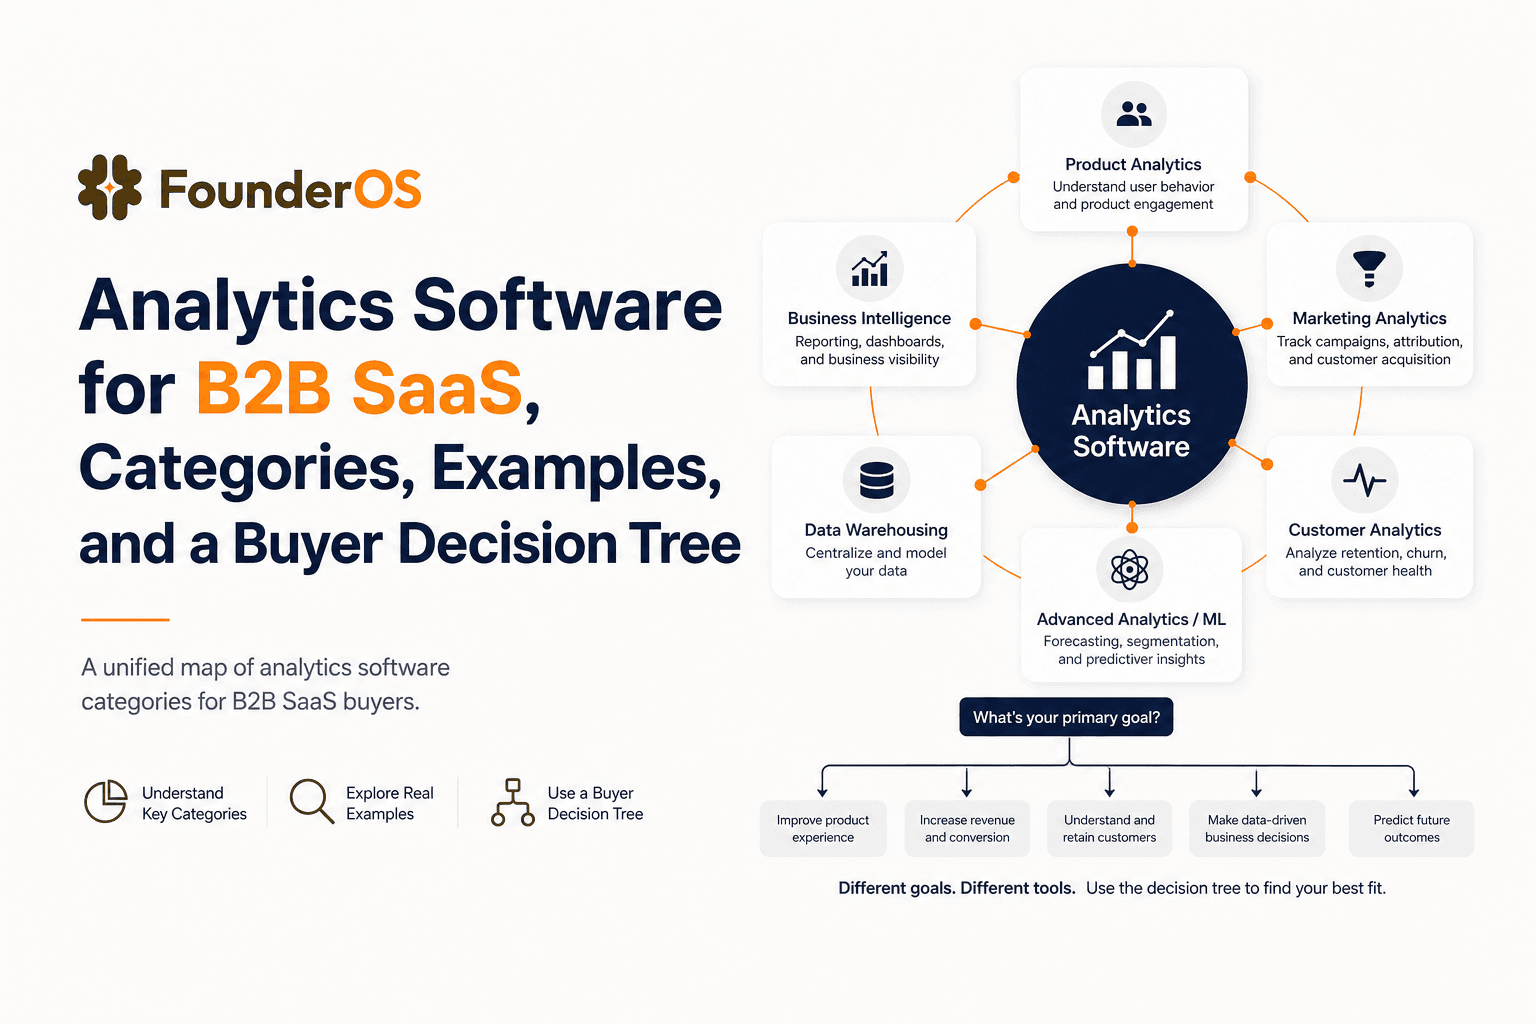
Analytics Software for B2B SaaS, Categories, Examples, and a Buyer Decision Tree
Choose analytics software for B2B SaaS with a clear category map, 10-minute decision tree, real workflows, and a practical buyer checklist.
Best Analytics Software for B2B SaaS, A Category-Based Shortlist and Buyer Checklist
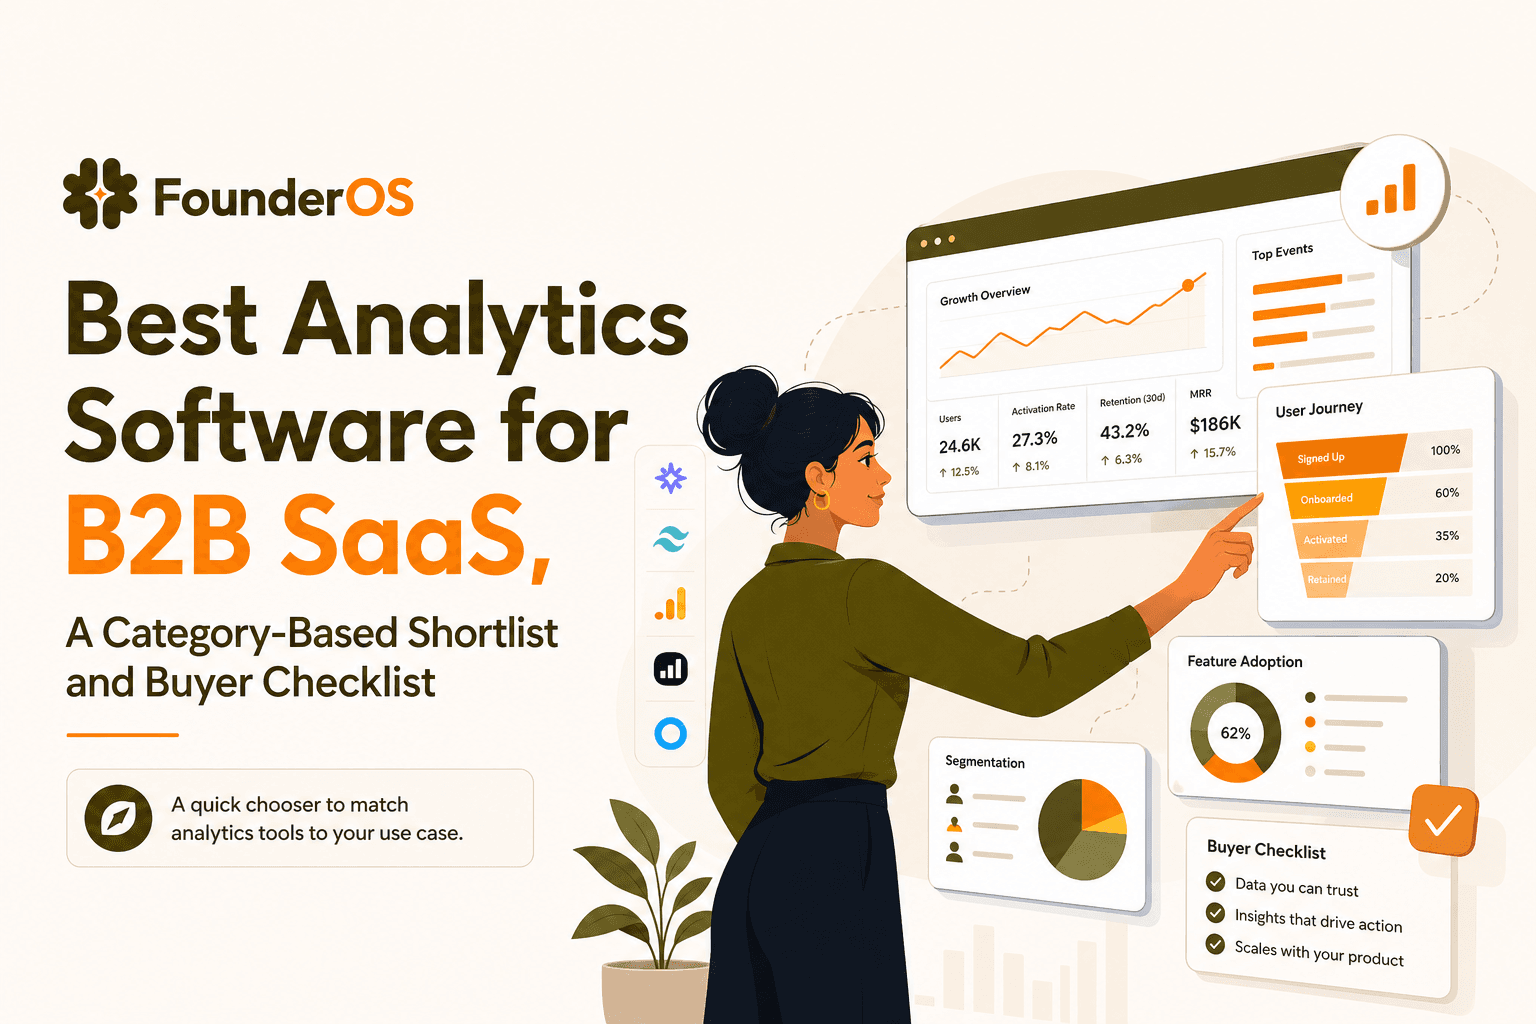
Find the best analytics software for B2B SaaS with a 1-minute chooser, category shortlists, GA4 parity checklist, and a 14-day rollout plan.