
Product Adoption Tools for B2B SaaS, The 5-Step Toolkit and 30-60-90 Day Rollout Plan
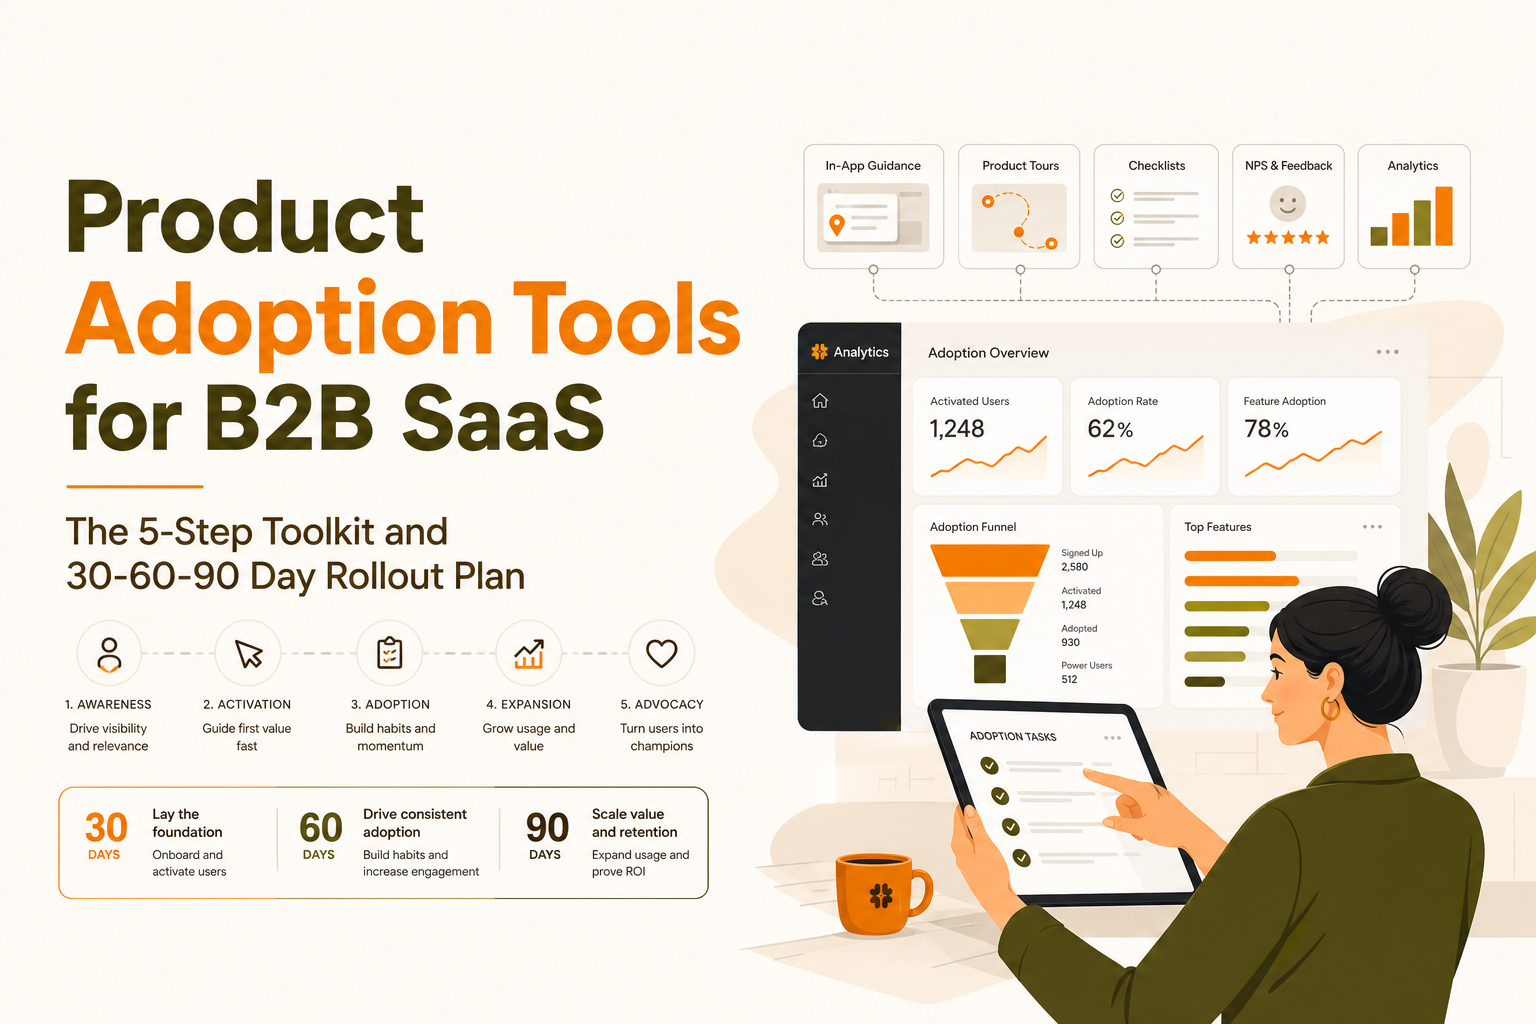
Most B2B SaaS teams buy product adoption tools hoping for higher activation, then discover they only shipped prettier tours, not measurable behavior change. The fix is to treat adoption as a toolkit problem (data + segments + in-app flows + measurement cadence), not a single widget you “turn on.”
- Adoption is a system: instrument the right events, define activation, then target in-app experiences by segment and intent.
- Use a 5-step adoption process (Instrument, Activate, Educate, Expand, Retain) to pick tools and owners, and to avoid “tour completion” vanity metrics.
- A 30-60-90 rollout plan with weekly review makes impact visible fast, even with a no-code Flow Builder.
What Counts as Product Adoption Tools, Not Just a Digital Adoption Platform
If you are buying for a SaaS product (external users), “adoption” means users repeatedly reaching value inside your app. That requires more than overlays. A practical definition: product adoption tools are the combined capabilities that (1) capture behavior, (2) turn behavior into segments and intent, (3) deliver targeted in-app guidance, and (4) measure lift against activation and retention.
Toolkit taxonomy for B2B SaaS adoption
- Product analytics: event tracking, funnels, retention, time-to-value (TTV).
- User profiles and segmentation: company, role, plan, lifecycle stage, and behavior-based segments.
- In-app experiences: tours, checklists, tooltips, modals, surveys, announcements.
- Experimentation and measurement: A/B tests (or quasi-tests), holdouts, step drop-off, impact dashboards.
- Feedback loop: in-product micro-surveys and qualitative signals tied to user context.
Decision tree: customer onboarding vs internal enablement
Many “digital adoption” platforms are optimized for internal employee training (complex apps, compliance, role-based SOPs). For B2B SaaS onboarding, prioritize a different decision tree:
- Do you need behavior-based targeting? If you cannot trigger flows based on events and attributes, you will spam everyone with the same tour.
- Can you measure impact on activation? If measurement is limited to “tour completed,” you will not know if adoption moved.
- Can you iterate without engineering? If every copy change needs a release, onboarding will lag behind product changes.
The 5-Step Product Adoption Process and the Exact Tool Types Needed at Each Step
Adoption improves when you treat it like an operating process with owners, inputs, and KPIs. Here is a 5-step model we use to keep product adoption tools aligned to outcomes, not features.
Step 1: Instrument (make behavior observable)
- Owner: Product or Data (often shared with Growth).
- Tools needed: event tracking, identity resolution, schema governance.
- KPI: event coverage for critical actions (for example, 90%+ of sessions emit the activation-relevant events).
Define “critical actions” as the smallest set of events that explain whether a user is progressing. Avoid tracking everything; it increases noise and slows decisions.
Step 2: Activate (get to first meaningful value)
- Owner: Growth or Product-led Growth lead.
- Tools needed: activation funnel, TTV measurement, in-app prompts tied to intent.
- KPI: activation rate, median TTV, and activation by segment.
Activation should be defined as an outcome event, not a UI event. “Created first project” is usually better than “clicked New.”
Step 3: Educate (feature discovery that matches jobs-to-be-done)
- Owner: Product marketing + Product.
- Tools needed: contextual tooltips, checklists, and short guides triggered by behavior.
- KPI: adoption of 1 to 3 key features correlated with retention (not total features used).
In our experience working with early-stage SaaS teams, the biggest win is removing “one-size-fits-all onboarding” and replacing it with 2 to 4 paths based on role and intent, because education becomes relevant instead of noisy.
Step 4: Expand (drive depth and breadth of usage)
- Owner: Customer Success + Growth (shared).
- Tools needed: segment-based nudges, lifecycle messaging, in-app surveys to detect blockers.
- KPI: expansion-qualified behaviors (for example, invited teammates, integrated data source, created 3+ dashboards).
Step 5: Retain (make value repeatable)
- Owner: Product + CS.
- Tools needed: retention cohorts, churn-risk segments, “rescue” flows for stalled users.
- KPI: week-4 retention (or month-2), reactivation rate, and reduction in “stalled” accounts.
Adoption Measurement Plan That Actually Works, Events, Segments, and Dashboards
The fastest way to waste money on product adoption tools is to measure the wrong thing. A workable measurement plan starts with a small event taxonomy, an activation definition per persona, and a weekly cadence that forces decisions.
1) Event taxonomy you can implement in a week
Use a three-layer taxonomy so the data stays understandable:
- Core events (10 to 20): actions that represent real value (create, publish, invite, integrate, export).
- Progress events (5 to 10): steps that predict activation (connected data source, completed setup wizard).
- Friction events (5 to 10): errors, permission blocks, failed integrations, repeated back-and-forth on the same screen.
Rule of thumb: if an event does not change a decision in a weekly review, it is not a priority event.
2) Activation funnel and TTV tracking
Define one activation funnel per primary persona. Example for a B2B SaaS with “Admin” and “Contributor” roles:
- Admin activation: created workspace → invited 1 teammate → completed first configuration → achieved first output (report/export/publish).
- Contributor activation: accepted invite → completed first task → collaborated (comment/assign) → repeated usage within 7 days.
Track median TTV (time from signup to activation) and P75 TTV (slower users), because the long tail is where support load and churn risk live.
3) Segments that make adoption actions possible
Segmentation should be actionable, not descriptive. A minimal set that works across many SaaS products:
- Lifecycle: new (0 to 7 days), onboarding (8 to 30), active, stalled (no key event in 7 to 14 days).
- Intent: based on first 1 to 3 actions (for example, visited integrations page, opened billing, created first project).
- Account context: plan tier, company size, role, and whether teammates are invited.
What surprised our team was how often “stalled” users were not inactive overall, they were active in the wrong areas. Adding a segment like “high sessions, no core event” made it obvious where to place tooltips and rescue prompts.
4) Weekly review cadence (the operating rhythm)
Keep it simple and repeatable:
- Monday: review activation rate, median TTV, and top 3 drop-off steps.
- Tuesday: pick 1 change (copy, step order, trigger condition, segment rule).
- Wednesday: ship the change in-app.
- Friday: check leading indicators (step completion, movement to next funnel step).
For deeper frameworks on targeting, see user segmentation.
No-Code Flow Builder Implementation, Tours, Checklists, Tooltips, and Announcements
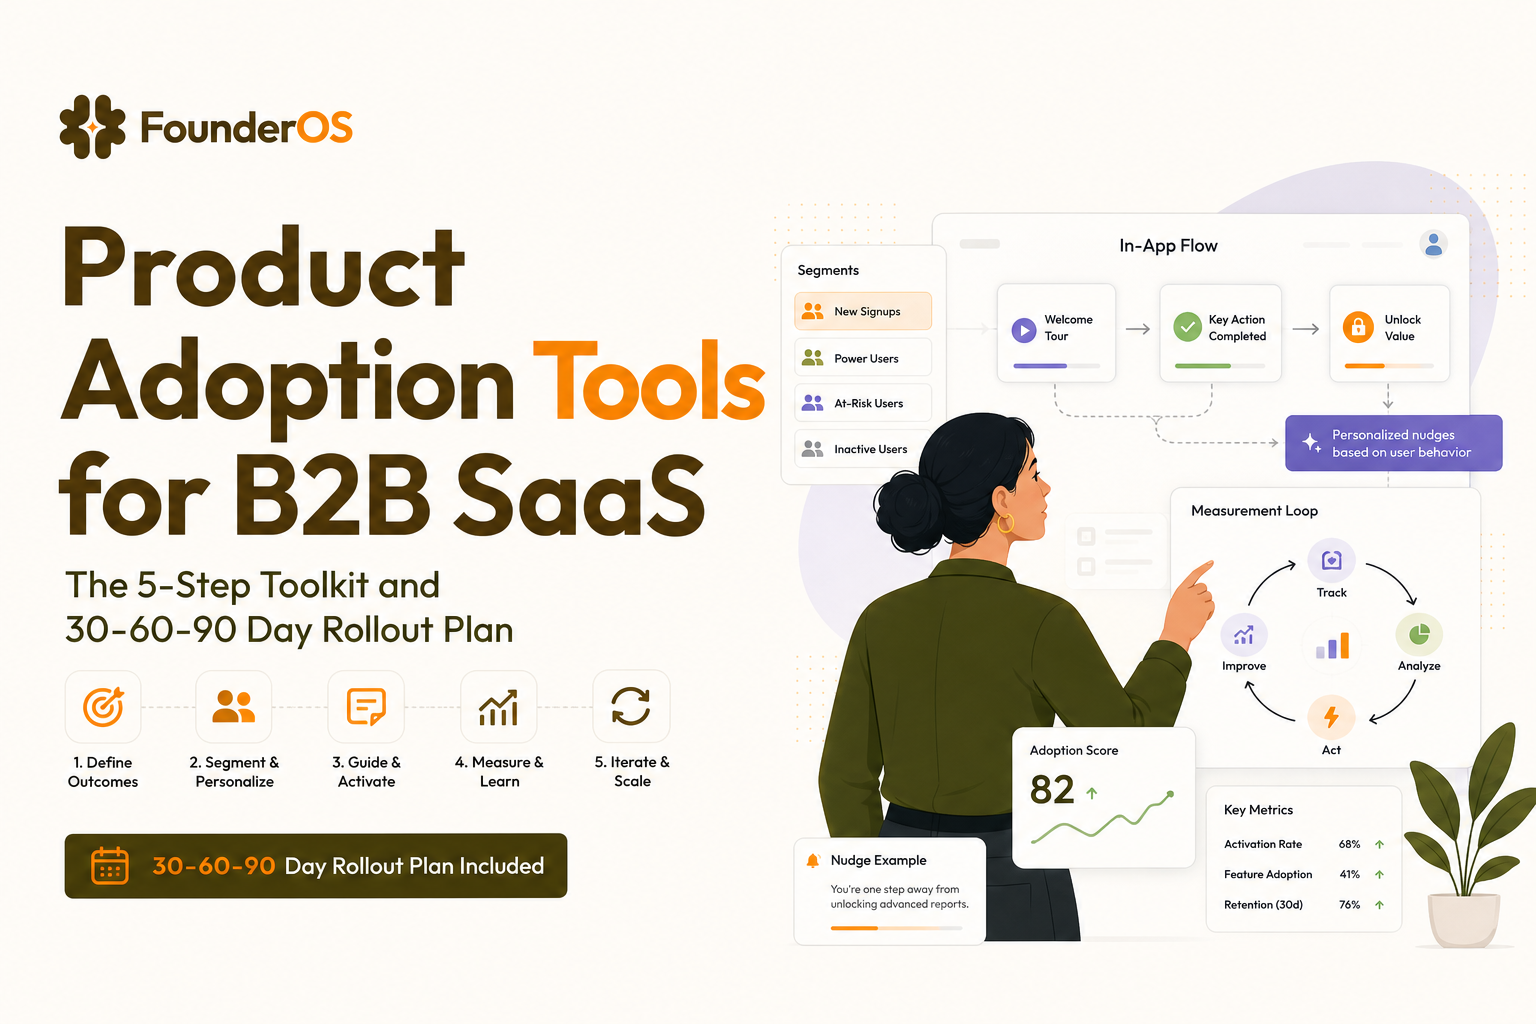
This is where product adoption tools either become a growth lever or a “nice-to-have.” The implementation sequence matters because targeting and measurement should be defined before you build UI prompts.
End-to-end build sequence (from segment to impact)
- Pick one activation moment: the first “aha” action you want more users to reach.
- Define the segment: who needs help, and who should not be interrupted (for example, exclude already-activated users).
- Choose the in-app format by friction type:
- Tooltip for “I did not notice this feature.”
- Speech bubble for “I need a step-by-step next action.”
- Checklist for multi-step setup that spans sessions.
- Modal for announcements or mandatory changes.
- Survey when you need the reason, not another nudge.
- Set triggers and conditions: URL + role + behavior (example: show only if user visited /dashboard twice and has not connected an integration).
- Publish and measure: completion, step drop-off, and most importantly activation lift versus baseline.
Concrete example: rescuing a stalled onboarding flow
Suppose your funnel shows a big drop between “created workspace” and “invited teammate.” Build:
- Segment: created workspace AND no invite sent within 24 hours.
- Trigger: next visit to /dashboard.
- Flow: a speech bubble anchored to “Invite” with one sentence of value, then a tooltip on role selection, then a checklist item that completes only when Invite Sent event fires.
- Measurement: compare invite rate within 48 hours for users who saw the flow vs those who did not (holdout if possible).
After running a few onboarding audits, the pattern was clear: checklists work best when every item is tied to an event, otherwise teams end up “checking boxes” without changing behavior. If you want a checklist structure that adapts to behavior, reference this onboarding checklist guide.
Where Founder OS fits (without re-architecting your stack)
If you want one place to build flows and measure their impact, Founder OS combines no-code onboarding flows with product tracking, user profile tracking, and segmentation, so you can set triggers (URL, attributes, behavior) and then see completion and drop-off by step. That combination is useful when your team wants to iterate onboarding without waiting on releases.
How to Choose the Right Stack, A Weighted Scorecard Tied to Activation and Retention
Feature checklists are how teams end up with overlapping tools and unclear ownership. A weighted scorecard forces the conversation back to outcomes, which is the whole point of product adoption tools.
A practical weighted rubric (100 points)
- Targeting depth (25): event-based triggers, attribute rules, AND/OR logic, exclusions, frequency caps.
- Measurement quality (25): funnels, cohorts, step drop-off, impact dashboards, exportability.
- Build speed (15): no-code builder, preview, publish without deploys, rollback.
- Data integrity (15): identity stitching, schema governance, reliable event delivery.
- Collaboration and governance (10): roles, approvals, audit logs.
- Total cost of ownership (10): pricing clarity, implementation effort, maintenance.
RFP-ready criteria you can paste into procurement
- “Show how you define and report activation lift for an in-app flow beyond completion rate.”
- “Demonstrate behavior-based targeting using event conditions and user attributes with exclusions.”
- “Provide a sample step drop-off report and how it ties to a funnel.”
- “Explain how segments are built, updated, and audited over time.”
To pressure-test whether you need a single suite or a modular stack, this product adoption platform buyer guide can help you validate quickly.
30-60-90 Day Rollout Plan and What to Expect on Pricing, Effort, and Time-to-Value
A rollout plan should produce measurable movement by day 30, not just “we installed the script.” Below is a timeline we use to operationalize product adoption tools with clear milestones.
Days 1 to 30: baseline, activation definition, first flow shipped
- Milestone: activation event and funnel defined per persona.
- Milestone: core event taxonomy implemented (10 to 20 events).
- Milestone: 1 targeted in-app flow shipped to fix the biggest drop-off step.
- Expected TTV: you should see leading indicators within 1 week of shipping (step completion, next-step progression).
Days 31 to 60: segmentation, 2 to 3 onboarding paths, measurement cadence
- Milestone: lifecycle and intent segments live (new, onboarding, stalled; plus 2 to 3 intent segments).
- Milestone: 2 to 3 onboarding paths (Admin vs Contributor, or by use case).
- Milestone: weekly review cadence established with a single “adoption dashboard.”
- Expected outcome: measurable activation lift against baseline for at least one segment.
Days 61 to 90: expand and retain loops, scale governance, upgrade triggers
- Milestone: rescue flows for stalled users and prompts for expansion behaviors (invite, integrate, repeat usage).
- Milestone: governance in place (naming conventions, approval process, frequency caps).
- Upgrade triggers: you are ready to pay more when (a) multiple teams need access, (b) segmentation and targeting complexity increases, (c) you need stronger reporting and exports, or (d) onboarding becomes a weekly operating function.
Effort and resourcing expectations
- Typical team: 1 product or growth owner (2 to 4 hours/week), 1 engineer for initial instrumentation (front-loaded), optional CS input for friction hotspots.
- Time-to-value: fastest wins come from fixing one high-friction activation step, not from building a “perfect” full tour.
| Workstream | What you ship | What you measure | Common failure mode |
|---|---|---|---|
| Instrumentation | 10 to 20 core events + identity | Activation funnel, median and P75 TTV | Tracking everything, learning nothing |
| Segmentation | Lifecycle + intent segments | Activation by segment | Segments that describe, not act |
| In-app flows | Tooltips, checklists, tours, modals | Step drop-off, next-step progression | Optimizing completion rate only |
| Operating cadence | Weekly review + 1 change shipped/week | Lift vs baseline, stalled user rate | Monthly reviews that come too late |
FAQ
If you want a single place to build targeted onboarding flows and measure their impact without engineering-heavy releases, Founder OS is designed to combine no-code in-app guidance with tracking and segmentation so you can iterate toward activation faster. Explore Founder OS when you are ready to turn onboarding into a weekly, measurable growth loop.
Written by Ivy Tran
Founder of FounderOS, sharing practical insights on SaaS growth, product analytics, and user activation.
Analytics Software Tools for B2B SaaS - The 10-Tool Shortlist and How to Choose
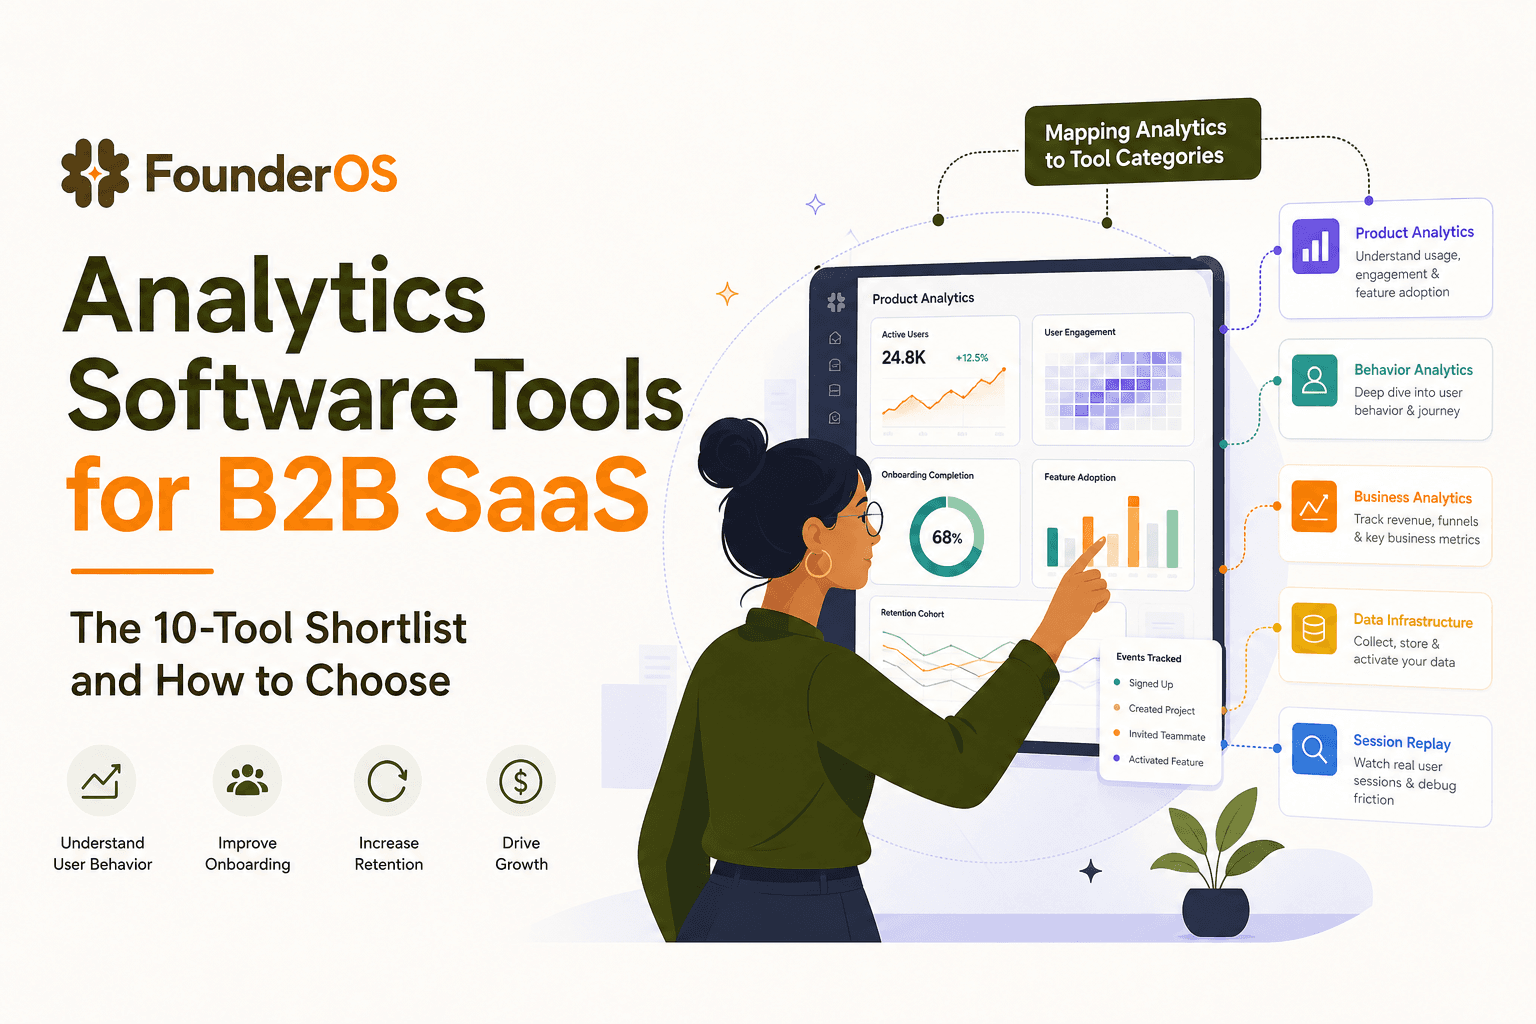
A BOFU-ready shortlist of analytics software tools for B2B SaaS: 10 picks across categories plus a buyer rubric and rollout plan.

Analytics Software for B2B SaaS, Categories, Examples, and a Buyer Decision Tree
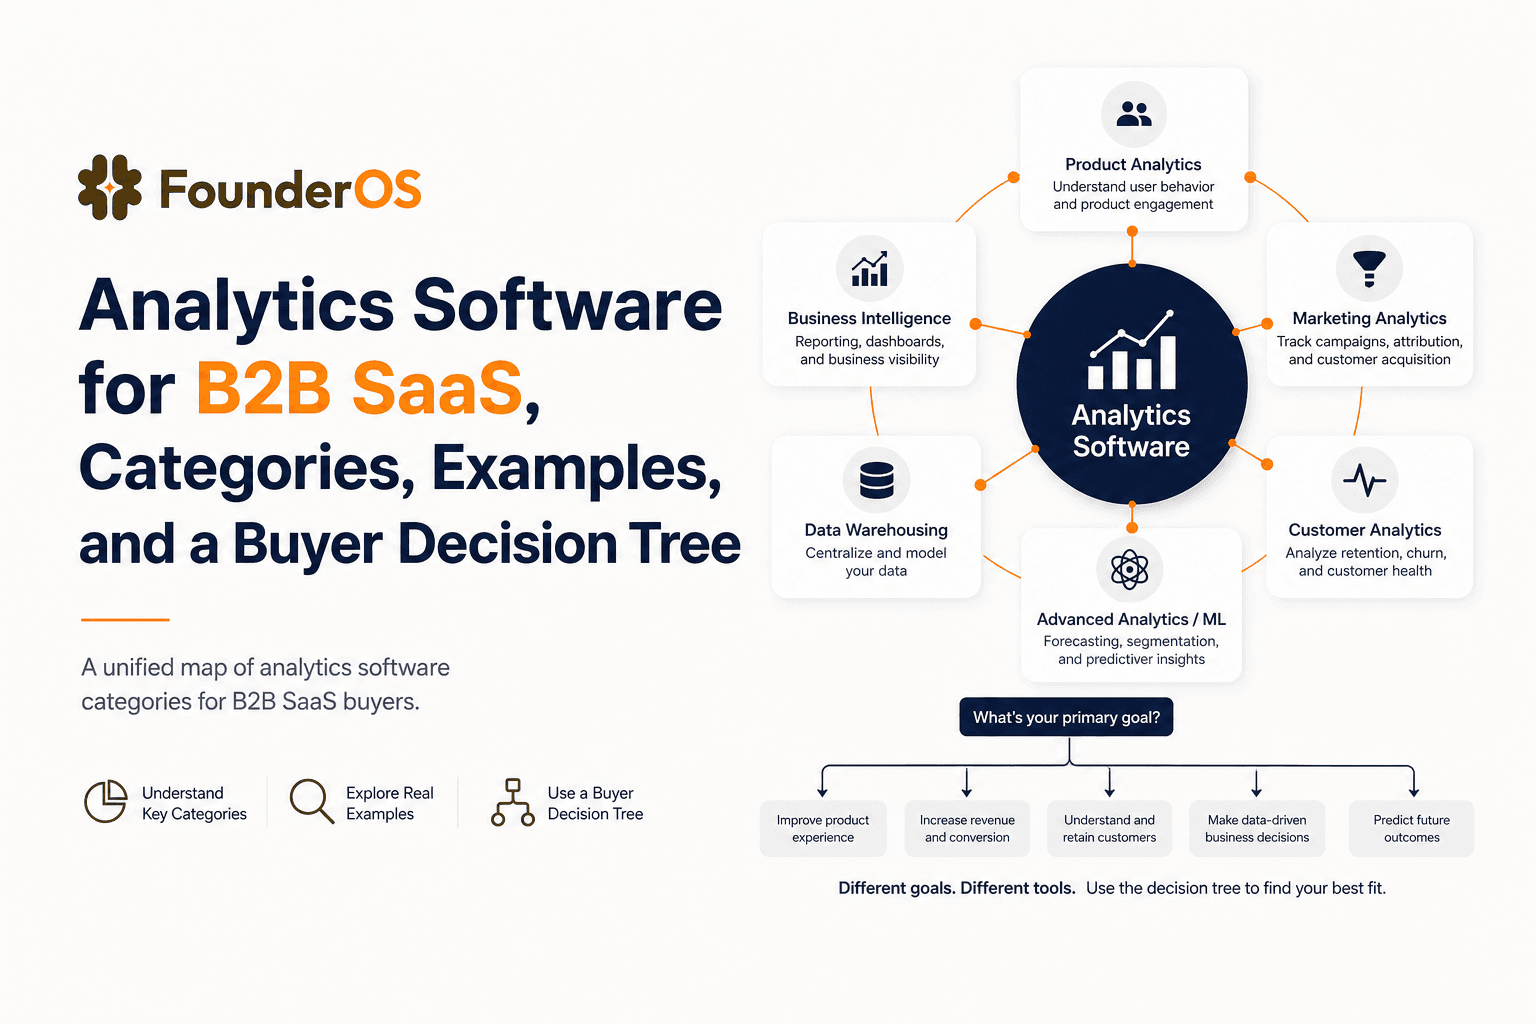
Choose analytics software for B2B SaaS with a clear category map, 10-minute decision tree, real workflows, and a practical buyer checklist.
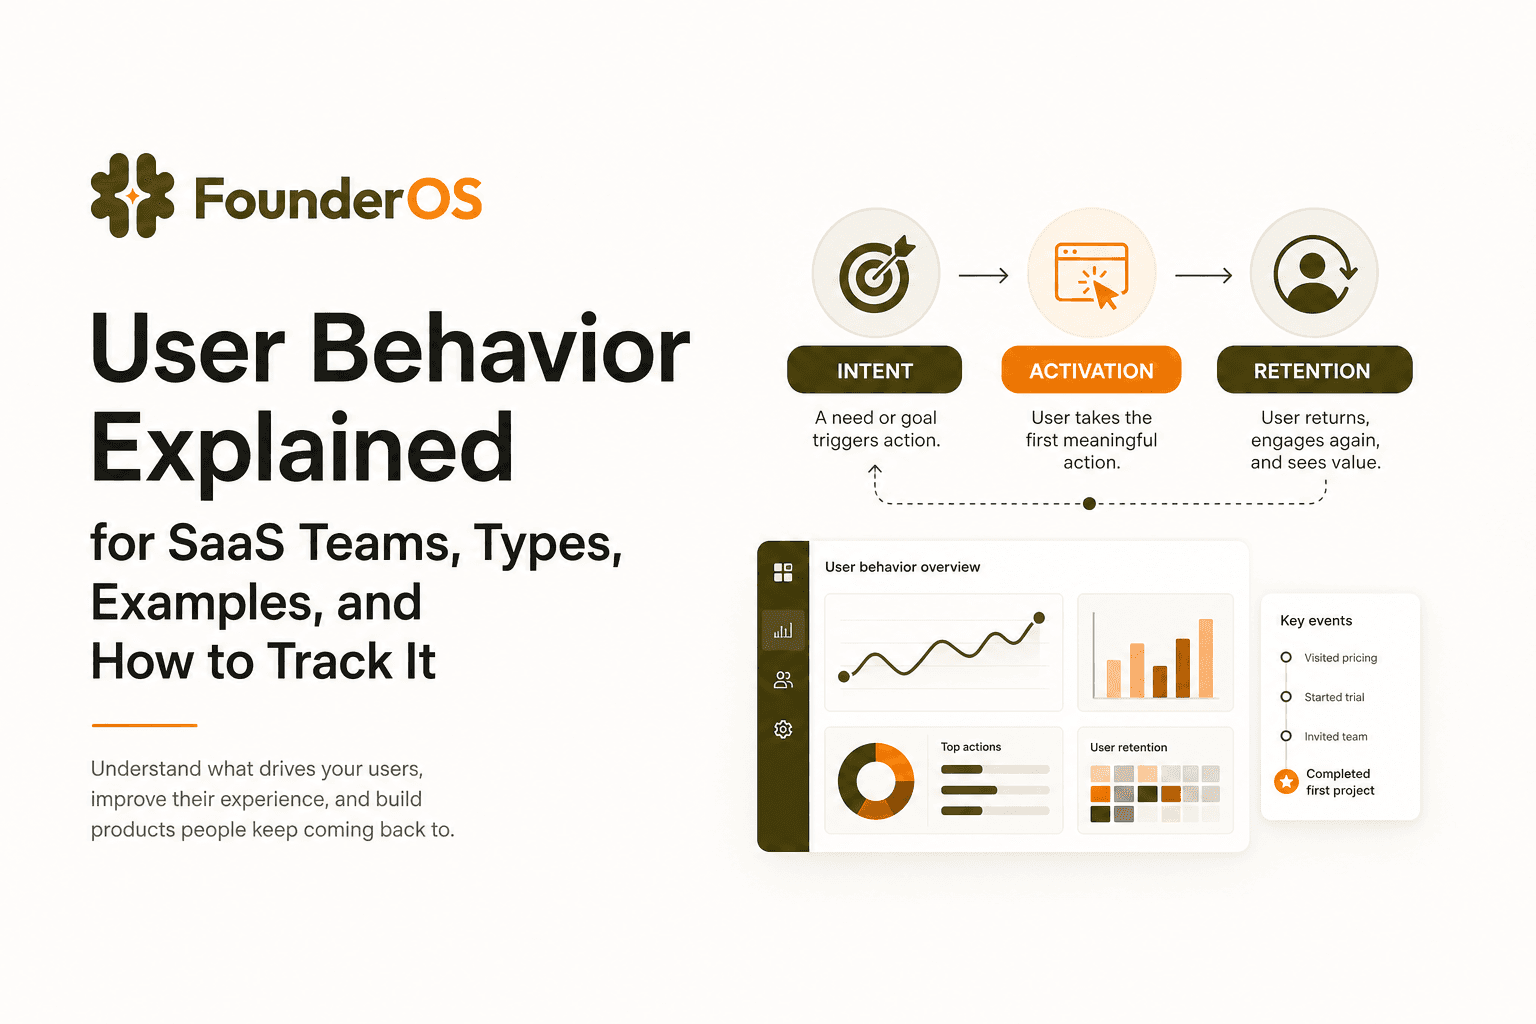
User Behavior Explained for SaaS Teams, Types, Examples, and How to Track It
Learn what user behavior means in SaaS, the key types, and a practical event tracking playbook to turn user behavior into product decisions.