
Best Analytics Software for B2B SaaS, A Category-Based Shortlist and Buyer Checklist
Choosing the best analytics software gets confusing fast because “analytics” can mean website traffic, in-app product events, BI dashboards, or heavy data processing, and each category has different switching costs and success metrics.
- Pick your category first (web, product, BI, data analysis, data engineering) so you do not compare tools that solve different jobs.
- For B2B SaaS, prioritize event tracking, identity resolution, funnel analysis, segmentation, and a clean path from product usage to revenue outcomes.
- Use a 7 to 14 day implementation plan and a GA4 parity checklist to avoid rework, missing events, and stakeholder surprises.
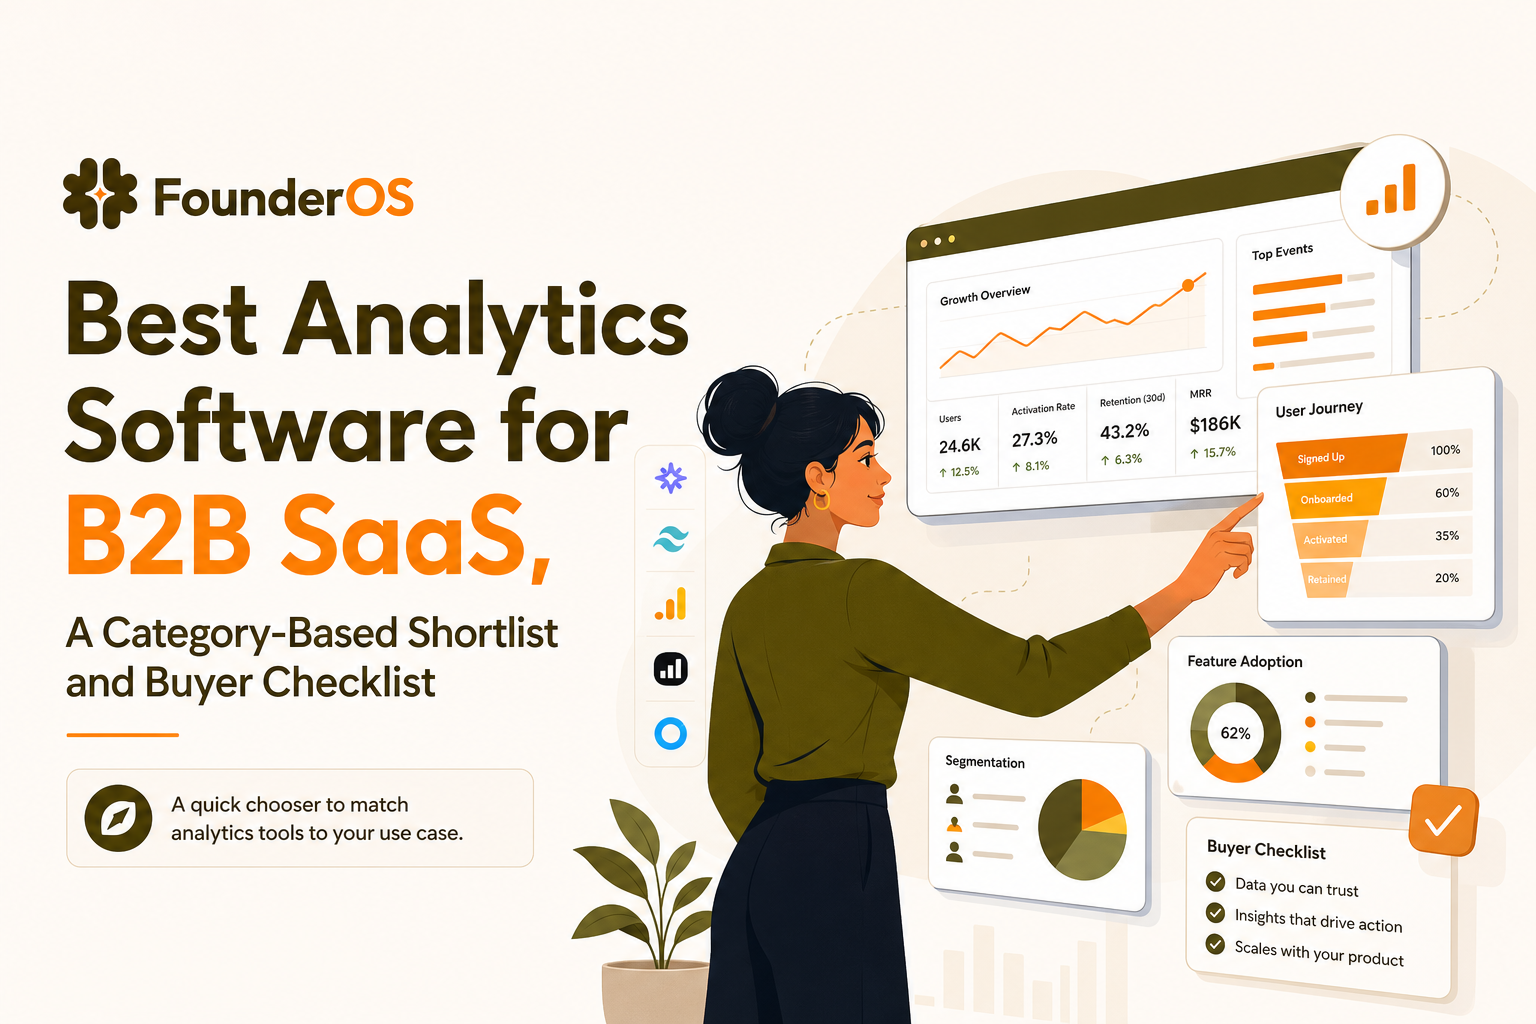
A 1-minute chooser to find the best analytics software for your use case
Step 1: Identify the “object” you need to measure
- Website behavior: sessions, landing pages, SEO, paid campaigns, content performance.
- Product behavior: user events (clicks, feature usage), activation, retention, conversion funnels.
- Business performance: revenue, pipeline, cohorts by plan, CAC payback, expansion.
- Data processing: joining many sources, modeling, governance, large-scale transformations.
Step 2: Choose the category that matches the job
- Web analytics if your primary question is “How do people find and use our marketing site?”
- Product analytics if your primary question is “What do users do inside the app, and where do they drop off?”
- BI if your primary question is “What is happening to revenue and operations across systems?”
- Data analysis notebooks if your primary question is “What do we learn from ad hoc exploration and statistical analysis?”
- Data engineering if your primary question is “How do we move, clean, and model data reliably?”
Step 3: Start with a stack, not a single tool
Most B2B SaaS teams end up with a small stack because no single tool is the best analytics software for every job. A practical default is:
- Web analytics + product analytics + BI (optional) + data pipeline (only when you outgrow native integrations).
Quick recommendations by scenario
- You are optimizing acquisition: Web analytics + lightweight BI for channel ROI.
- You are optimizing activation and retention: Product analytics with event tracking, funnels, cohorts, and segmentation. Add BI later for finance-grade reporting.
- You have multiple products or data sources: Product analytics + BI + data engineering to unify identities and definitions.
Best analytics software by category, shortlists with best-for, limits, and pricing signals
How this shortlist is organized
To keep comparisons fair, each tool is listed in the category it is designed for. If you try to force one category to do another job, you usually pay in accuracy (mis-attribution), speed (slow queries), or adoption (teams stop trusting the dashboards).
Web analytics shortlist
- Google Analytics 4: best for free baseline web reporting and broad ecosystem support; limits include sampling/thresholding behaviors and privacy constraints depending on configuration.
- Plausible: best for privacy-forward, simpler web analytics; limits include less granular user journey analysis compared to product analytics.
- Matomo: best for ownership and on-prem options; limits include more operational overhead if self-hosted.
Product analytics shortlist (event-based)
- Mixpanel: best for mature event analytics, funnels, retention, and segmentation; limits often show up as tracking plan governance and cost at high event volumes.
- Amplitude: best for deep product analytics workflows and experimentation ecosystems; limits are similar: cost and implementation discipline.
- Founder OS: best for B2B SaaS teams that want product event tracking plus GTM reporting in one platform; limits to validate are coverage of your data warehouse needs if you require complex modeling.
BI and dashboards shortlist
- Looker: best for governed metrics and semantic modeling; limits include setup time and the need for data modeling skills.
- Power BI: best for Microsoft-centric orgs and cost-effective reporting; limits include cross-tool consistency if product events live elsewhere.
- Tableau: best for flexible visualization; limits include governance complexity at scale.
Data analysis shortlist (ad hoc, statistical)
- Python (pandas, Jupyter): best for custom analysis and modeling; limits include reproducibility unless you standardize workflows.
- R: best for statistical depth; limits include team skill availability.
Data engineering shortlist (pipelines and transformations)
- Fivetran: best for managed connectors; limits include connector costs at scale.
- Airbyte: best for open-source flexibility; limits include maintenance if self-hosted.
- dbt: best for transformation and metric definitions in SQL; limits include the need for a warehouse and modeling discipline.
Pricing signals you can sanity-check quickly
- Web analytics: often free or low monthly fees, pricing tied to pageviews.
- Product analytics: pricing tied to events tracked, MTUs, or both.
- BI: pricing tied to seats and compute.
- Data engineering: pricing tied to connectors, rows, or compute.
What the 4 types of analytics mean and which tools actually support each
1) Descriptive analytics (what happened)
Definition: Reporting on past activity. In SaaS, this is daily active users, signups, activation rate, and feature adoption trends.
Tools that fit: web analytics, product analytics, and BI dashboards. The best analytics software for descriptive work is the one with the lowest friction to get accurate, shared definitions.
2) Diagnostic analytics (why it happened)
Definition: Explaining drivers and drop-offs. In SaaS, this is “Where does activation break?” and “Which cohort churns after onboarding step 3?”
Tools that fit: product analytics with funnel analysis, segmentation, and user-level drilldowns; notebooks for deeper root-cause work. When we tested a “dashboard-only” approach for diagnosing activation, our team still ended up exporting data because we needed user-level paths, not just aggregate charts.
3) Predictive analytics (what will happen)
Definition: Forecasting outcomes like churn risk or expansion likelihood. In SaaS, this often means building a churn propensity model using product events, support tickets, and billing data.
Tools that fit: data analysis notebooks and BI layered on a warehouse. Some product analytics platforms offer lightweight predictive features, but you still need clean identity and consistent event definitions first.
4) Prescriptive analytics (what should we do next)
Definition: Recommending actions, not just insights. In SaaS, that could be “Trigger an onboarding checklist when a user hits X but not Y within 24 hours.”
Tools that fit: product analytics connected to engagement tooling (in-app onboarding, lifecycle messaging) plus clear segmentation rules. If your “best analytics software” cannot reliably power an action, it is just reporting.
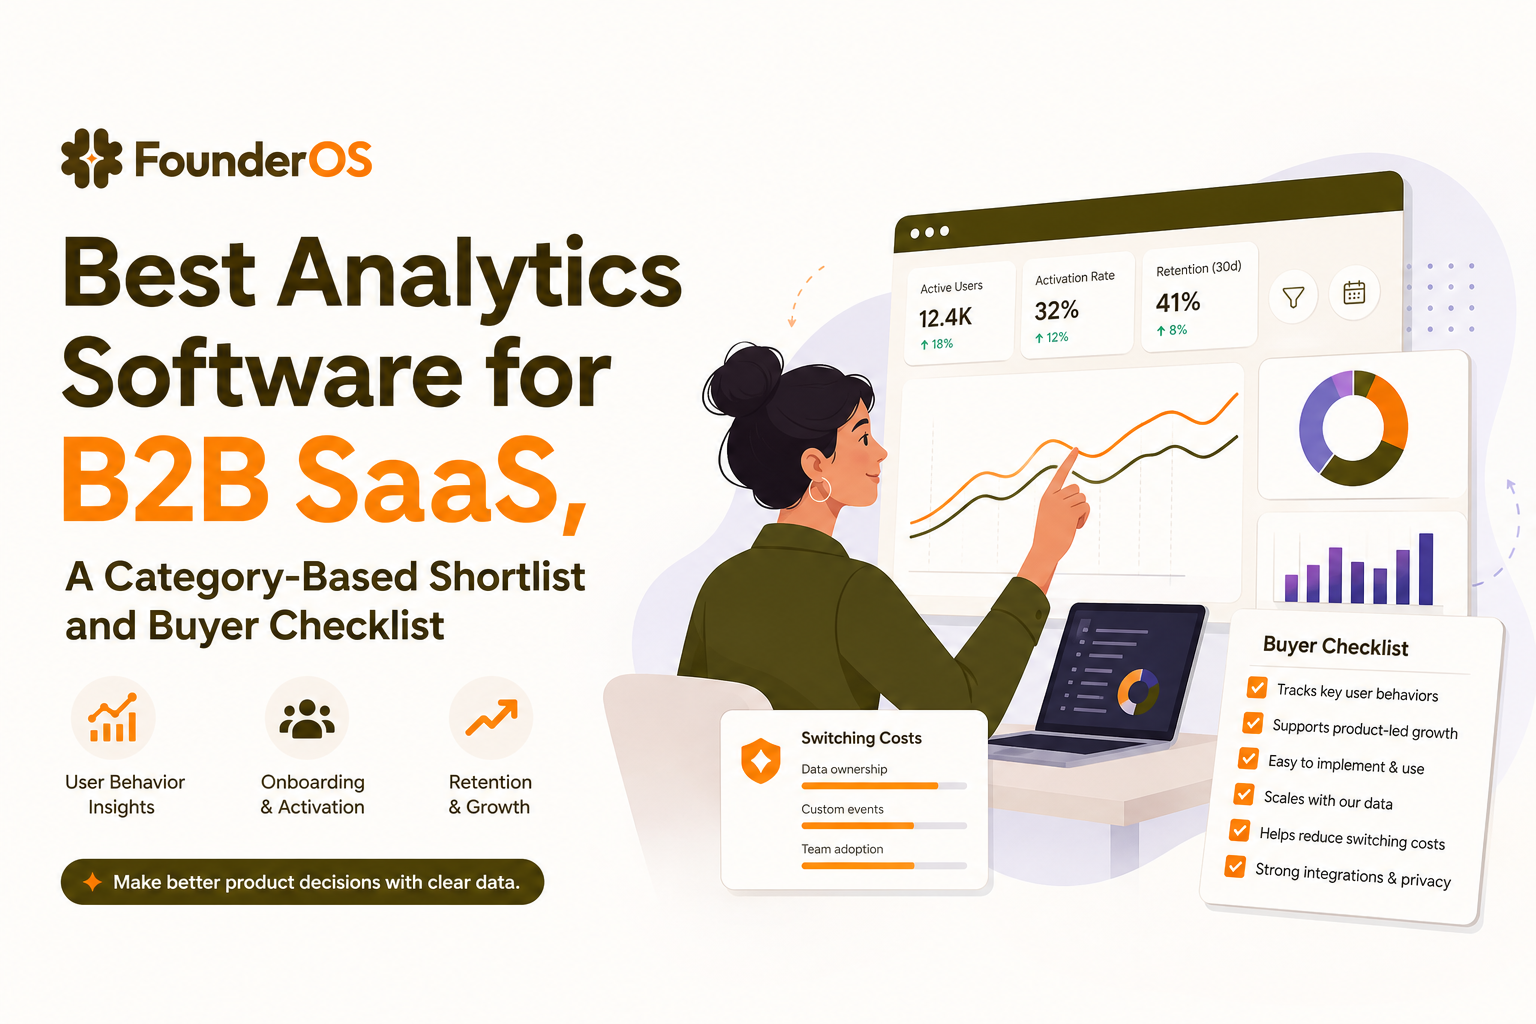
Is anything better than Google Analytics, a parity checklist and switching-cost framework
A GA4 parity checklist (use this before you migrate)
- Attribution coverage: UTM capture, referrers, cross-domain tracking.
- Identity: anonymous to known user stitching, consent mode needs.
- Data retention: how long raw or event-level data is kept.
- Sampling and thresholding: whether reporting changes under privacy thresholds.
- Exports: ability to export raw events (for audits and BI).
- Governance: roles, change logs, and auditability.
- Integrations: ad platforms, CRM, marketing automation, CDP.
A switching-cost framework that prevents “analytics regret”
Migration is not just a script. The real costs usually come from:
- Definition drift: “session,” “conversion,” and “lead” change meaning across tools.
- Historical continuity: you lose year-over-year comparability unless you dual-run.
- Tagging debt: you discover missing UTMs, broken events, or inconsistent naming.
- Stakeholder retraining: teams stop using reports if the UI and metrics change overnight.
When it is worth switching away from GA4
- Privacy or data ownership requirements push you to first-party or self-hosted options.
- You need simpler reporting for non-analysts, with fewer “gotchas.”
- Your real questions are product questions, and GA4 is being stretched into product analytics.
If your core need is in-app behavior, GA4 is rarely the best analytics software for the job; it can track events, but it is not optimized for product funnels, retention cohorts, and user-level behavioral segmentation.
How to choose for B2B SaaS, event tracking, funnels, segments, and revenue attribution
A buyer checklist for SaaS-ready product analytics
- Event tracking that matches your product: can you track clicks, page views, form submits, and key feature events without weeks of engineering?
- User profile stitching: can you tie anonymous sessions to known accounts after signup and handle multiple devices?
- Segmentation by behavior: can you build audiences based on sequences and recency, not just static traits?
- Funnel flexibility: can you build funnels from any event to any event and compare cohorts over time?
- Revenue mapping: can you connect accounts, plans, and pipeline stages to product behavior?
- Data quality controls: naming rules, duplicate detection, and visibility into live events.
- Time to first insight: can a PM answer questions in a day, not a quarter?
Concrete SaaS workflows to test in a demo
- Activation: build a funnel from “Signup” to “First key action” and identify the step with the highest drop-off. Validate you can click through to the users who dropped off.
- Feature adoption: chart adoption of your core feature in week 1, split by acquisition channel and plan.
- Retention: create cohorts by first-use date and compare retention for users who completed onboarding vs those who did not.
- Sales alignment: segment “high intent” accounts based on usage (for example, multiple users invited plus repeated use of a key feature) and see if they correlate with pipeline conversion.
Pitfalls that cause misleading decisions
- Tracking only pageviews: you miss intent signals inside workflows.
- Inconsistent event names: reporting becomes untrustworthy and teams stop using it.
- No identity strategy: you cannot connect trial usage to accounts, plans, and revenue.
In our experience working with early-stage B2B SaaS, the fastest path to reliable insights is agreeing on 10 to 20 “decision events” first, then expanding coverage once the team is using the dashboards weekly.
Founder OS as a best-fit option when you need product analytics plus GTM reporting
Where it fits in the category map
Founder OS sits in the product analytics category with an emphasis on tying product usage to go-to-market reporting. If you are evaluating the best analytics software for a SaaS product team, this matters because “activation” and “pipeline quality” often live in different tools unless you design for it.
A concrete setup path to validate fit
- Install and verify capture: confirm that page views, clicks, and form events are captured immediately, then add a few custom events for your core workflow.
- Define user and account identity: ensure events tie to a person, and that you can segment by plan, company, or lifecycle stage.
- Build one activation funnel: from signup to your first value moment, then inspect drop-offs at the user level.
- Create two behavioral segments: “new activators” and “at-risk” based on recency and key actions, and confirm they update in real time.
What surprised our team was how often “best analytics software” decisions come down to implementation speed: if the first useful funnel is not live within a day or two, teams tend to revert to spreadsheets and gut feel.
How to compare it fairly against other product analytics tools
Use the same test: can your PM build a funnel and a segment without SQL, can you drill from a chart into individual user histories, and can you connect those behaviors to GTM reporting without a separate modeling project. If you want more context on the broader category, see our guides on product analytics tools, user analytics tools, and event analytics. If you are deciding between two common incumbents, this comparison can help: amplitude vs mixpanel.
Implementation plan and final checklist to buy with confidence
A 7 to 14 day rollout plan (realistic for most SaaS teams)
- Days 1 to 2: Instrumentation audit
- List your top 3 user journeys (signup, activation, core workflow).
- Define 10 to 20 decision events with clear names and properties.
- Assign an owner for tracking governance.
- Days 3 to 5: Install and validate
- Install SDK or snippet, confirm events fire in a live stream.
- Test identity stitching: anonymous session to logged-in user.
- Backfill key properties (plan, role, account id) if available.
- Days 6 to 9: Build the first decision dashboards
- One activation funnel with cohort comparison.
- One retention view (week 1 and week 4).
- One feature adoption trend split by segment.
- Days 10 to 14: Operationalize
- Document definitions in a short tracking spec.
- Set a weekly review cadence with PM, Growth, and CS.
- Create a change process for new events and dashboards.
Stakeholders you need (and what to ask each)
- Product: confirm the “first value moment” and activation definition.
- Engineering: confirm where events should fire and how identity is handled.
- Sales and CS: confirm what “qualified usage” looks like for expansion and retention.
- Marketing: confirm UTMs and channel taxonomy.
Pre-purchase checklist that catches 80% of failures
- Can the tool answer 5 concrete questions you already have this week?
- Can you export raw events for audits and future migration?
- Does it support your privacy and retention requirements?
- Can a non-analyst build and share a funnel and a segment?
- Is pricing aligned with your growth driver (events, users, seats)?
| Category | Best for | Typical buyer test | Main switching cost |
|---|---|---|---|
| Web analytics | Traffic, landing pages, channel attribution | UTM accuracy + cross-domain tracking | Historical continuity and retraining |
| Product analytics | Activation, retention, feature adoption | Build a funnel and drill into drop-offs | Event taxonomy and identity stitching |
| BI | Revenue, finance-grade reporting, ops metrics | Single source of truth for KPIs | Data modeling and governance |
| Data analysis | Ad hoc exploration and predictive modeling | Reproduce an analysis end-to-end | Team skills and reproducibility |
| Data engineering | Pipelines, transformations, reliability | Load + transform one critical source | Maintenance and ongoing cost |
FAQ
If you are narrowing down the best analytics software for a B2B SaaS product team and you want fast event tracking, clear funnels, real-time segmentation, and reporting that connects product usage to go-to-market outcomes, Founder OS is worth shortlisting. Start with a quick install, build one activation funnel, and validate that your team can get from “question” to “decision” in the same day.
Written by Ivy Tran
Founder of FounderOS, sharing practical insights on SaaS growth, product analytics, and user activation.
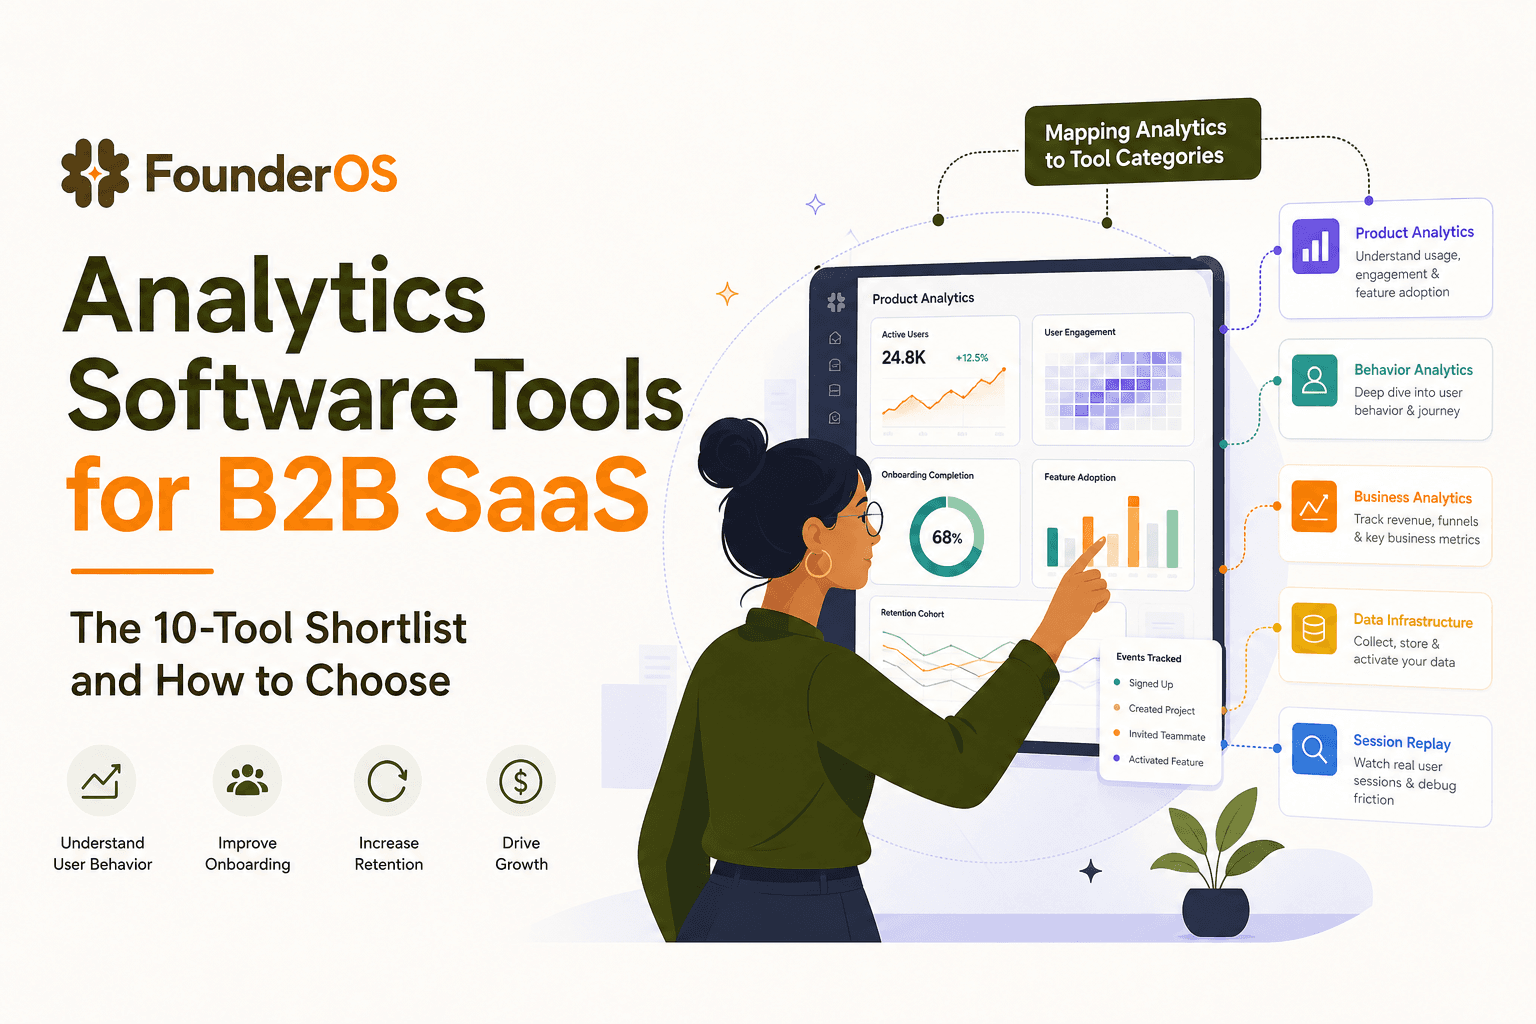
Analytics Software Tools for B2B SaaS - The 10-Tool Shortlist and How to Choose
A BOFU-ready shortlist of analytics software tools for B2B SaaS: 10 picks across categories plus a buyer rubric and rollout plan.

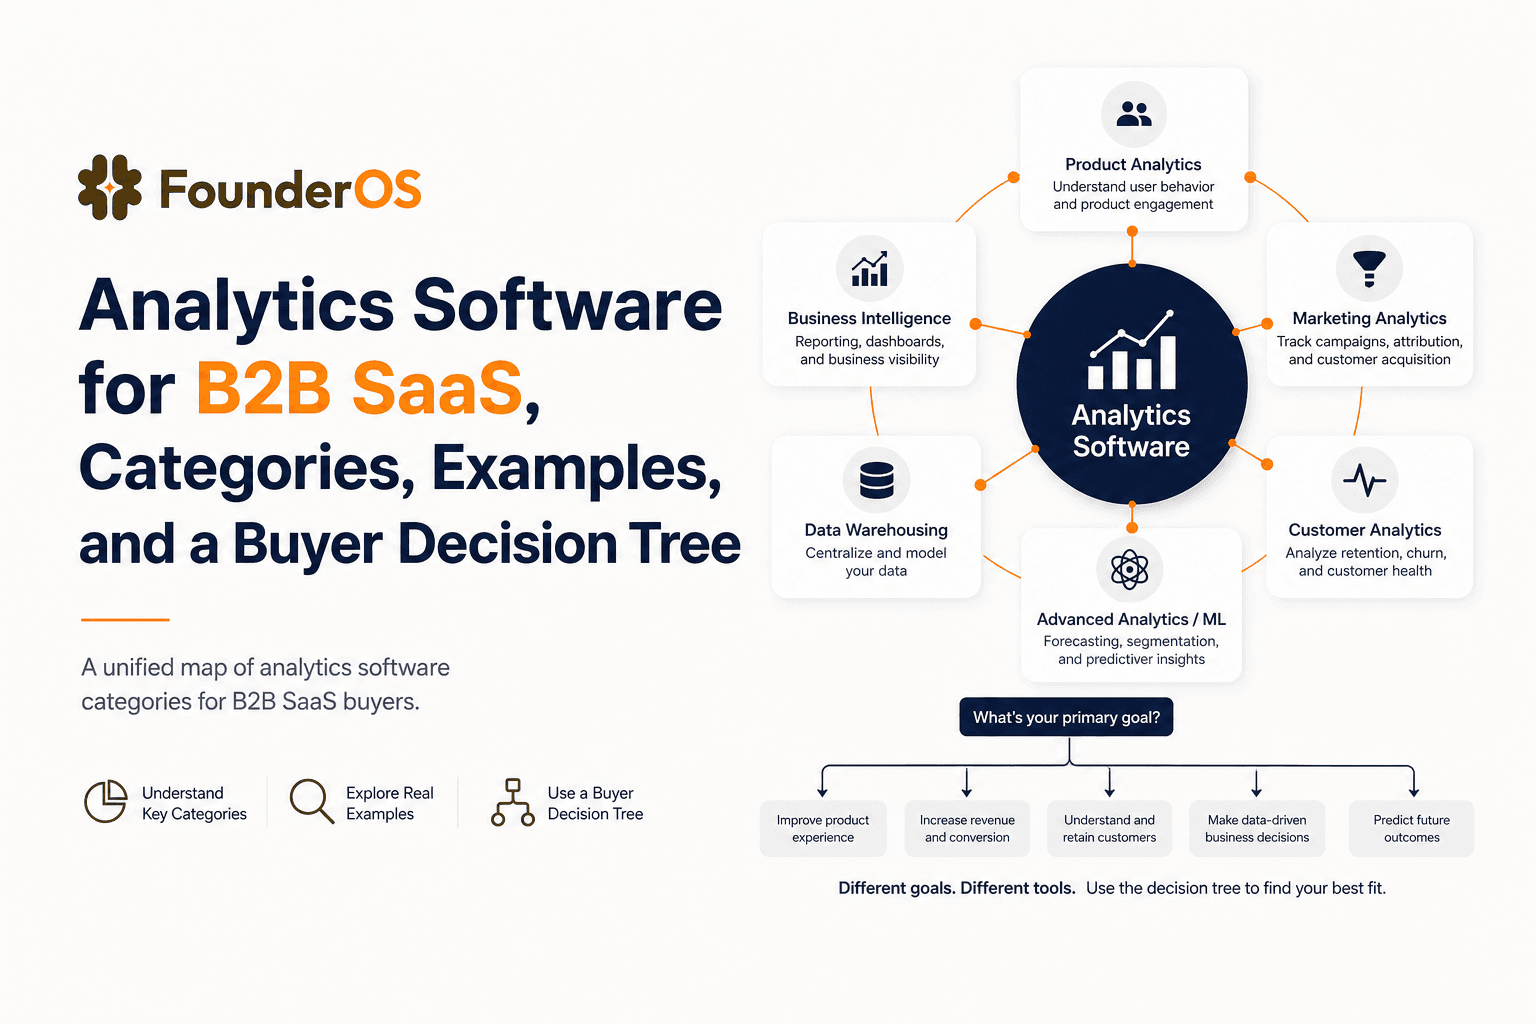
Analytics Software for B2B SaaS, Categories, Examples, and a Buyer Decision Tree
Choose analytics software for B2B SaaS with a clear category map, 10-minute decision tree, real workflows, and a practical buyer checklist.
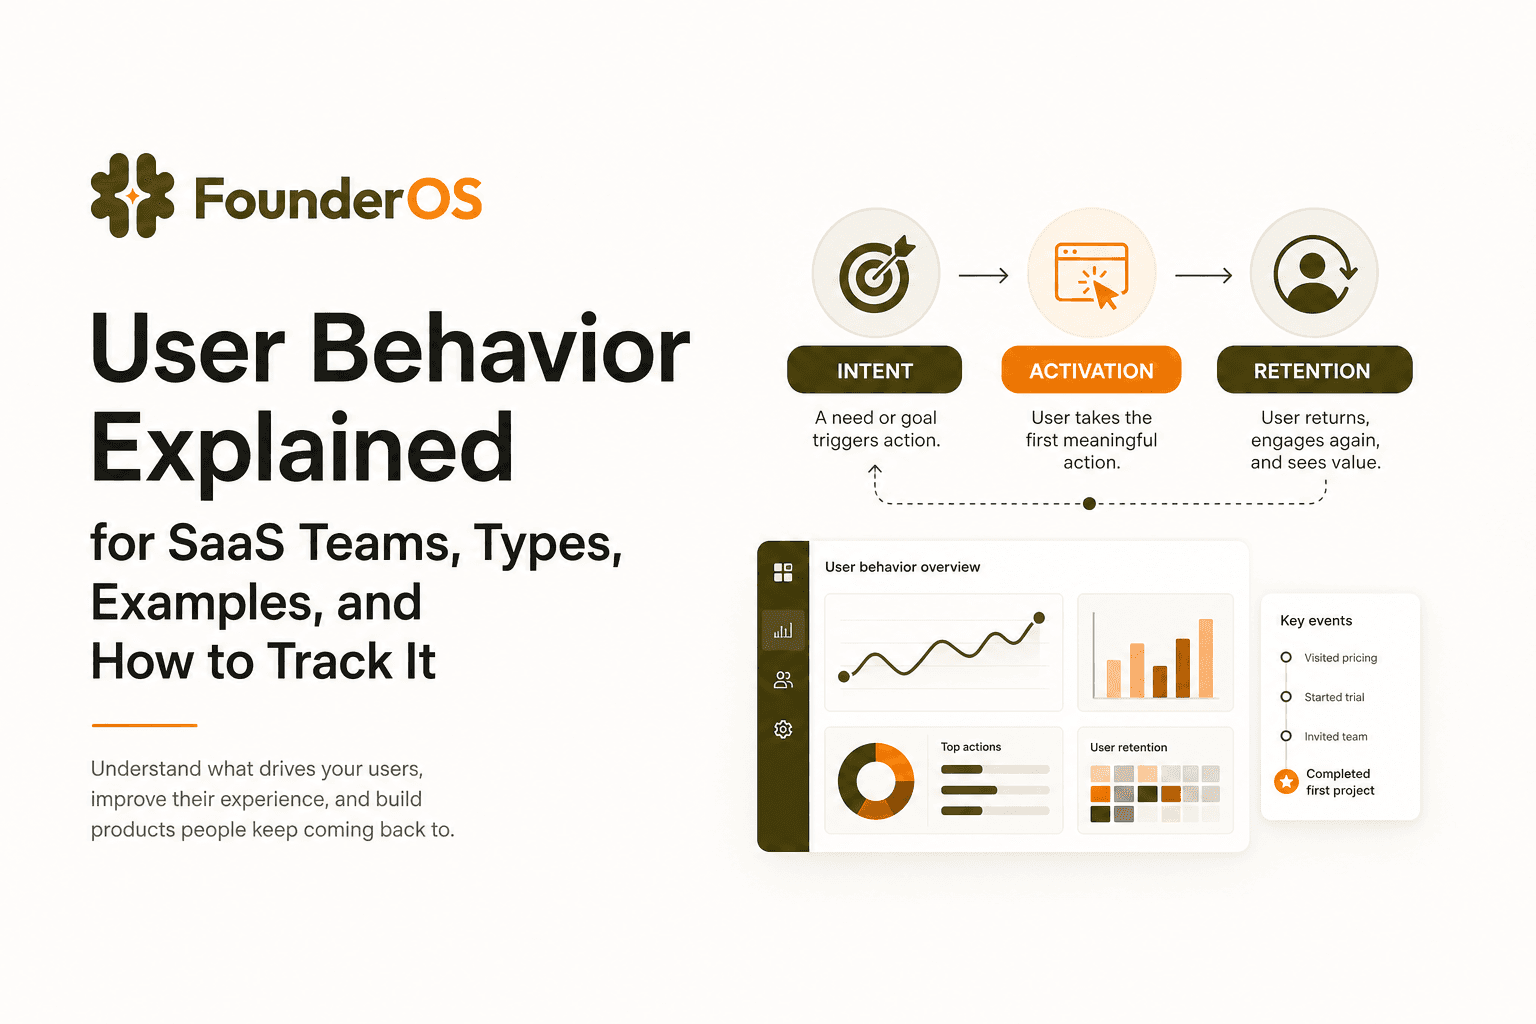
User Behavior Explained for SaaS Teams, Types, Examples, and How to Track It
Learn what user behavior means in SaaS, the key types, and a practical event tracking playbook to turn user behavior into product decisions.