
Customer Experience and Analytics for B2B SaaS, A Measurement-First Framework That Drives Retention
Customer experience and analytics only works when it links what users feel and do to measurable product outcomes like activation, retention, and expansion, not when it creates more dashboards that nobody trusts.
- Define a CX-to-revenue chain with a small set of artifacts: event dictionary, success moments, scorecard, and action loops.
- Instrument “moments” (events + properties + success criteria) across onboarding, activation, and retention so you can diagnose drop-offs by segment.
- Operationalize insights with routing rules, experiments, and onboarding updates so customer experience and analytics changes behavior, not just reporting.
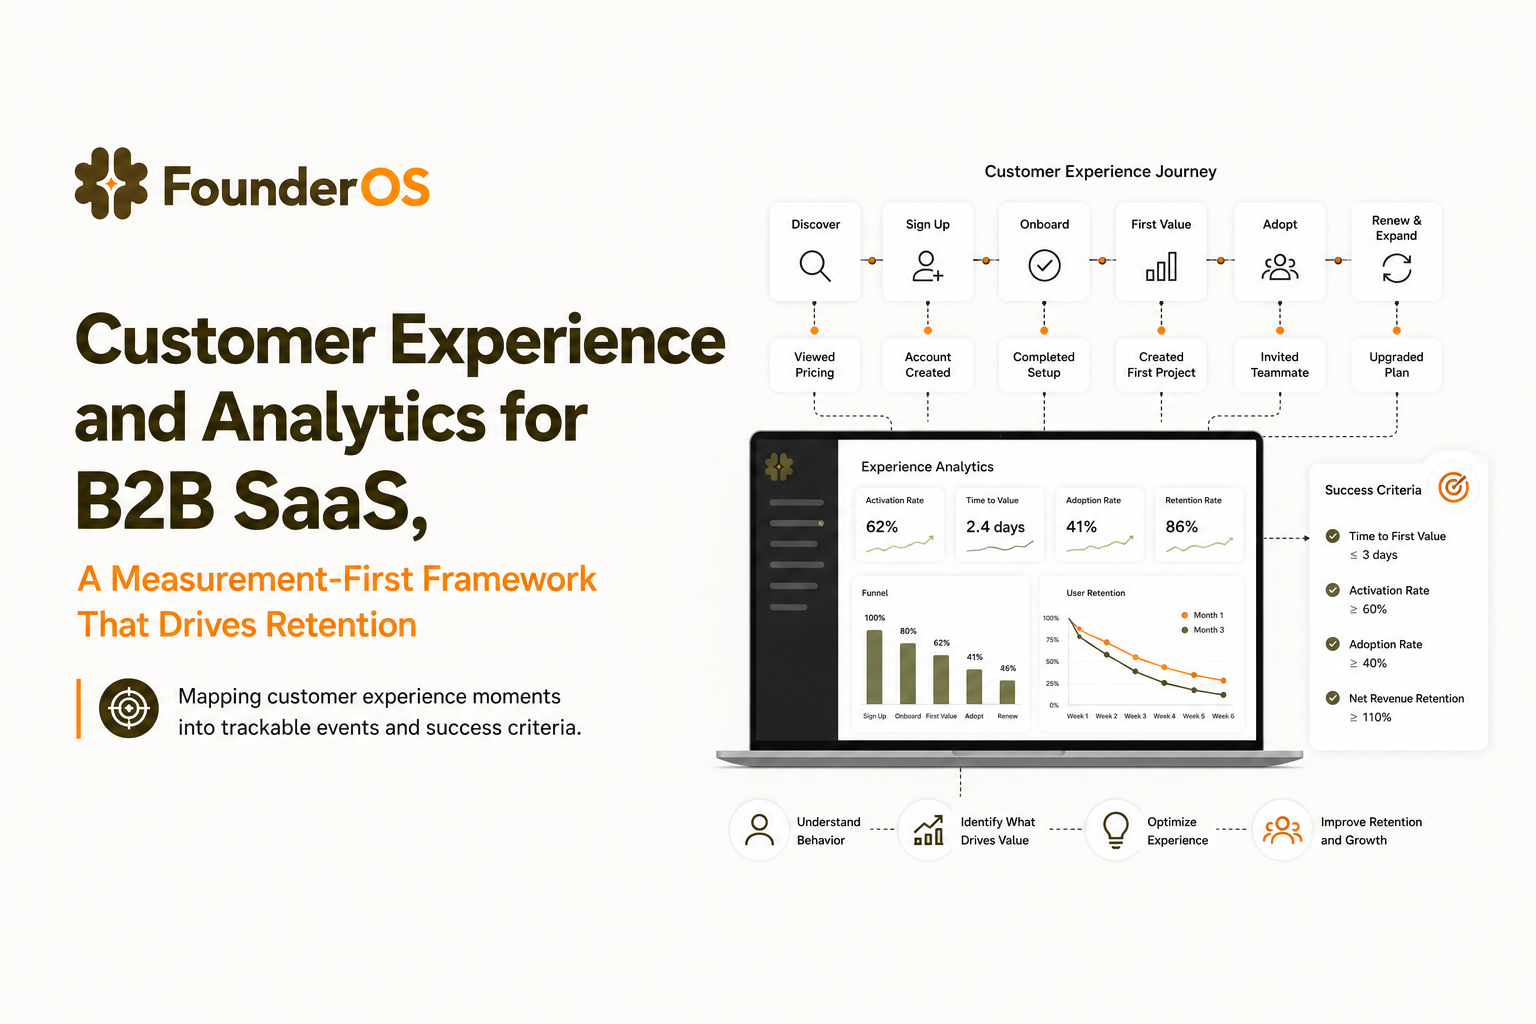
Customer experience and analytics, The measurement system most SaaS teams actually need
Most B2B SaaS teams track plenty of data, but still cannot answer basic questions like “Which part of onboarding causes the most frustration?” or “Which behaviors predict renewal?” The gap is rarely tooling. It is a missing measurement system that connects customer experience signals to product behavior and then to revenue outcomes.
What breaks in practice
- CX is described in words, not events: “confusing setup” or “slow time-to-value” never becomes something you can measure and fix.
- Analytics stops at reporting: charts exist, but there is no decision rule that triggers an experiment, a message, or a workflow.
- Revenue outcomes are disconnected: retention and expansion are monitored in CRM or billing, while product behavior lives elsewhere.
The CX-to-revenue chain (the artifact set)
In a measurement-first system, you maintain four artifacts that stay stable even as dashboards change:
- Success moments: 3 to 6 “this user got value” moments (example: “invited 3 teammates” or “created first report”).
- Event dictionary: the canonical list of events and properties that represent those moments.
- CX analytics scorecard: a weekly view of leading indicators tied to the moments above, segmented by meaningful cohorts.
- Action loops: if-then rules that define what the team does when a metric moves (experiment, onboarding change, routing to sales, or support outreach).
What “good” looks like (criteria you can audit)
- Coverage: every success moment has an event, a timestamp, and the key properties needed to segment (plan, role, acquisition source, company size).
- Consistency: one event name per action (no duplicates like “Created Project” vs “Project Created”).
- Decision-readiness: for each scorecard metric, there is a defined owner, threshold, and next action.
Map the customer experience into trackable moments, not vague journey stages
Journey maps are useful, but “Onboarding” and “Activation” are too broad to diagnose. Customer experience and analytics becomes actionable when you translate the journey into trackable moments: events, properties, and success criteria.
A practical mapping template (copy/paste)
For each stage, define moments using this template:
- Moment name: the user intent (example: “connect data source”).
- Event(s): what you will track (example: integration_connected).
- Required properties: what makes the event diagnosable (example: integration_type, error_code, time_to_complete_seconds).
- Success criteria: what counts as “worked” (example: integration_connected AND first_sync_completed within 10 minutes).
- Failure modes: top 3 ways it fails (example: auth error, missing permissions, user exits before sync).
Onboarding moments (first session to first value)
Onboarding is where qualitative friction becomes measurable. Start with 5 to 8 moments, not 30. In our experience working with early-stage B2B SaaS teams, the fastest improvements came from instrumenting just the first 15 minutes of usage and treating it like a funnel you can debug.
- Account created: signup_completed (props: auth_method, source, company_size).
- Workspace configured: workspace_created (props: template_used, industry).
- First object created: core_object_created (props: object_type, created_from).
- First teammate invited: invite_sent (props: invite_role, invite_count).
Activation moments (value proof, not feature clicks)
Activation should represent value proof, not “used feature X.” A useful test is: if a user hits this moment, would a human PM say “they got it”?
- Time-to-first-value (TTFV): time from signup_completed to first_value_event.
- Value loop completion: a sequence like create → configure → share → return.
- Depth signal: at least one “advanced” behavior (example: saved filter, automation enabled).
Retention moments (habits and risk)
Retention is easier to improve when you track “habits” (repeatable behaviors) and “risk signals” (drop in usage, errors, failed attempts).
- Habit events: weekly_report_viewed, automation_run, teammate_comment_added.
- Risk events: repeated_error_seen, billing_page_viewed, export_attempt_failed.
If you need a deeper framework for turning moments into audiences, see user segmentation and how it supports customer experience and analytics decisions.
The CX analytics scorecard for B2B SaaS, Metrics that diagnose what to fix
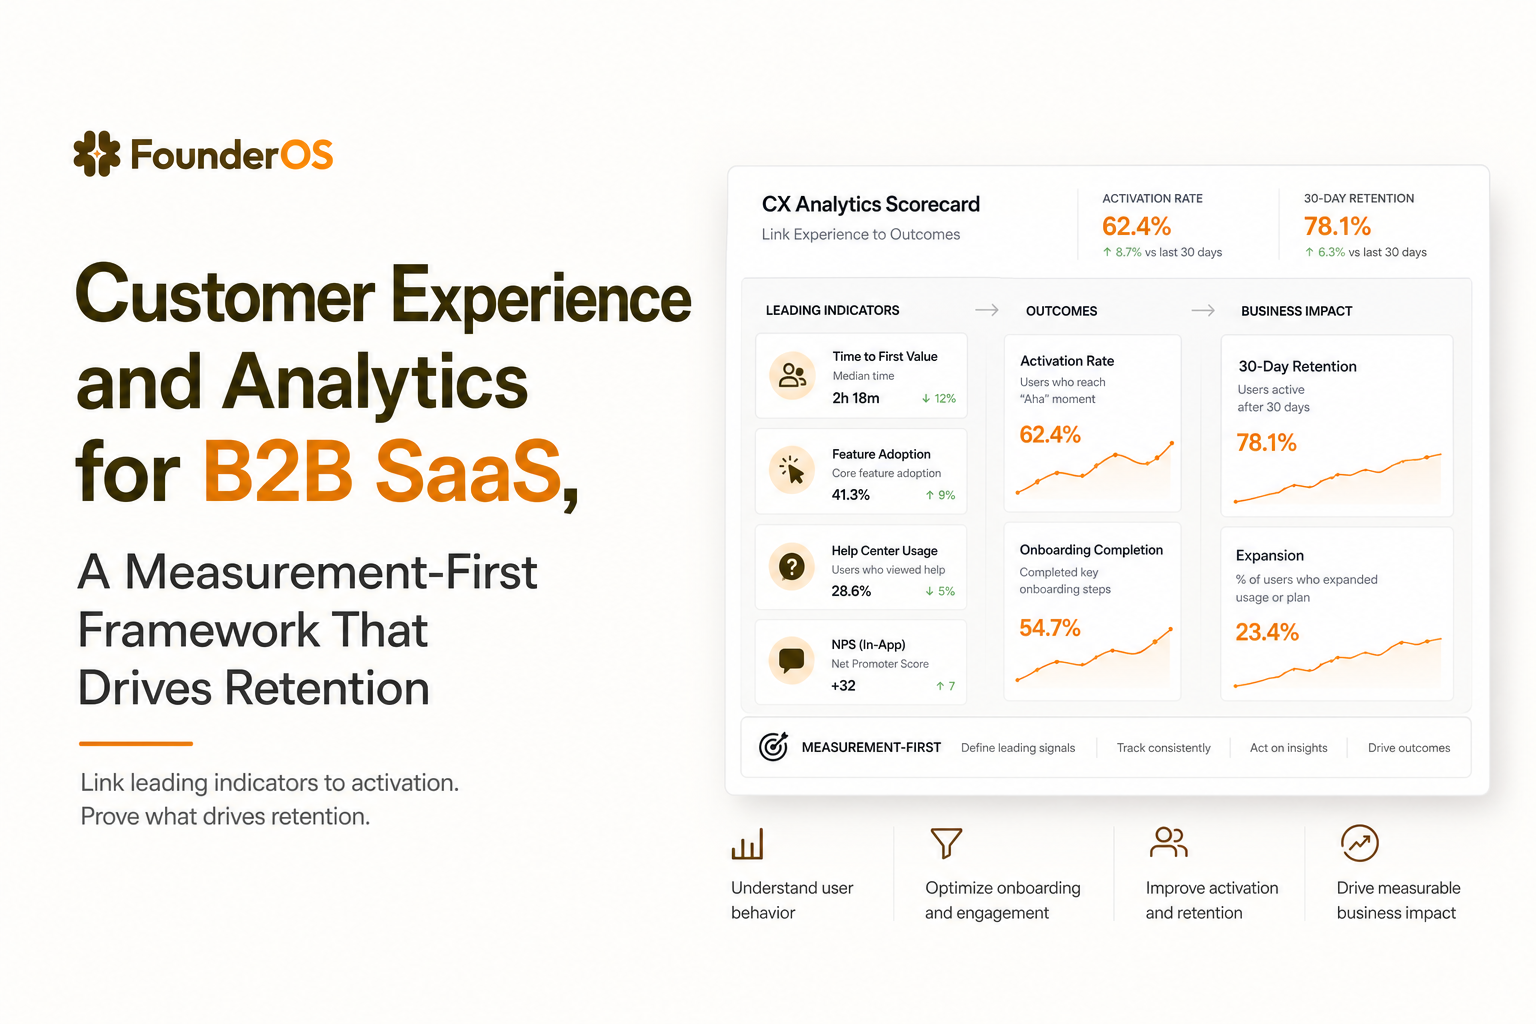
Dashboards fail when they track everything. A scorecard works when it tracks a small set of leading indicators that point to a specific fix. The goal of customer experience and analytics is diagnosis: “Where is momentum breaking, for which users, and why?”
The scorecard structure (7 metrics max)
Use a weekly scorecard with three layers:
- Outcome metrics: retention, expansion, churn (what happened).
- Experience leading indicators: TTFV, activation rate, repeat usage (why it happened).
- Quality metrics: error rate, latency, support contact rate (what degraded the experience).
Recommended scorecard metrics (with definitions)
- Activation rate: % of new signups that complete your activation definition within N days (commonly 7 or 14).
- Median TTFV: median minutes or hours from signup to first_value_event (median beats average because outliers are common).
- Onboarding completion: % who reach onboarding_step_k (your last meaningful setup step).
- Week-1 repeat rate: % of activated users who return and perform a habit event in days 2 to 7.
- Friction rate: % of users who hit an error event at least once during onboarding (track error_code).
- Feature adoption of the value driver: % of active accounts using the 1 to 2 features most correlated with retention.
- Expansion intent signal: % of accounts that hit a high-intent event (invite teammates, view pricing, exceed limits).
Segment cuts that actually change decisions
Segmenting is where customer experience and analytics becomes precise. Start with 4 to 6 cuts that map to different experiences:
- Acquisition source: paid vs organic vs partner (different expectations and urgency).
- Role: admin vs end user (admins feel setup pain, end users feel workflow pain).
- Company size: 1 to 10 vs 11 to 50 vs 51+ (collaboration moments matter more as size grows).
- Use case: picklists from onboarding (so you can see which “promise” is not being met).
Diagnostic views you should standardize
- Activation funnel: signup_completed → workspace_created → core_object_created → first_value_event. (If you need a playbook, use funnel analysis.)
- Cohort retention: weekly retention by activation cohort (activated vs not activated).
- Error overlay: conversion rate split by users who saw error_code X vs did not.
Close the loop, How to turn CX insights into product and GTM actions
Insights are only useful when they create a repeatable action. The most effective customer experience and analytics systems define “closed-loop” rules: what happens when a user is high-intent, stuck, or at risk.
The closed-loop operating model (3 loops)
- Product loop: fix friction that blocks activation (UI, performance, missing guidance).
- Lifecycle loop: trigger onboarding or education when a user is stuck.
- GTM loop: route high-intent accounts to sales or CS with context.
Action rules you can implement immediately
- Stuck in setup: IF signup_completed AND no workspace_created within 30 minutes, THEN trigger a setup tip and log the drop-off reason via a 1-question prompt.
- High intent: IF invite_sent >= 3 OR pricing_page_viewed OR limit_reached, THEN alert sales with the last 10 events and current segment.
- At-risk: IF activated AND no habit_event in 7 days, THEN trigger a re-engagement message tied to the last successful workflow.
Experiment design that avoids “random changes”
Use a simple experiment template so changes are attributable:
- Hypothesis: “Reducing auth errors will increase workspace_created by 8%.”
- Primary metric: the funnel step you expect to move.
- Guardrails: error rate, time-to-complete, support contacts.
- Segment: define who is eligible (example: Google auth users only).
When we tested routing rules based on “invite teammate” as a high-intent signal, the pattern was clear: sales conversations started with far more context, and the win-rate improved because reps opened with the exact workflow the account was trying to complete.
Where a unified system helps (without making the post about tools)
This is where teams often stitch together event tracking, user profiles, segmentation, and onboarding triggers. A single platform can reduce handoffs, but the key is still the system: instrument moments, score them weekly, and act on thresholds. If you are evaluating product analytics tools, prioritize whether they support real-time segmentation and funnel diagnostics that align with your customer experience and analytics scorecard.
Implementation plan, Instrument in one week and improve CX in the next two
The fastest way to stall is to start by tracking everything. Instead, implement the minimum measurement system, then iterate. Below is a three-week rollout plan designed for small product teams.
Week 1, Instrument the moments that matter
- Day 1: Define 3 success moments and your activation definition (write it in one sentence).
- Day 2: Create an event dictionary for onboarding and activation (10 to 20 events max).
- Day 3: Add required properties (role, plan, source, error_code, integration_type).
- Day 4: Validate events with a live event stream check in staging and production.
- Day 5: Build the activation funnel and baseline conversion rates by 3 key segments.
Week 2, Diagnose and pick one lever
- Find the largest drop-off step in the activation funnel.
- Split by one segment that changes the story (role or source usually does).
- Review 10 to 20 user sessions or event trails for the drop-off cohort.
Week 3, Ship one improvement and measure impact
- Ship one onboarding change (copy, defaults, guidance, performance fix).
- Run the experiment for a full week or until you hit a pre-defined sample size.
- Update the scorecard and document the new baseline.
We initially assumed our biggest activation blocker would be feature complexity, but event trails showed most drop-offs happened after a single repeated error_code, so fixing that path moved activation more than any tooltip work.
Pitfalls to avoid (with safeguards)
- No owner: assign one person to the event dictionary and scorecard updates.
- Unstable definitions: do not change activation criteria mid-experiment.
- Missing properties: if you cannot segment, you cannot diagnose.
Common failure modes in customer experience analytics and how to prevent them
Customer experience and analytics fails in predictable ways. The fixes are mostly process and governance, not more tracking.
Failure mode 1, Vanity metrics replace diagnostic metrics
- Symptom: tracking page views, time-on-site, or “daily active users” without a value definition.
- Prevention: require every metric to map to a success moment or a failure mode.
Failure mode 2, Over-segmentation hides the real story
- Symptom: dozens of segments, none large enough to trust.
- Prevention: limit scorecard segmentation to 4 to 6 cuts; add more only when you have a decision that depends on it.
Failure mode 3, Misattribution between product and GTM
- Symptom: sales claims credit for activation, product claims credit for expansion, nobody can prove it.
- Prevention: define “product-led” vs “assisted” activation using explicit events (example: sales_call_completed before first_value_event).
Failure mode 4, Data quality issues destroy trust
- Symptom: duplicate events, missing user IDs, inconsistent naming.
- Prevention: weekly audits on top events, and a “no deploy without event check” step in release QA.
For teams going deeper on instrumentation, it helps to align on event analytics conventions so customer experience and analytics stays consistent as the product evolves.
| Artifact | What it answers | Owner | Update cadence |
|---|---|---|---|
| Success moments | What “value” means in your product | PM + CS | Quarterly |
| Event dictionary | What to track and how to segment it | PM + Eng | Weekly as needed |
| CX analytics scorecard | What to fix next and where drop-offs occur | PM | Weekly |
| Action loops | What happens when users are stuck, high-intent, or at-risk | PM + Growth + CS | Biweekly |
FAQ
If you want to implement this measurement-first approach without heavy engineering cycles, Founder OS can help you capture user behavior, build funnels and segments, and connect those insights to onboarding actions so customer experience and analytics leads to measurable activation and retention improvements.
Written by Ivy Tran
Founder of FounderOS, sharing practical insights on SaaS growth, product analytics, and user activation.
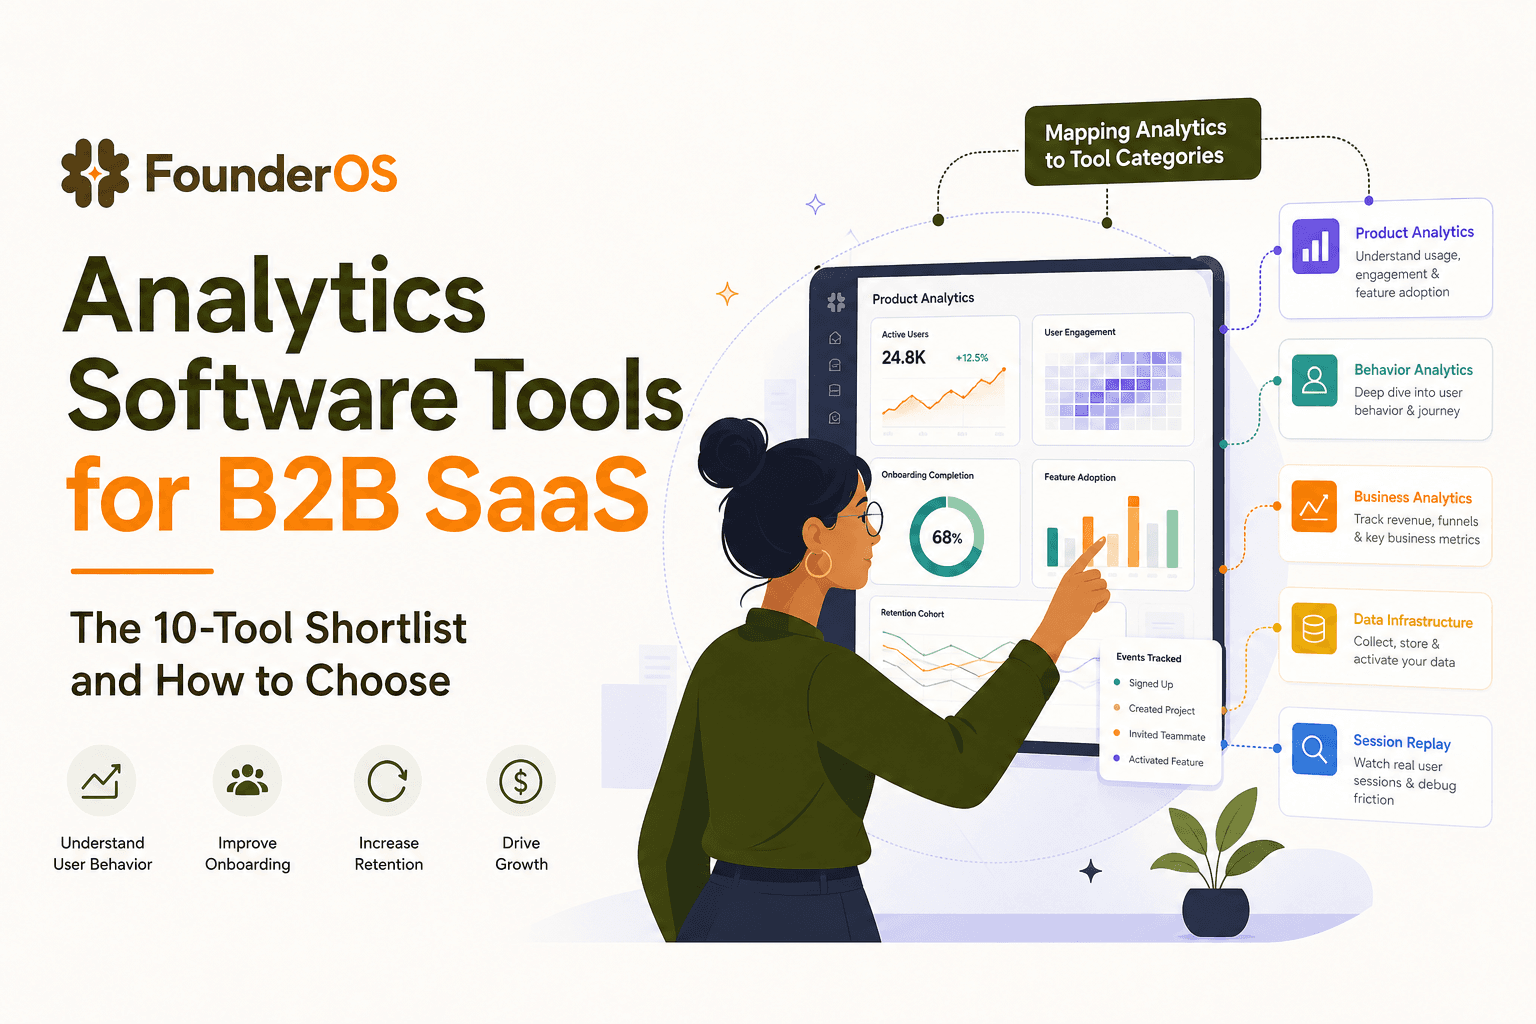
Analytics Software Tools for B2B SaaS - The 10-Tool Shortlist and How to Choose
A BOFU-ready shortlist of analytics software tools for B2B SaaS: 10 picks across categories plus a buyer rubric and rollout plan.

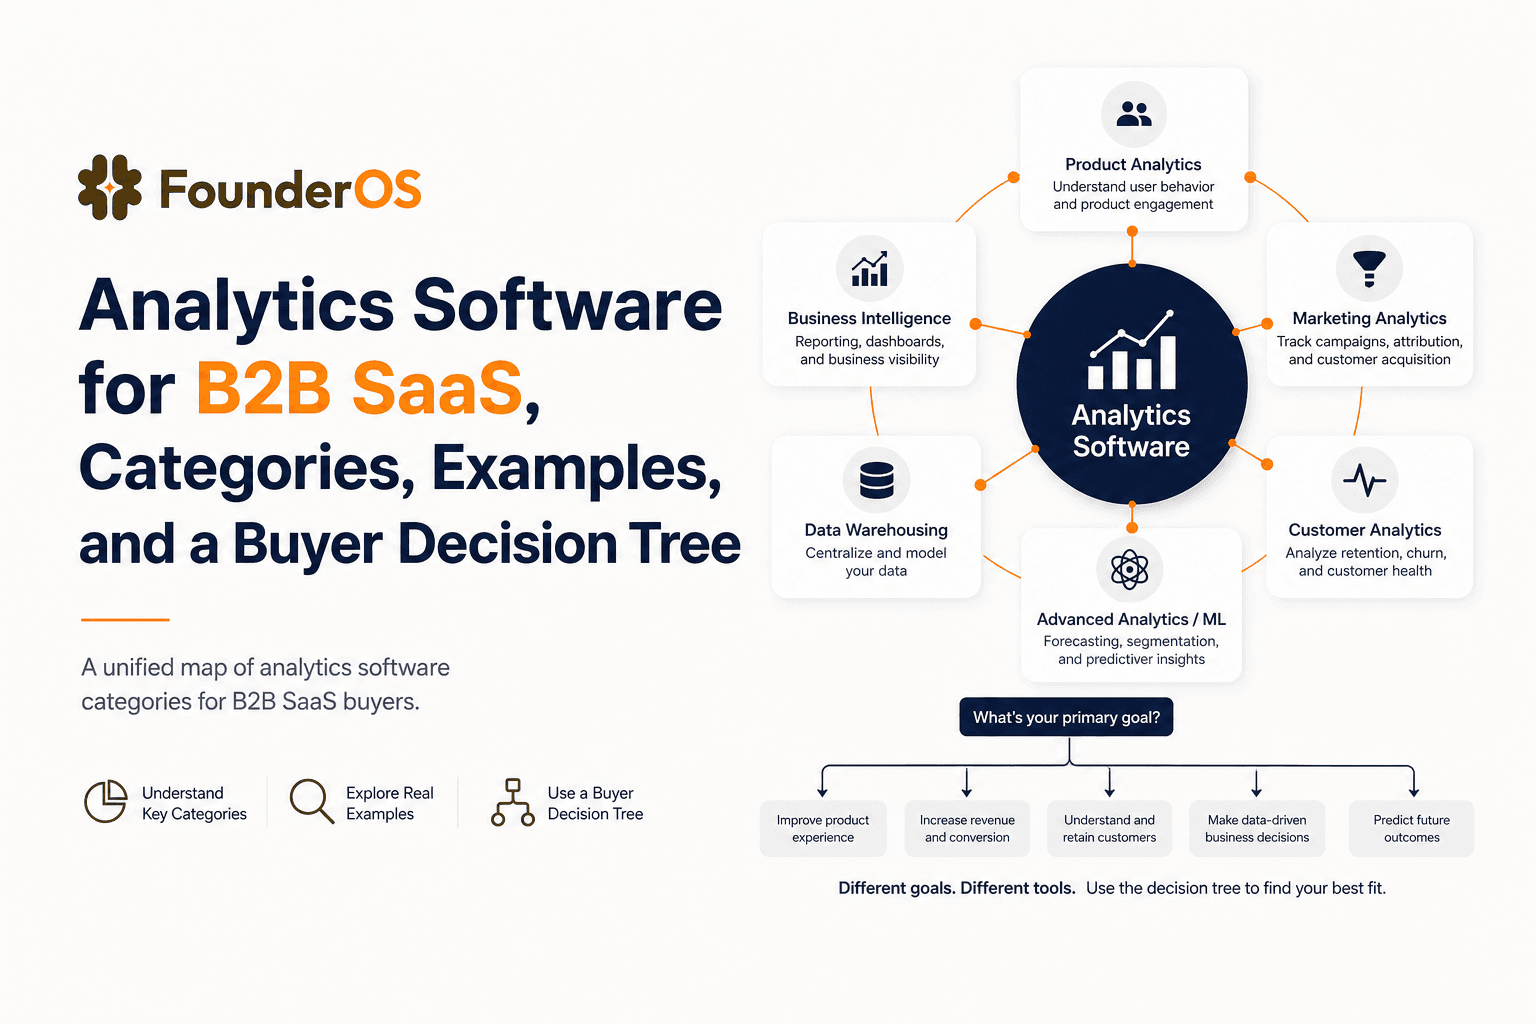
Analytics Software for B2B SaaS, Categories, Examples, and a Buyer Decision Tree
Choose analytics software for B2B SaaS with a clear category map, 10-minute decision tree, real workflows, and a practical buyer checklist.
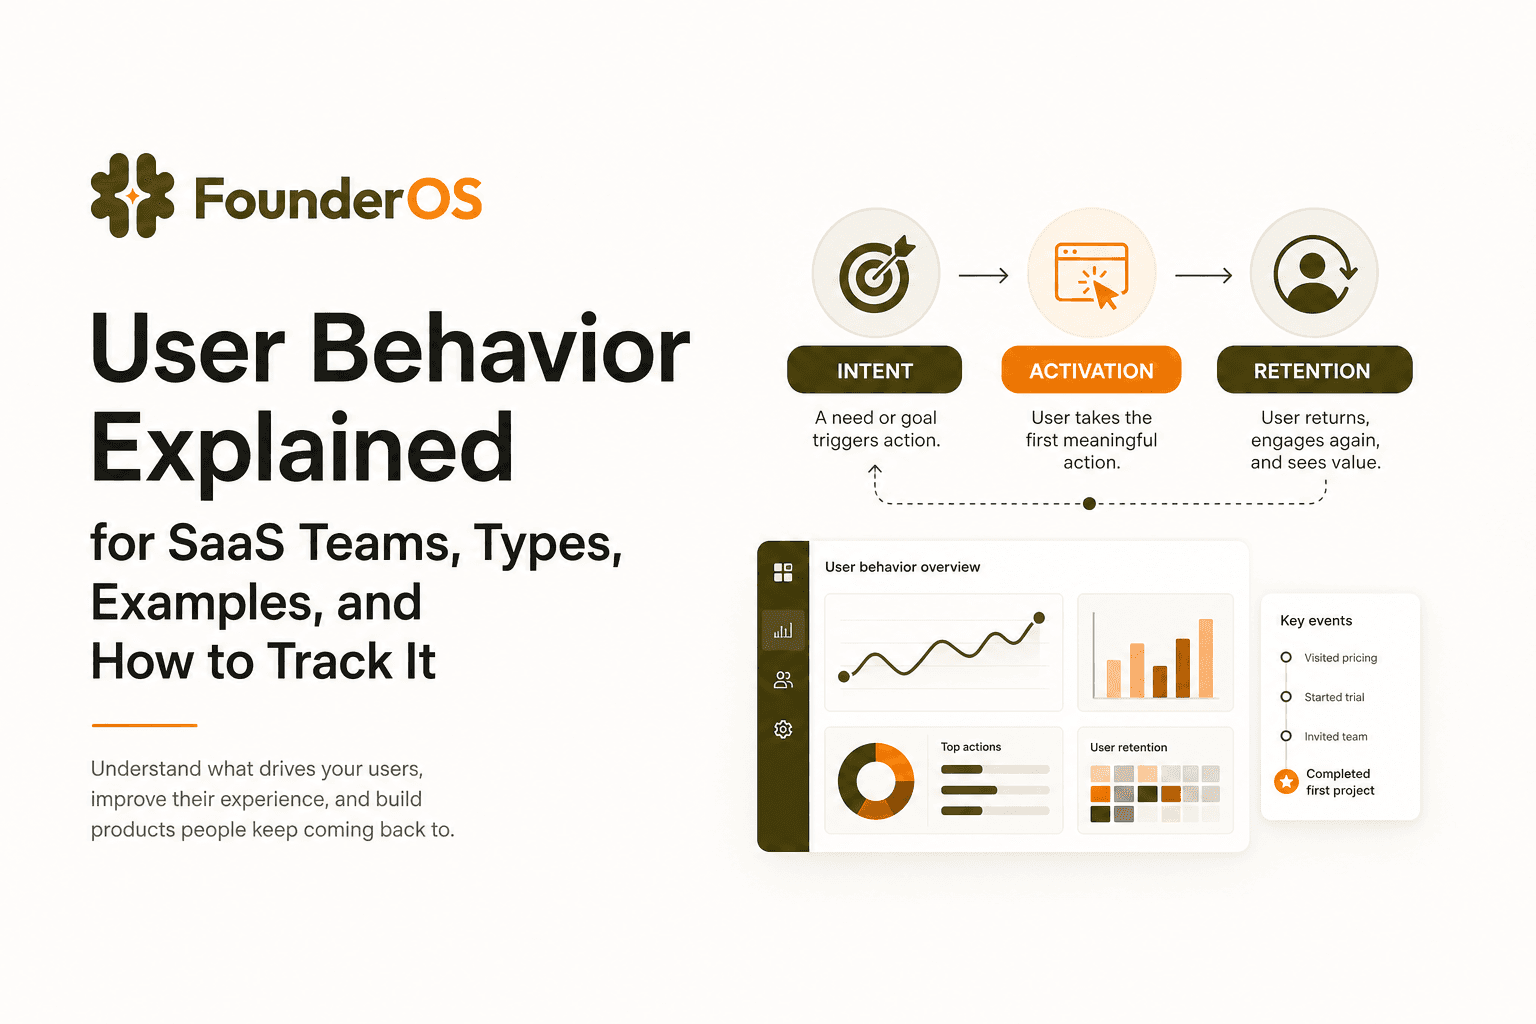
User Behavior Explained for SaaS Teams, Types, Examples, and How to Track It
Learn what user behavior means in SaaS, the key types, and a practical event tracking playbook to turn user behavior into product decisions.