
Guided Walkthrough Software, The Activation-First Buyer Scorecard and Shortlist
Buying guided walkthrough software is easy to get wrong because most demos optimize for “nice tours” instead of measurable activation. This guide gives you an activation-first scorecard, a shortlist-style comparison framework, and a 7-day validation plan you can run in production without risking user trust.
- Evaluate guided walkthrough software on activation outcomes: targeting, experimentation, analytics, and maintainability, not just UI polish.
- Use a weighted 10-criteria scorecard to avoid “demo bias” and compare tools across your real flows, segments, and data stack.
- Prove impact with cohorts and funnels (activation lift), then roll out safely using a 7-day pilot with clear go or no-go thresholds.
What guided walkthrough software should do in a modern SaaS onboarding motion
Define success as time-to-value, not tour completion
A completion rate is a usability metric. Activation is a business metric. Before you compare any guided walkthrough software, write down one “aha” behavior that indicates a user is getting value, for example:
- CRM: created first pipeline and added 3 contacts
- Analytics: connected data source and viewed first dashboard
- Dev tool: generated an API key and made first successful request
Then define a target window (for example, within 24 hours of signup for self-serve, or within 7 days for sales-led). Your walkthroughs should exist to shorten that window.
Must-have capabilities checklist
Use this as a minimum bar. If a tool fails any item, you will likely outgrow it quickly.
- Multi-format patterns: modals, tooltips, hotspots or bubbles, and in-app surveys for feedback loops.
- Targeting by segment and behavior: show steps only when a user is eligible (role, plan, lifecycle, completed events).
- Conditional logic: if/then branching so different users do not get forced through the same path.
- Triggers: URL, element visibility, event-based triggers (for example, “clicked Import” but did not complete).
- Analytics that matter: step drop-off plus downstream activation impact, not just tour views.
- Governance: versioning, approvals, and the ability to pause or roll back instantly.
One workflow to test in every demo
Bring a single “activation flow” to every vendor and ask them to build it live. Example:
- User signs up and lands on /dashboard.
- If they have not connected an integration, show a 3-step flow that points to “Connect data”.
- If they connect successfully, stop the flow and show a short nudge to “Create first report”.
- If they abandon at step 2, re-trigger 24 hours later with a lighter prompt, not the full tour.
This single scenario exposes whether the product is a tour builder or true guided walkthrough software built for real onboarding.
The buyer scorecard, 10 criteria to compare walkthrough tools without getting fooled by demos
How to score
Use a 1 to 5 score per criterion, then multiply by weight. Total possible score is 100. If you are evaluating multiple teams or products, keep the weights constant so your comparisons remain fair.
The 10 criteria (with weights and what “5 out of 5” looks like)
- Targeting and segmentation (15): can target by attributes, segments, and behavior, with AND/OR logic and exclusions.
- Triggering and context (10): supports triggers by URL, element, and events; respects timing (cooldowns) to prevent spam.
- Conditional paths (10): branching based on user actions and state; can skip steps automatically when a task is already done.
- Patterns and UX control (10): supports multiple UI patterns and allows styling, positioning, and accessibility controls.
- Maintainability at scale (10): resilient to UI changes; easy to update steps; supports reusable blocks or templates.
- Experimentation (10): A/B testing, holdouts, and the ability to compare variants against activation outcomes.
- Analytics and attribution (15): connects walkthrough exposure to downstream events, funnels, and retention cohorts.
- Data governance and privacy (8): role-based permissions, audit logs, data retention controls, and consent-friendly targeting.
- Performance and reliability (7): minimal page impact, fast load, and graceful fallback when elements are missing.
- Total cost of ownership (5): pricing plus ongoing costs: engineering time, content ops, and analytics work.
Anti-demo questions that reveal the truth
- “Show me the holdout.” Can you exclude 10% of eligible users automatically so you can measure lift?
- “What breaks when the UI changes?” If a button label or DOM changes, how many tours fail and how do you detect it?
- “Where does the event data live?” Can you export exposure and completion events to your warehouse or analytics tool?
- “Can I target by what the user already did?” For example, only show a flow if they clicked Import but did not finish.
Tool categories and when each wins, from product adoption platforms to lightweight tour builders
Category 1: Lightweight tour builders
Best when: you need a small number of static tours for feature announcements or simple first-run guidance, and you do not need deep segmentation or experimentation.
Watch-outs: completion-heavy reporting, limited behavioral targeting, and brittle maintenance as your UI evolves. Many teams end up with “tour debt” where outdated walkthroughs create more confusion than clarity.
Category 2: Product adoption platforms (broader enablement suites)
Best when: you need a broad in-app engagement layer across many teams, including resource centers, announcements, and multiple products, with mature governance.
Watch-outs: higher cost and heavier operations. You can end up optimizing for engagement metrics rather than activation, especially if analytics are disconnected from your product tracking.
Category 3: Activation-first onboarding with product analytics built in
Best when: you want guided walkthrough software tightly tied to product tracking, segmentation, and funnels, so you can prove that walkthrough exposure changes activation behavior.
What to look for: event-based targeting, cohort analysis, funnel tracking, and the ability to ship flows without engineering releases. This category is often a strong fit for founders and small growth teams who want speed without losing measurement.
A quick “best fit” mapping
- If you only need 1 to 3 tours: lightweight builder can be enough, but still demand targeting and a rollback switch.
- If multiple teams ship in-app messages weekly: adoption platform with governance and permissions can win.
- If your board asks “did onboarding increase activation?” prioritize analytics-connected onboarding where experimentation and funnels are first-class.
The analytics gap most teams miss, proving walkthrough impact on activation not completion
Why completion is misleading
A user can complete a tour and still fail to activate, especially if the tour is passive (lots of “Next” clicks) or if it pushes users to features that are not relevant to their job-to-be-done.
The minimum measurement model (exposure, activation, retention)
To prove value, instrument three layers:
- Exposure events: user saw walkthrough step 1, step N, completed, dismissed.
- Activation events: your defined “aha” behavior (for example, integration_connected, first_project_created).
- Retention proxy: returned and repeated a core action within 7 or 14 days.
A practical causal test you can run without a data science team
- Create an eligible segment: new users who reached the dashboard but have not completed the activation event.
- Split traffic: 90% see the walkthrough, 10% are a holdout.
- Measure activation lift: compare activation rate within your time window.
- Check for harm: look for increased time-on-task, higher dismiss rates, or support tickets.
If you want a clean definition for activation before you start, see user activation.
Benchmarks to sanity-check your results
Use these as directional targets, not guarantees:
- Step drop-off: if more than 40% drop on the same step, that step is likely unclear or mistimed.
- Dismiss rate: above 25% on first step often indicates poor targeting or interruptive timing.
- Activation lift: even a 5 to 10% relative lift can be meaningful if your signup volume is high. Some teams report higher gains when flows are tightly targeted and iterated.
For measurement discipline and experimentation, you can borrow concepts from analytics standards and event design practices used across the industry. A helpful reference is the NIST Digital Identity Guidelines for thinking about user states and risk in onboarding-related flows: NIST 800-63.
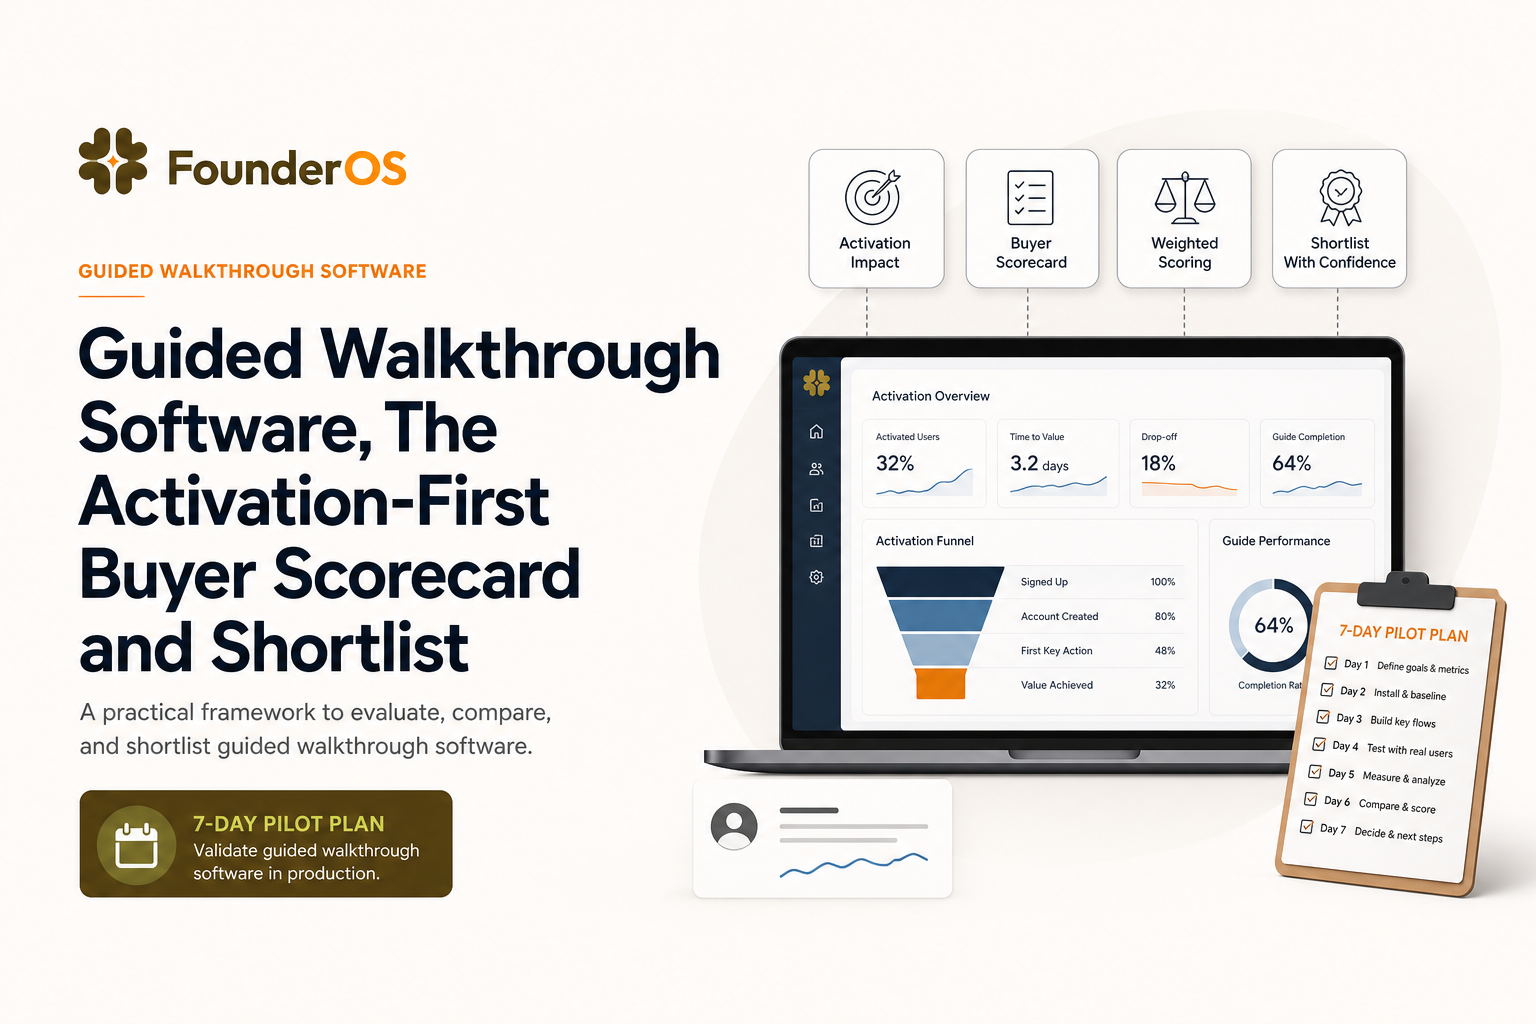
Shortlist and 7-day validation plan, how to pilot guided walkthrough software in production
Step 1: Pick one activation flow and write a one-page spec (Day 1)
Include:
- Eligible segment definition
- Activation event and time window
- Walkthrough steps (max 5 to 7)
- Stop conditions (what should end the flow immediately)
- Holdout percent (start at 10%)
If you need a structure for the steps, start from a proven onboarding checklist that adapts to behavior instead of assumptions.
Step 2: Implement with safeguards (Days 2 to 3)
- Frequency caps: no more than 1 new flow per session for new users.
- Escape hatches: always allow dismiss and “remind me later”.
- Fallback logic: if a UI element is missing, skip the step and log it.
At this stage, guided walkthrough software that supports no-deploy publishing can reduce cycle time, but only if governance is strong enough to prevent accidental blasts.
Step 3: Run the pilot and review daily (Days 4 to 6)
Daily review checklist:
- Activation rate: exposed vs holdout
- Median time-to-activation
- Top drop-off step and why
- Qualitative feedback from support and sales calls
If you are designing the flow itself, a tactical reference is this guided product tour blueprint.
Step 4: Decide with explicit thresholds (Day 7)
Write the decision rule before you look at results. Example:
- Ship if activation lift is at least +8% relative and there is no increase in support tickets tagged “confusing onboarding”.
- Iterate if lift is positive but below threshold, and drop-off is concentrated in one step.
- Stop if dismiss rate is high and activation does not improve, indicating poor targeting or a mis-specified “aha”.
What to ask vendors to provide during the pilot
- Export of walkthrough exposure events
- Ability to target by segment and behavior without engineering
- Funnel or cohort view that ties walkthrough exposure to activation
- Rollback and pause controls
If your team is still deciding between categories, this guide on product onboarding tools can help you avoid optimizing for completion metrics.
| Evaluation area | What to test in a pilot | Pass criteria | Common failure mode |
|---|---|---|---|
| Targeting and segmentation | Eligible segment + exclusions + cooldowns | Correct users see it, others do not | Broad blasts that annoy power users |
| Conditional logic | Skip steps when task already complete | No redundant guidance | Forced linear tours |
| Analytics | Expose vs holdout activation funnel | Clear lift measurement | Only views and completion rates |
| Maintainability | Change UI element and observe impact | Graceful step handling + alerts | Silent breakage and outdated steps |
| Governance | Pause, rollback, permissions | Safe ops for production | Accidental global publish |
FAQ about guided walkthrough software
What is the difference between guided walkthrough software and a product tour tool?
Product tour tools often focus on linear tours and UI patterns (tooltips, modals). Guided walkthrough software should also support behavioral targeting, conditional paths, and measurement that connects walkthrough exposure to activation outcomes.
How many steps should an onboarding walkthrough have?
As a rule, keep it to 5 to 7 steps for a single flow. If you need more, split into milestones triggered by behavior so users only see the next steps after completing the prior task.
How do I prove a walkthrough improved activation?
Use a holdout group and compare activation rate within a defined time window (for example, 24 hours or 7 days). Track exposure events, then measure downstream funnel conversion and time-to-activation for exposed vs holdout cohorts.
Can non-technical teams manage guided walkthrough software safely?
Yes, if the tool includes permissions, approvals, and instant pause or rollback. In practice, the safest setup is a no-code builder with governance plus analytics that show when a flow breaks or starts hurting key metrics.
If you want an activation-first approach where guided walkthrough software is directly connected to product tracking and segmentation, Founder OS is designed for founders who need to build, target, publish, and measure onboarding flows quickly, with analytics that help you tie walkthroughs to activation rather than just completion.
