Lead Scoring System Template for B2B SaaS with Points, Caps, Decay, and Routing Rules
A lead scoring system only helps if it reliably turns messy signals (firmographics, behavior, product usage) into clear revenue actions: who should get contacted, when, and by whom.
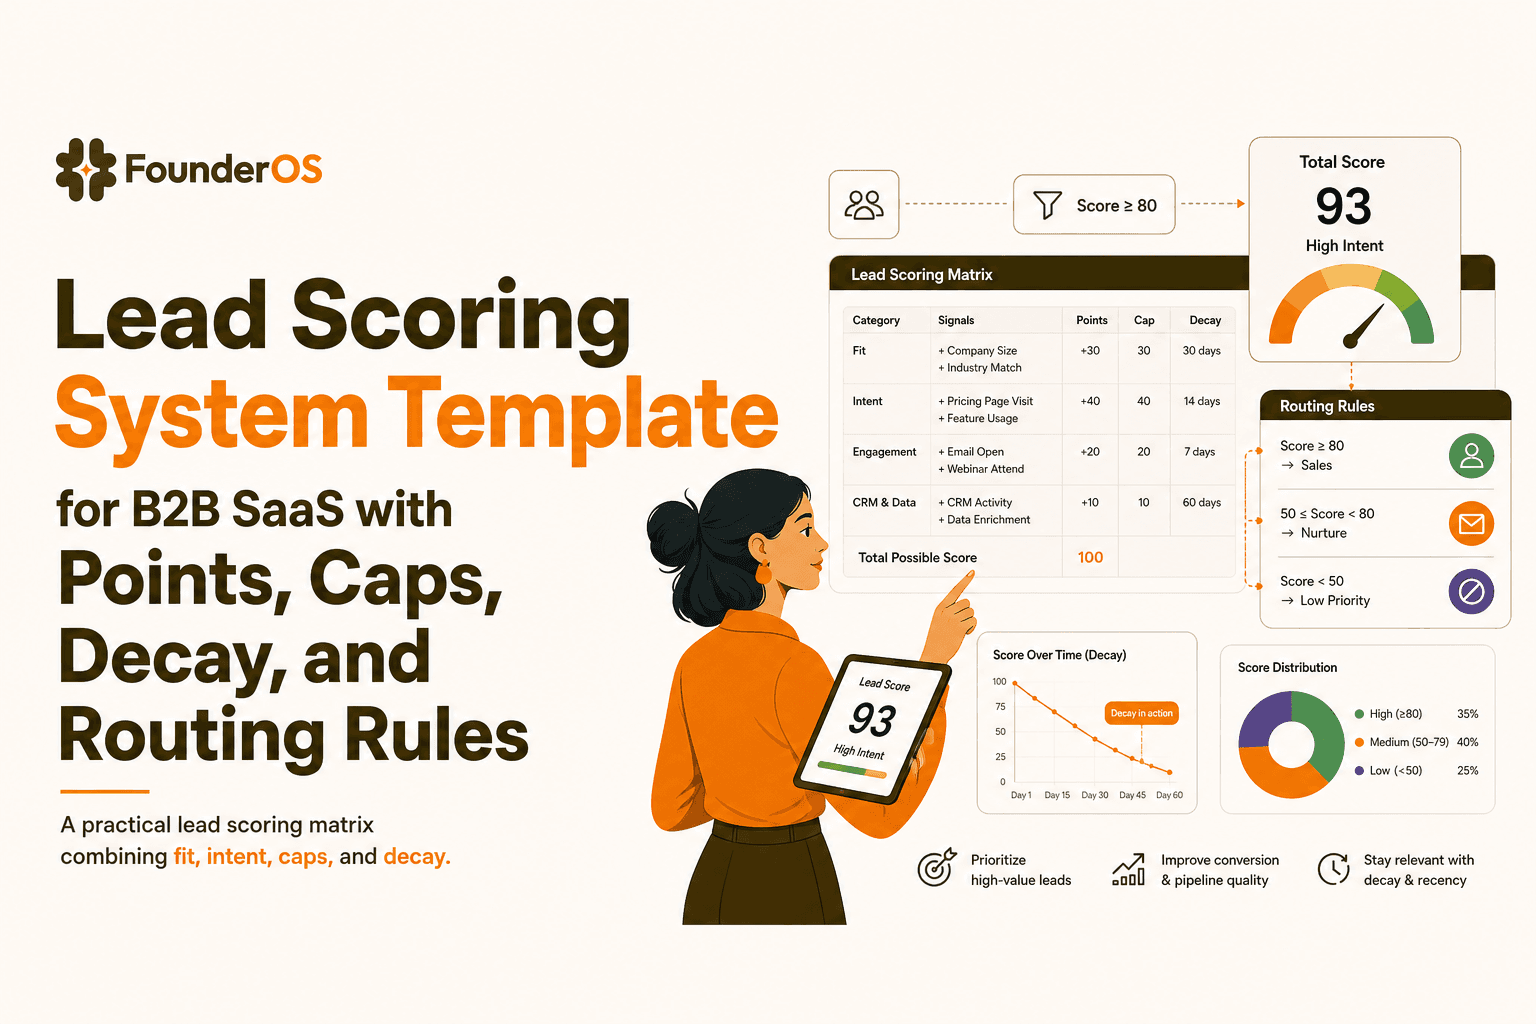
- Separate “fit” (ICP match) from “intent” (behavior) and map score bands to specific actions and SLAs.
- Use a scoring matrix with caps, time decay, and disqualifiers to prevent inflated scores and false positives.
- Measure impact over 30 to 60 days with baselines: acceptance rate, speed-to-lead, SQL rate, and pipeline created.

What a lead scoring system should do in B2B SaaS, not just rank leads
Problem: “hot leads” that do not buy
If your team celebrates high scores that do not convert, your model is likely mixing two different things:
- Fit: Is this account a good match for your product and pricing?
- Engagement and intent: Are they showing buying intent right now?
Scoring vs. grading (and why you need both)
Use two dimensions so your sales team can act without guesswork:
- Lead scoring = intent points based on actions (email, website, product events). See: lead scoring.
- Lead grading = fit grade based on ICP criteria (industry, size, region, tech, role). See: lead grading.
Map score bands to revenue actions (example)
A lead scoring system should end in a decision, not a number. Here is a practical mapping you can copy:
- Fit A/B + Intent ≥ 60: Route to AE within 5 minutes, 3-touch SLA in 24 hours.
- Fit A/B + Intent 30 to 59: Route to SDR, sequence + call within 24 hours.
- Fit C + Intent ≥ 60: Product-led nurture, invite to demo only after 2 more high-intent events.
- Any Fit + Intent < 30: Nurture, no human touch unless they spike.
The 7-step implementation framework from signals to routing and SLAs
Step 1: Define one “north star” conversion for sales
Pick one downstream outcome to optimize for. Common options:
- Sales Accepted Lead (SAL) rate
- SQL creation rate
- Pipeline created within 14 days
Write it as a plain rule: “A scored lead is successful if it becomes an SQL within 14 days.”
Step 2: List signals and label them as Fit or Intent
Start with 10 to 20 signals total. If you have more, you will not maintain it. Intent signal ideas:
- Visited pricing page
- Requested demo
- Invited teammates
- Connected an integration
- Completed onboarding milestone
Fit signals ideas:
- Company size bracket
- Industry
- Job title / seniority
- Country or region
Step 3: Assign points with caps to prevent spammy inflation
Rules of thumb that hold up in real pipelines:
- Make “pricing” and “demo” high, but cap repeat views.
- Make product actions higher than marketing actions for product-led motion.
- Cap low-signal events like blog views at a small total (example: max 6 points).
Step 4: Add time decay so old intent fades
Without decay, your lead scoring system will keep resurrecting leads that were curious months ago. A simple decay scheme:
- 0 to 7 days: 100% of points
- 8 to 30 days: 50% of points
- 31 to 90 days: 25% of points
- 90+ days: 0 points (unless a new high-intent event happens)
Step 5: Define disqualifiers and suppressions
Disqualifiers stop wasted follow-up. Common ones:
- Student or personal email for enterprise-only products
- Competitor domains
- Countries you cannot sell into
- Bot-like behavior (100+ page views in minutes)
Step 6: Set thresholds and routing rules
Turn numbers into workflow. Example thresholds:
- MQL: Fit A/B AND Intent ≥ 30
- SQL candidate: Fit A/B AND Intent ≥ 60 OR any Fit with “Request demo” event
- Recycle: Intent falls below 30 after decay
Attach SLAs (who, when, and how many touches) to each band. This is where scoring becomes revenue.
Step 7: Review cadence and change control
Operate the model like a product:
- Weekly: check false positives and false negatives
- Monthly: adjust 1 to 3 weights only (avoid thrash)
- Quarterly: revisit ICP definition and fit grading
Lead scoring system template with points, caps, decay, and disqualifiers
Copy-paste scoring matrix (spreadsheet-ready)
Use this as a starting point. Then calibrate to your deal cycle and ACV. For deeper product intent ideas, see how to identify high intent users in saas.
| Category | Signal | Points | Cap | Decay window | Notes / rule |
|---|---|---|---|---|---|
| Intent | Request demo | 60 | 60 | 14 days | Auto-route to AE regardless of other points |
| Intent | Pricing page view | 15 | 30 | 30 days | Cap at 2 views to avoid refresh inflation |
| Intent | Integration connected | 25 | 25 | 60 days | Strong “setup” intent, especially for B2B workflows |
| Intent | Invite teammate | 20 | 40 | 60 days | Cap at 2 invites; more can be noise for large orgs |
| Intent | Activation milestone completed | 30 | 30 | 60 days | Define milestone as your “aha” action |
| Intent | Visited security / compliance page | 10 | 20 | 30 days | Useful for mid-market and enterprise motions |
| Intent | Opened 3+ lifecycle emails in 7 days | 8 | 16 | 14 days | Keep email lower than product actions |
| Fit | Company size in target range | 0 | - | - | Handled via grade (A/B/C), not intent points |
| Fit | Title is buyer role (Founder, VP, Head) | 0 | - | - | Handled via grade; use for routing priority |
| Disqualify | Competitor domain | -999 | - | - | Suppress from sequences and AE routing |
| Disqualify | Bot pattern detected | -999 | - | - | Example: 50+ events in 60 seconds from same session |
Score bands and actions (routing playbook)
- Intent 0 to 29: Nurture only, no SDR task created.
- Intent 30 to 59: SDR task + 3-step sequence within 24 hours.
- Intent 60+: AE route if Fit A/B; if Fit C, require one more product signal (integration or teammate invite).
Worked example score 10 leads end to end and fix false positives
Assumptions for this example
- Fit grade: A (ideal), B (acceptable), C (edge)
- MQL: Fit A/B and Intent ≥ 30
- SQL candidate: Fit A/B and Intent ≥ 60 or “Request demo”
10 leads scored
| Lead | Fit grade | Signals observed (recent) | Intent points | Decision | Fix if wrong |
|---|---|---|---|---|---|
| 1 | A | Pricing x2, Activation milestone | 30 (pricing cap) + 30 = 60 | SQL candidate, route to AE | - |
| 2 | B | Request demo | 60 | SQL candidate, route to AE | - |
| 3 | A | Invite teammate x3, Integration connected | 40 (invite cap) + 25 = 65 | SQL candidate, route to AE | - |
| 4 | C | Pricing x2, Security page | 30 + 10 = 40 | MQL, SDR outreach | If many C leads convert poorly, raise C threshold to 70 |
| 5 | B | Email opens, blog browsing | 16 | Nurture | Keep email low weight to avoid false positives |
| 6 | A | Pricing x1 (45 days ago) | 15 then decays to ~4 | Nurture | Decay prevents stale “hot lead” |
| 7 | B | Activation milestone, no pricing | 30 | MQL, SDR outreach | If these convert well, add +10 for “used core feature 3 days in a row” |
| 8 | A | 50+ events in 60 seconds | -999 | Disqualified | Bot rule prevents spam routing |
| 9 | B | Security page x2, Pricing x1 | 20 (security cap) + 15 = 35 | MQL, SDR outreach | If many are procurement-only researchers, require product event before AE |
| 10 | A | Integration connected, Invite teammate, Pricing x1 | 25 + 20 + 15 = 60 | SQL candidate, route to AE | - |
Common false positives and exact fixes
- Pricing refresh loops: cap pricing views at 2 in 30 days.
- Email-only engagement: keep email weights low and require at least one product intent event for AE routing.
- Researchers on security pages: treat security views as “supporting” intent, not a trigger by itself.
Does lead scoring work a 30 to 60 day measurement plan with baselines and KPIs
Set baselines before you change anything
Pull the last 30 days and record:
- Leads created
- Sales accepted rate (SAL or equivalent)
- SQL rate
- Median speed-to-lead (minutes to first touch)
- Pipeline created per 100 leads
If you need definitions for speed-to-lead and follow-up expectations, the general principle is widely referenced in sales ops benchmarks. You can also align internal expectations to published guidance like HubSpot’s sales benchmarks: sales statistics.
Run it as an experiment, not a permanent switch
- Days 1 to 7: run scoring in “shadow mode” (calculate, do not route) and review the top 20 scored leads daily.
- Days 8 to 30: enable routing for only Fit A leads or only one segment, keep the rest on old process.
- Days 31 to 60: expand to Fit A/B and add 1 to 2 product intent signals if needed.
KPIs that show if your lead scoring system is actually improving revenue
- Acceptance rate (accepted / routed): target 70%+ for AE routes, 50%+ for SDR routes.
- SQL rate by band: intent 60+ should be meaningfully higher than 30 to 59.
- Time to first touch: aim to reduce median time, especially for 60+ band.
- Pipeline per 100 routed leads: the most honest metric for model quality.
Dashboard checklist
- Routed leads by score band and fit grade
- Acceptance rate by owner and band
- Stage conversion by band (lead to meeting, meeting to SQL, SQL to closed-won)
- Top false-positive signals (high score, no meeting)
How to implement with Founder OS from product events to segments to GTM reports
Instrument the product intent events you actually use in scoring
Start with 5 to 8 events that correlate with buying intent, not vanity usage. Typical examples:
- Completed onboarding milestone
- Connected integration
- Invited teammate
- Used core feature X times in 7 days
- Returned 3 days in a row
Founder OS can capture key actions quickly after install and tie them to individual user profiles, which makes it easier to build a lead scoring system based on real behavior rather than page views alone.
Turn events into dynamic segments you can route
Instead of exporting raw logs, define segments that match your score bands, for example:
- High intent: pricing viewed AND integration connected within 14 days
- Activated but not buying: activation milestone completed AND no pricing view in 30 days
- At-risk: previously activated AND no core feature use in 14 days
This is where user segmentation becomes operational, not just reporting.
Diagnose drop-offs that create “low intent” leads
If many leads stall before activation, scoring will not fix the underlying issue. Use funnel analysis to find the exact step where users stop, then adjust onboarding or messaging. Better activation improves the quality of intent signals feeding your lead scoring system.
Guardrails and governance for multi-segment scoring, bots, repeat actions, and drift
Anti-gaming rules you should implement on day one
- Event deduping: count “pricing view” once per session or once per day.
- Caps per signal: set caps for repeatable events (views, clicks, invites).
- Sequence validity: award points only if events happen in a meaningful order (example: signup then activation, not activation-like events on first page load).
Bot filtering checklist
- Suppress sessions with impossible velocity (example: 50 events in 60 seconds)
- Exclude known data center IP ranges if you have them
- Ignore “headless” user agents when feasible
Multi-segment scoring without chaos
If you sell to multiple ICPs (SMB vs mid-market), do not force one threshold. Keep one shared scoring matrix, but vary:
- Fit grading rules per segment
- SQL threshold per segment (example: SMB SQL at 50, mid-market SQL at 70)
- Which signals count as “strong” (security page might matter more for mid-market)
Drift monitoring
- Monthly: compare conversion rates of score bands to last month
- Quarterly: re-check top signals against closed-won and closed-lost
- Rule: adjust weights only when you can point to a specific failure mode (false positives or missed winners)
FAQ
What is the difference between lead scoring and lead grading?
Lead scoring measures intent based on behavior (website, email, product usage). Lead grading measures fit against your ICP (industry, size, role, region). In B2B SaaS, combining both reduces false positives.
How many signals should a lead scoring system include?
Start with 10 to 20 total signals. If you cannot explain why each signal predicts an SQL, remove it. Fewer, stronger signals are easier to maintain and calibrate.
How often should points decay?
A practical default is to halve points after 7 to 30 days depending on your sales cycle, then drop to near-zero by 90 days. The goal is that old curiosity does not keep triggering sales outreach.
What is a good acceptance rate for routed leads?
As a working benchmark, aim for 70%+ acceptance for leads routed directly to AEs and 50%+ for leads routed to SDRs. If acceptance is lower, tighten thresholds or add disqualifiers.
If you want to operationalize this lead scoring system using real product intent, Founder OS helps you capture user events quickly, build dynamic segments, and turn those insights into GTM reporting so routing and follow-up SLAs are based on behavior, not guesses. Start free or book a demo to see the workflow end to end.
