
User Behaviour Analysis for B2B SaaS, A Practical Starter Framework
User behaviour analysis is how B2B SaaS teams turn raw product events into decisions that improve activation, retention, and revenue, without getting trapped in vanity dashboards. Done well, it answers specific questions like “where do users lose momentum?” and “which behaviors predict expansion?” and it does so with clear definitions, a minimal tracking plan, and repeatable analysis workflows.
- Define outcomes first (activation, retention, expansion), then map the smallest set of events needed to measure them.
- Start with one primary funnel, one retention view, and one pathing question, then iterate using hypotheses and experiments.
- Avoid tracking bloat and ambiguous event names by using a lean taxonomy, strict definitions, and routine data-quality checks.
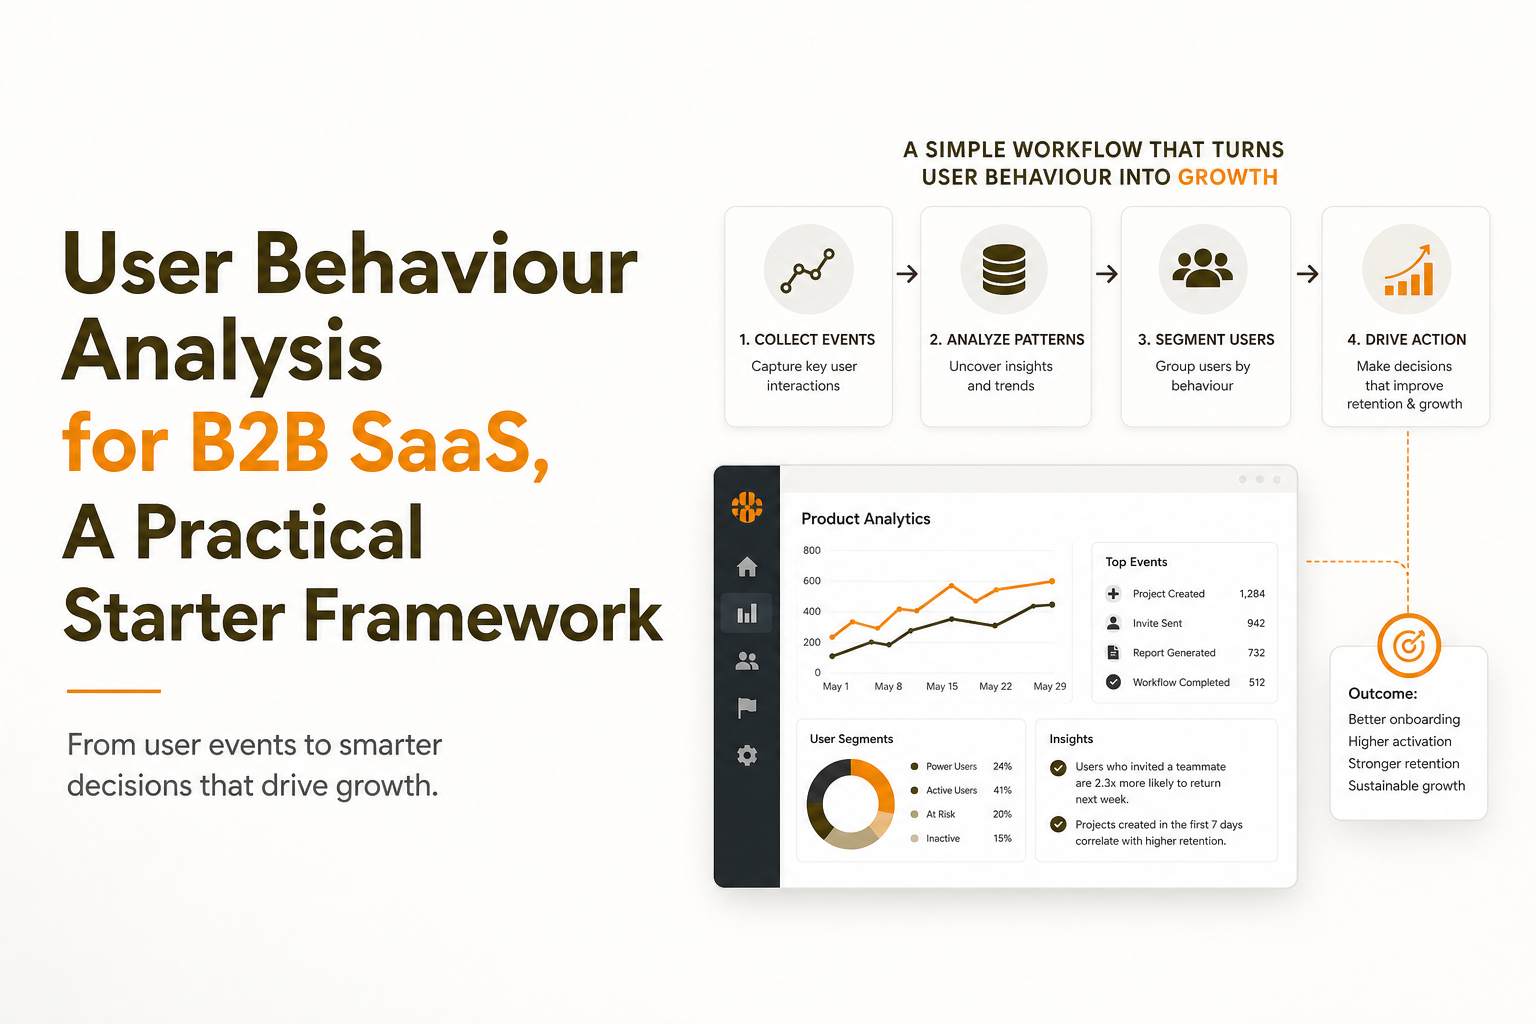
What user behaviour analysis means in B2B SaaS and what it is not
In B2B SaaS, user behaviour analysis is the practice of measuring what people do in your product (events and sequences of events) and connecting those behaviors to business outcomes. The output is not “more charts”, it is a short list of decisions: what to fix in onboarding, which feature to prioritize, which segment to re-engage, and what messaging to use in lifecycle campaigns.
What it is
- Behavior-first measurement: clicks, page views, feature interactions, and key workflow steps tied to a user or account.
- Outcome-linked: analysis is anchored to activation, retention, and revenue signals (upgrade, expansion, renewal risk).
- Diagnostic: it helps you find where momentum breaks, not just how many users you have.
What it is not
- Vanity metrics: total signups, total page views, and “time in app” without context rarely tell you what to do next.
- One-off reporting: a monthly KPI deck is not user behaviour analysis if it does not lead to hypotheses and experiments.
- Tracking everything: collecting thousands of events without definitions usually reduces trust and slows decisions.
A practical definition you can use internally
User behaviour analysis = Events + context + comparison + decision.
- Events: what happened (e.g., “Created project”).
- Context: who/which account, plan, role, source, and timing.
- Comparison: across cohorts (new vs returning, SMB vs mid-market, activated vs not).
- Decision: fix, ship, message, or experiment with a measurable success metric.
The starter framework from events to insights to decisions
This workflow keeps user behaviour analysis measurement-first and prevents “dashboard drift”. The goal is to get to one or two decisions per week, not to perfect instrumentation.
Step 1: Write one outcome statement per stage
Use outcomes that are observable in product data:
- Activation: “A new user reaches the first value moment within 24 hours.”
- Engagement: “An activated user repeats the core action 2+ times in week 1.”
- Retention: “An account returns and completes the core workflow in week 2.”
- Expansion: “An account adds seats or hits usage thresholds that correlate with upgrades.”
Step 2: Map the smallest measurable journey
Draw a 5 to 7 step journey from “first session” to “value moment”. Keep it concrete, like:
- Signed up
- Verified email
- Invited teammate (optional for self-serve)
- Connected data / integrated tool
- Created first artifact (project, workspace, dashboard)
- Ran the core action (export, publish, send, deploy)
After running a few onboarding audits, the pattern was clear: teams get stuck when the “value moment” is vague, so we force ourselves to name the exact event that proves value happened.
Step 3: Instrument events with strict definitions
For each step, define:
- Event name: verb + object (e.g., “Created workspace”).
- When it fires: server-side preferred for critical actions; client-side acceptable for UI interactions.
- Success criteria: what counts as completion (e.g., workspace must have at least 1 member).
- Required properties: plan, role, source, account_id, and any step-specific attributes.
Step 4: Build one primary funnel and one diagnostic slice
Start with a single funnel from signup to value. Then add one comparison view, such as:
- New users from paid search vs organic
- Users who invited a teammate vs solo users
- Accounts that reached value in day 0 vs day 7
For deeper guidance on diagnosing drop-offs, see funnel analysis.
Step 5: Turn a chart into a hypothesis and an experiment
Use a simple template:
- Observation: “55% drop between ‘Connected integration’ and ‘Created first artifact’.”
- Hypothesis: “Users do not understand what to create until they see a template.”
- Change: Add a guided template picker in onboarding.
- Success metric: +10% completion of “Created first artifact” within 24 hours.
- Guardrails: no increase in support tickets, no increase in time-to-value.
What to track first, a minimal event and property plan for user behaviour analysis
The fastest way to make user behaviour analysis useful is to start lean. Early-stage teams do best with 20 to 40 well-defined events, not hundreds. The plan below is a baseline you can adapt to most B2B SaaS products.
A minimal event taxonomy (start here)
Track events in five buckets. Each bucket should have 3 to 8 events max at the beginning.
- Acquisition and session: Signed up, Logged in, Viewed page (optional), Started trial.
- Onboarding progress: Completed checklist step, Connected integration, Imported data, Invited teammate.
- Core value actions: Created artifact, Ran core action, Shared/exported/published output.
- Habit signals: Returned (session start), Repeated core action, Used key feature X.
- Monetization: Viewed pricing, Started checkout, Upgraded plan, Added seats.
The user and account properties that matter most
Properties let you segment behavior without rebuilding tracking later. Keep them stable and business-relevant.
- User: role/persona (if known), job function (if captured), signup source, device type.
- Account: account_id, plan, industry, company size band, lifecycle stage (trial, paid), MRR band.
- Context: integration type, template chosen, team size, permission level.
Segmentation basics you should set up on day one
Segments are where user behaviour analysis becomes actionable. Start with three dynamic segments:
- New: first seen within last 7 days.
- Activated: completed your value moment event within a defined time window (e.g., 24 hours or 7 days).
- At-risk: previously activated but no core action in the last N days (choose N based on your product cadence).
If you want a practical framework for building segments that drive action, see user segmentation.
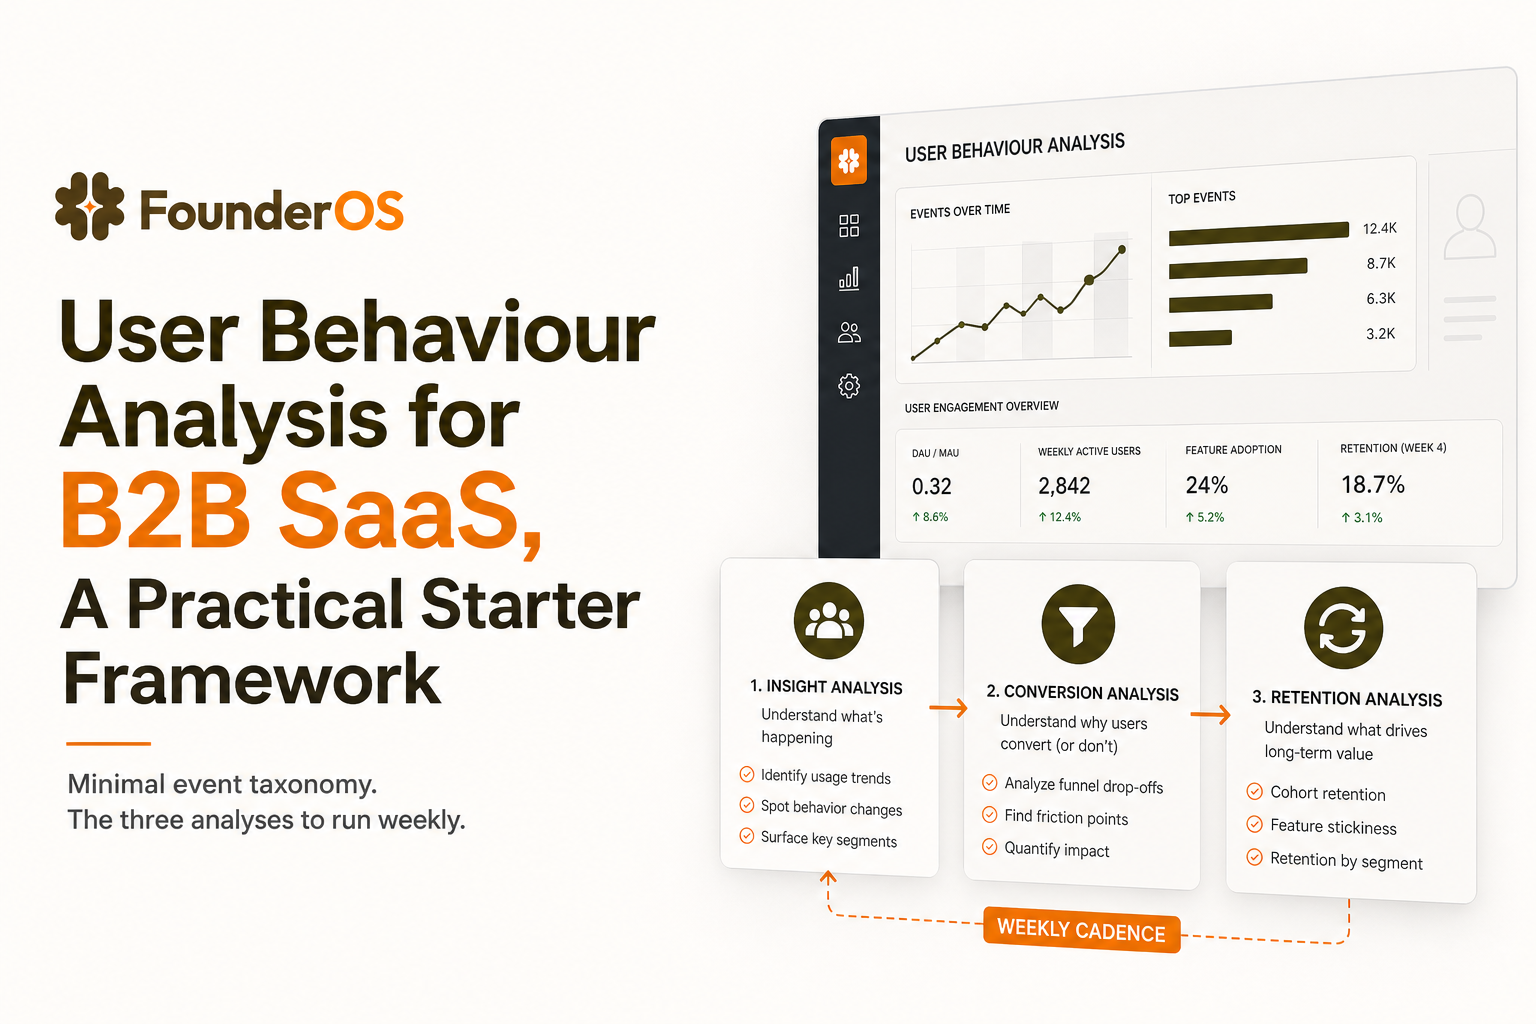
Core analyses that drive growth, funnels, cohorts, and paths
Once the basics are tracked, you only need a few analysis types to get most of the value. In our experience working with B2B SaaS founders, the highest ROI comes from repeating these three analyses weekly, then shipping one change tied to a measurable metric.
1) Funnel analysis to find the exact step that breaks
Build a funnel from “Signed up” to your value moment, then add one diagnostic split. A simple checklist:
- Use a time window (e.g., conversion within 24 hours for activation).
- Decide if steps must be in order (usually yes for onboarding).
- Compare at most 2 to 3 cohorts at a time to keep interpretation clean.
Pair this with event analytics patterns to ensure you are measuring actions that lead to revenue outcomes, not just clicks.
2) Cohort retention to verify you improved the right thing
Retention answers: “Do users come back and repeat the core behavior?” Use a retention table by signup week and define retention as “completed core action”. Two rules that prevent misleading results:
- Pick the right interval: daily for high-frequency tools, weekly for most B2B SaaS, monthly for long-cycle products.
- Measure behavior, not sessions: “did core action” is usually more meaningful than “opened app”.
For a reference point on retention definitions and metrics, Amplitude’s retention guide is a useful standard: retention metrics.
3) Pathing to discover what successful users do differently
Pathing is most useful when you start from a meaningful event and ask what happens next. Try these prompts:
- After activation: “What are the next 3 events for activated users?”
- Before churn risk: “What events typically happen before users go inactive?”
- Before upgrade: “Which feature events precede ‘Started checkout’?”
If you want to connect behavior to buying intent, this guide can help: how to identify high intent users in saas.
The biggest mistakes in user behaviour analysis and how to avoid them
Most teams do not fail at user behaviour analysis because they lack data. They fail because the data is inconsistent, the questions are unclear, or the analysis gets interpreted as causation.
Mistake 1: Tracking bloat (and no one trusts the data)
Symptom: hundreds of events, many duplicates, and dashboards that disagree.
Fix: keep a “north star” set of 20 to 40 events, and archive the rest. Use a simple governance rule: every new event must map to a decision and an owner.
Mistake 2: Ambiguous definitions (activation means five different things)
Symptom: product says activation is “created project”, marketing says it is “completed onboarding”, sales says it is “booked a call”.
Fix: define activation as a single observable value event, then create secondary metrics for supporting steps. Write the definition next to the dashboard.
Mistake 3: Data quality issues (missing IDs, double firing, timezone drift)
Symptom: funnels show impossible sequences, or conversion rates swing wildly after releases.
Fix checklist:
- Ensure every event has user_id and account_id (where applicable).
- Deduplicate critical events server-side where possible.
- Standardize timestamps to UTC and define how you handle late events.
- Run a weekly “event audit” on top 10 events by volume and top 10 by business importance.
Mistake 4: Confusing correlation with causation
Symptom: “Users who use Feature X retain better, so Feature X causes retention.”
Fix: treat the chart as a hypothesis, then test with an experiment (onboarding nudge, default setting, template) and measure lift. What surprised our team was how often “retention features” were simply markers of already-successful users, so we now validate with controlled rollouts whenever possible.
| Common pitfall | What it looks like | Practical prevention |
|---|---|---|
| Too many events | Dashboards multiply, decisions slow | Cap the core taxonomy and require an owner per event |
| Unclear activation | Teams optimize different “wins” | Single value event + supporting step metrics |
| Bad IDs and duplicates | Funnels do not make sense | Enforce user_id/account_id, dedupe, weekly audits |
| Correlation as causation | Roadmap driven by misleading charts | Turn insights into experiments with guardrails |
Turning insights into GTM and onboarding experiments
User behaviour analysis pays off when it changes what users see and what your team does. The simplest way to operationalize it is to run a weekly loop: diagnose, pick one hypothesis, ship one change, measure impact.
A weekly operating cadence (60 to 90 minutes)
- Review: primary activation funnel and retention cohort.
- Pick: one biggest drop-off step or one retention dip cohort.
- Investigate: 5 to 10 user journeys or event sequences around that step.
- Decide: one experiment with a clear success metric and guardrails.
- Ship: onboarding change, in-app message, lifecycle email, or product tweak.
Experiment ideas mapped to common findings
- Finding: users stall after “Connected integration”. Experiment: add a sample dataset or “next step” template that creates the first artifact automatically.
- Finding: solo users activate but do not retain. Experiment: prompt teammate invite after first success, measure week-2 retention lift.
- Finding: one acquisition channel has high signup but low activation. Experiment: adjust landing and onboarding copy to match the job-to-be-done, measure activation within 24 hours.
How to choose success metrics (so experiments do not lie)
- Primary metric: the step you are trying to move (e.g., value event completion within 24 hours).
- Secondary metric: downstream behavior (week-1 repeat core action).
- Guardrails: support volume, error rates, and time-to-value.
FAQ about user behaviour analysis
If you want to implement this workflow quickly, Founder OS can help you capture events, build funnels, and create behavior-based segments so you can move from user behaviour analysis to weekly onboarding and growth experiments without waiting on a data team.
Written by Ivy Tran
Founder of FounderOS, sharing practical insights on SaaS growth, product analytics, and user activation.
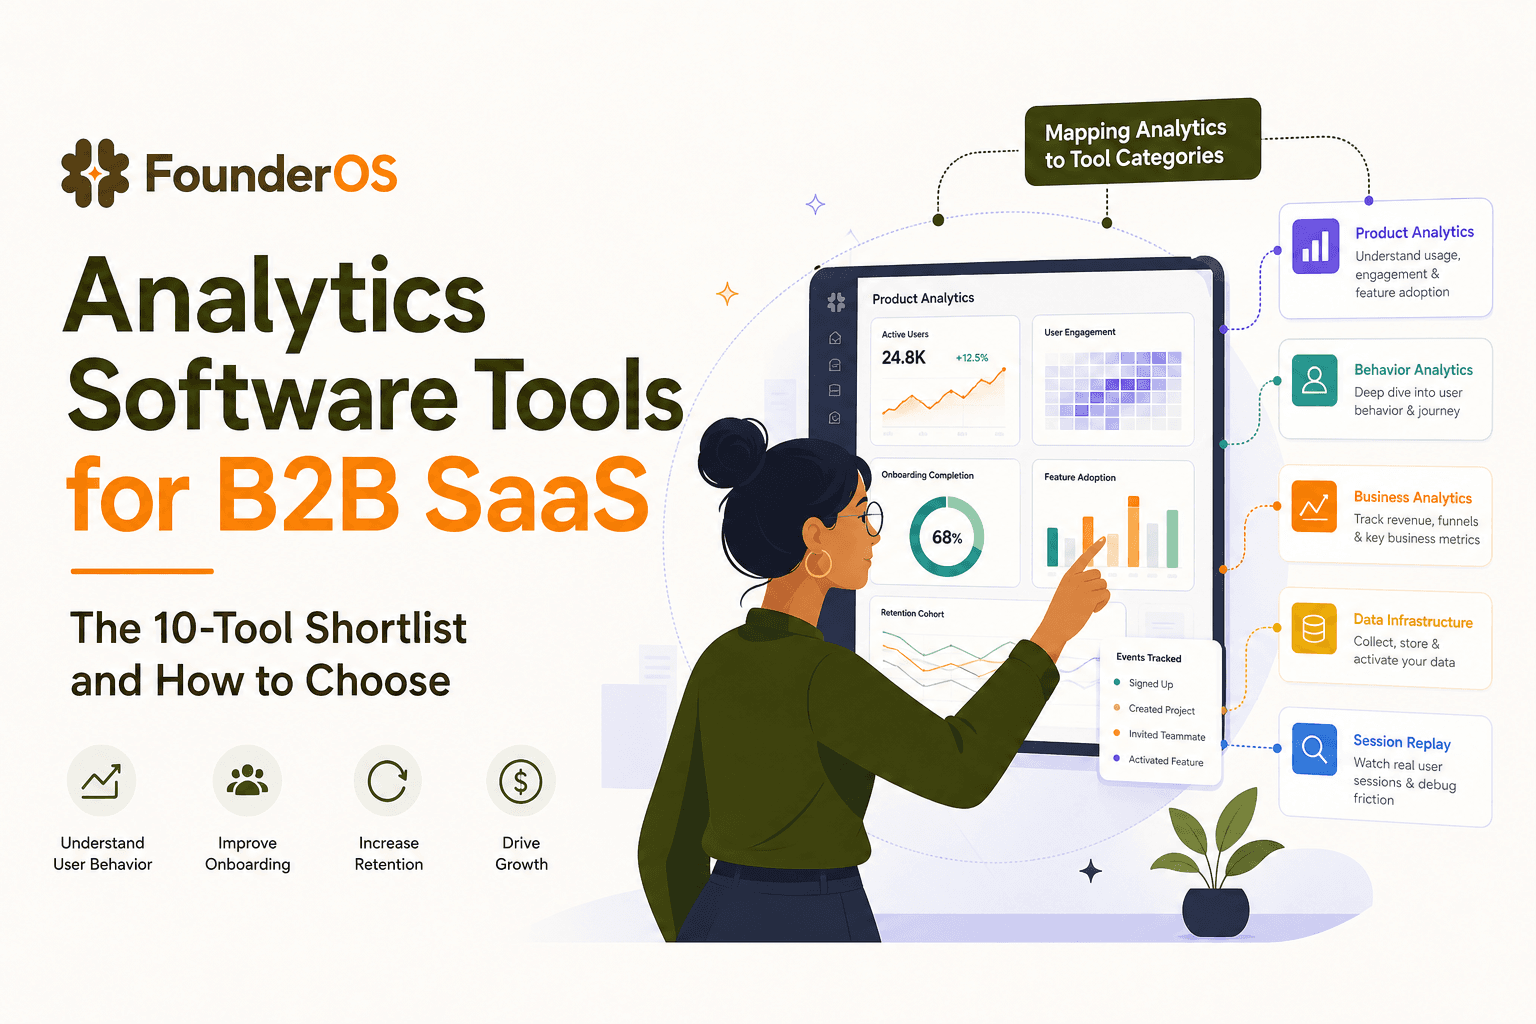
Analytics Software Tools for B2B SaaS - The 10-Tool Shortlist and How to Choose
A BOFU-ready shortlist of analytics software tools for B2B SaaS: 10 picks across categories plus a buyer rubric and rollout plan.

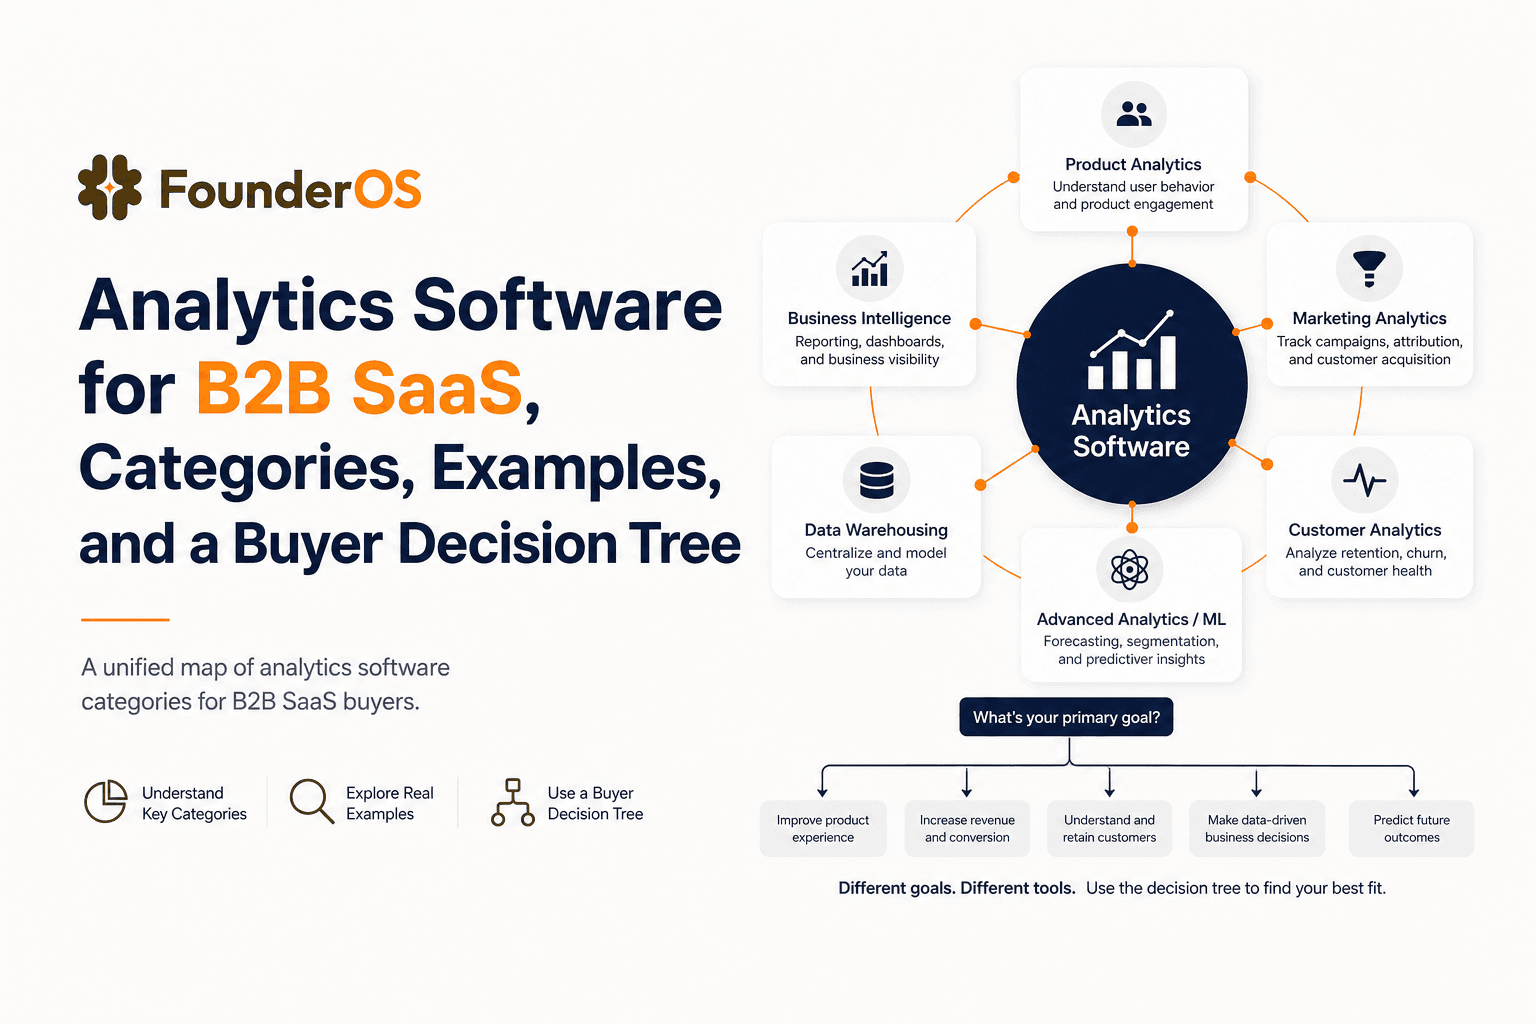
Analytics Software for B2B SaaS, Categories, Examples, and a Buyer Decision Tree
Choose analytics software for B2B SaaS with a clear category map, 10-minute decision tree, real workflows, and a practical buyer checklist.
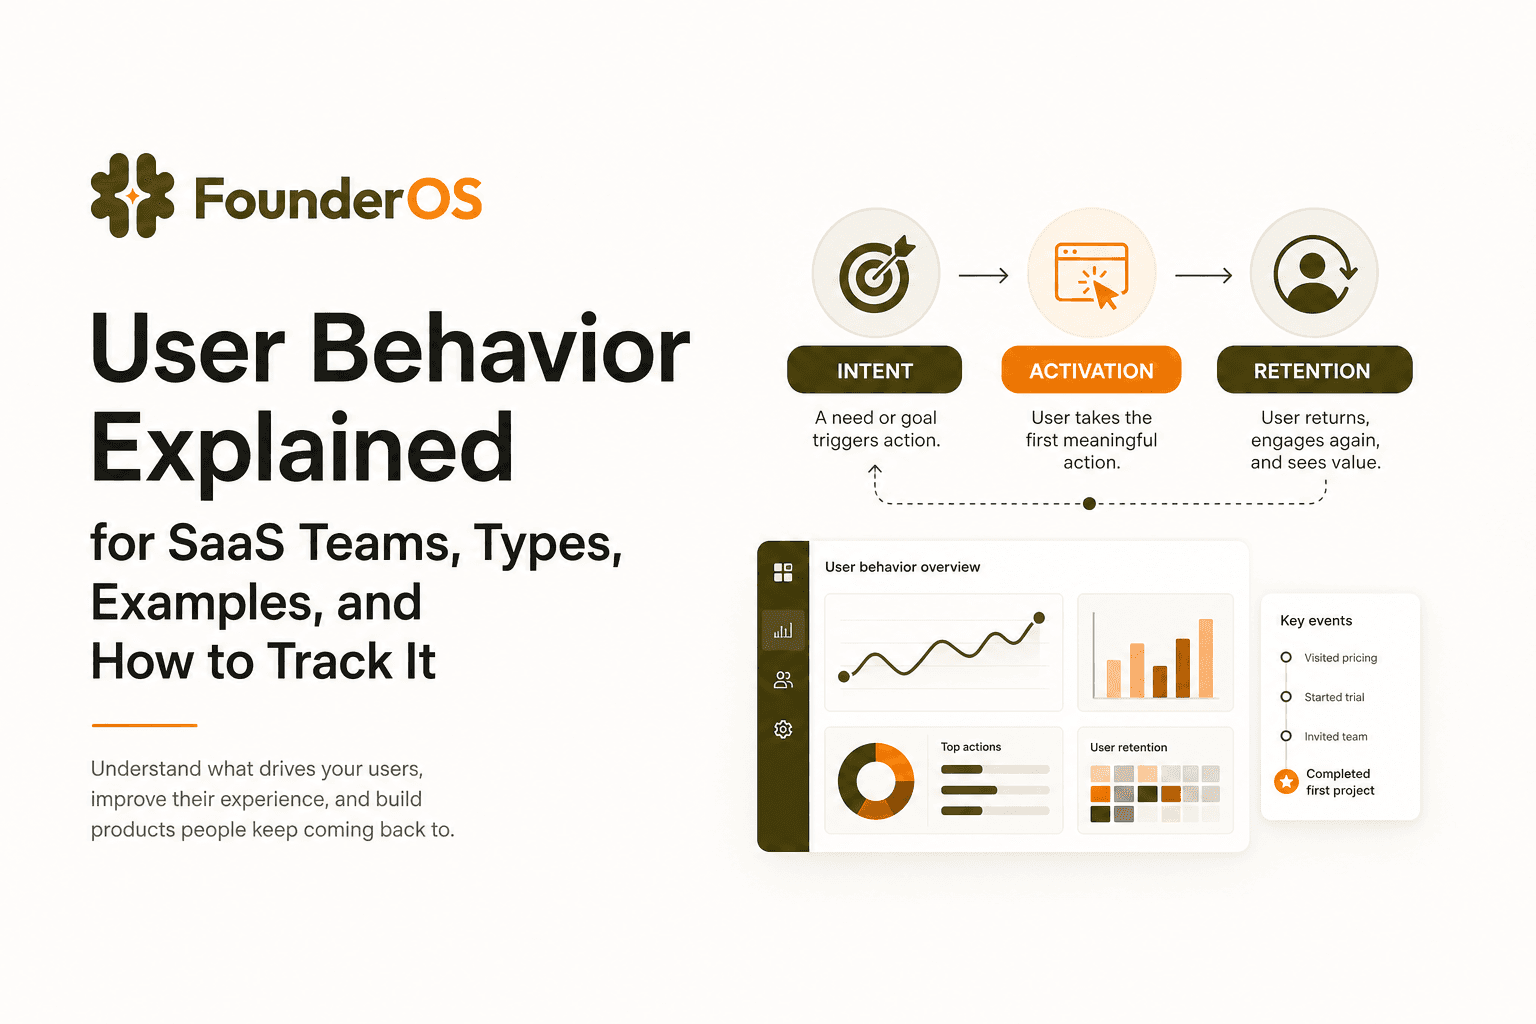
User Behavior Explained for SaaS Teams, Types, Examples, and How to Track It
Learn what user behavior means in SaaS, the key types, and a practical event tracking playbook to turn user behavior into product decisions.