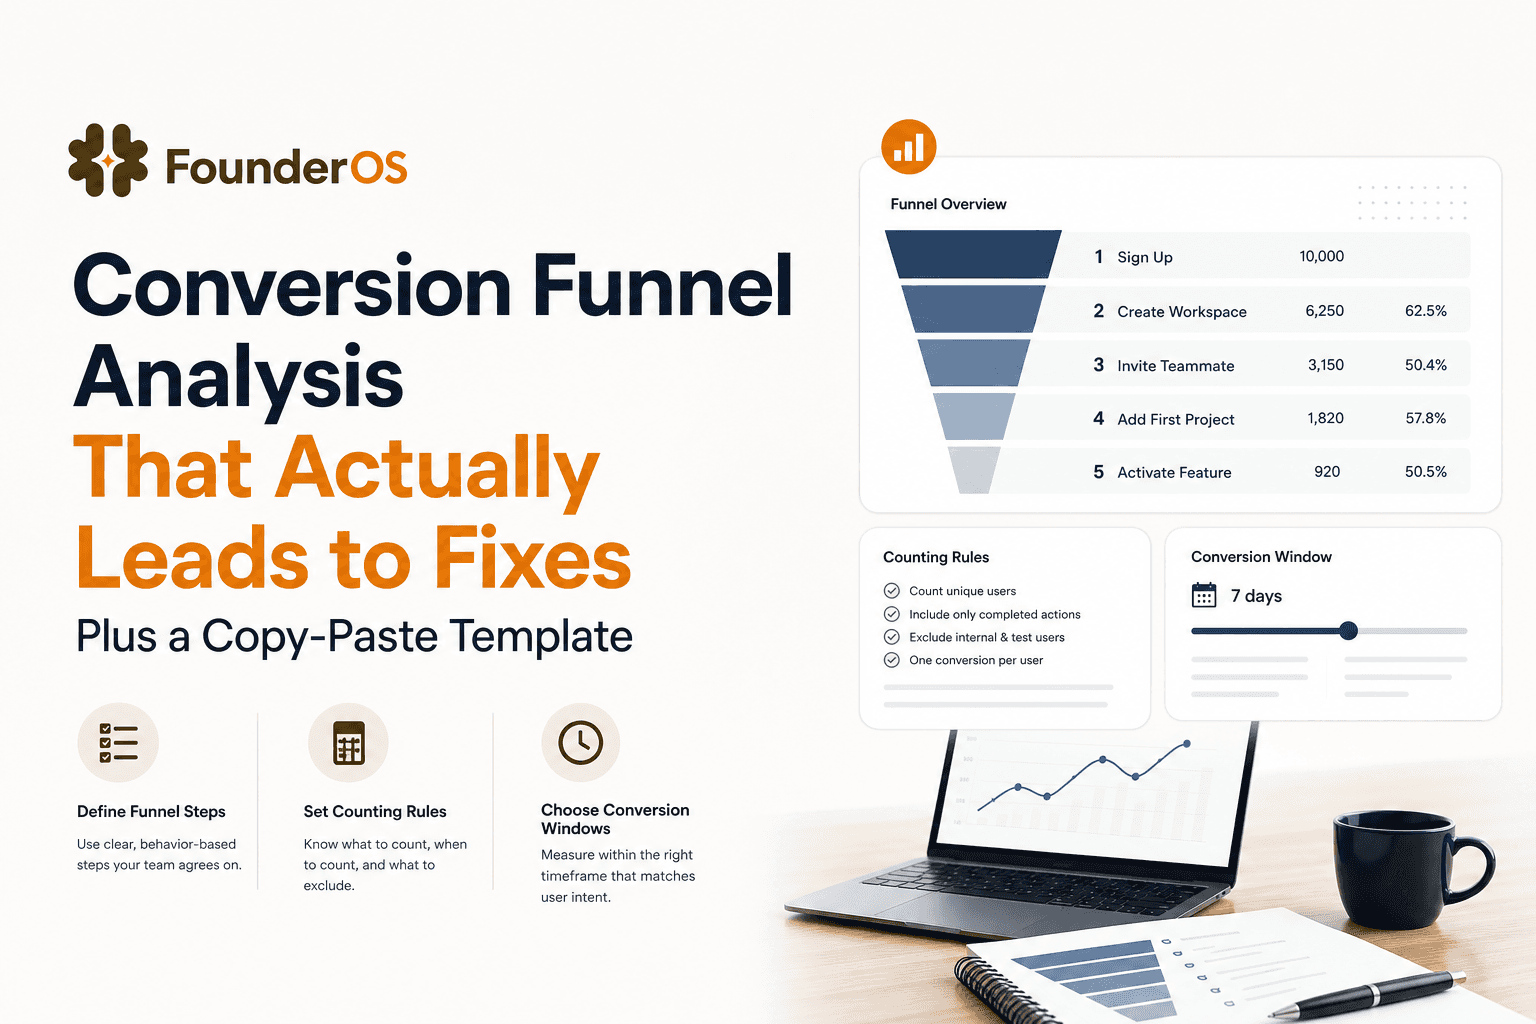
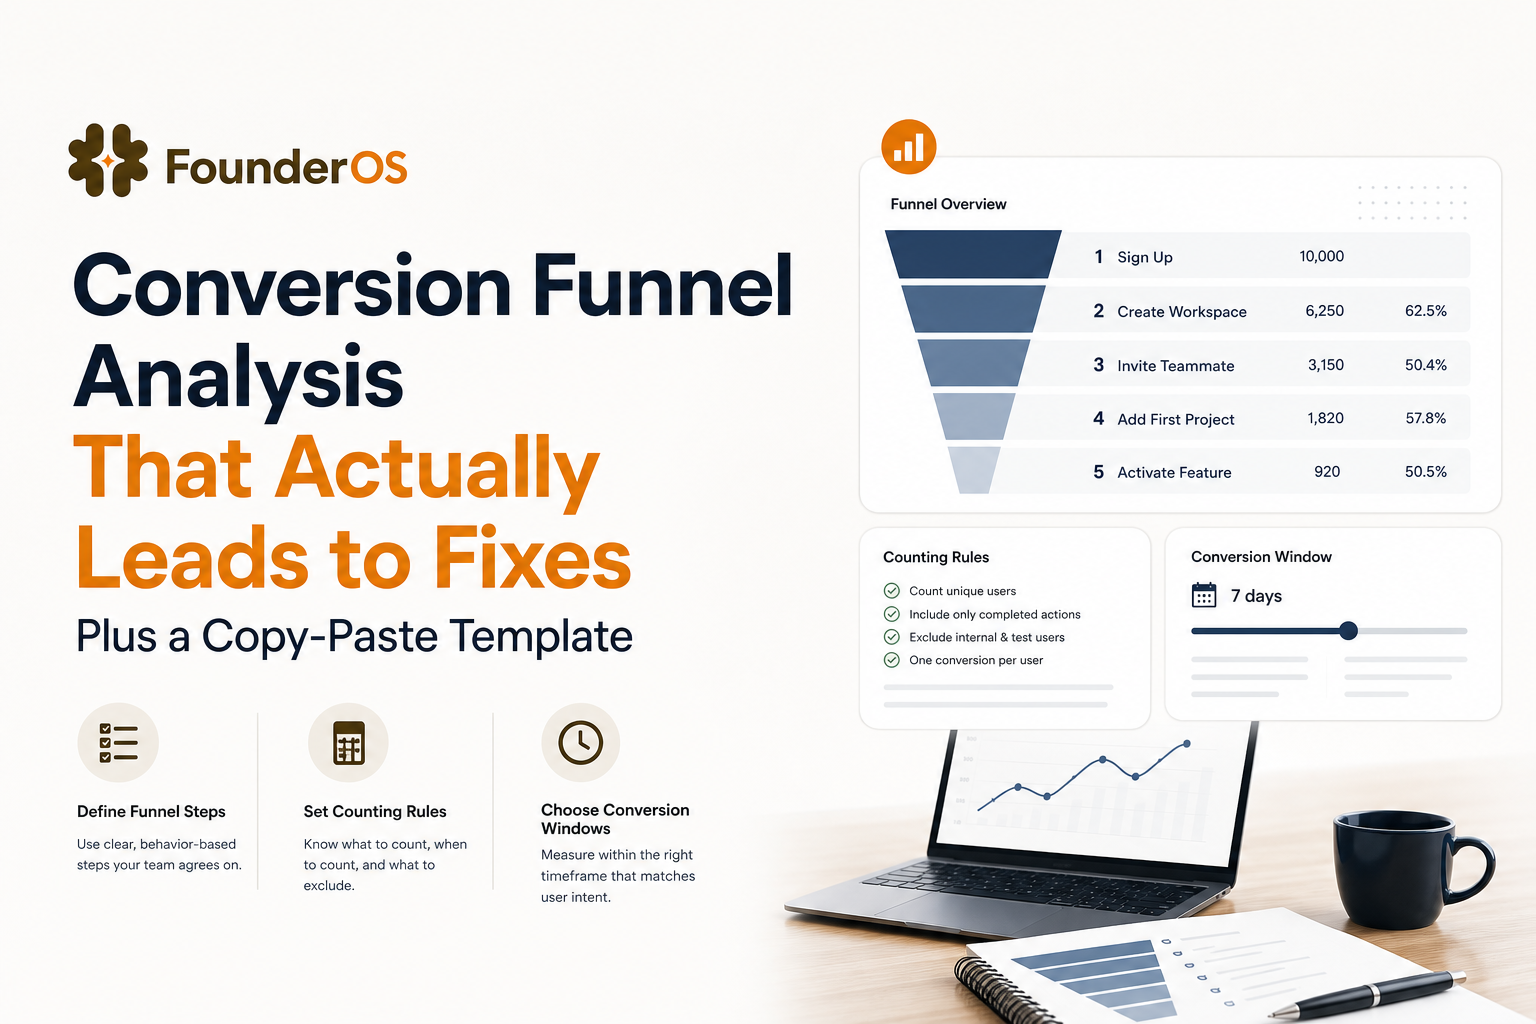
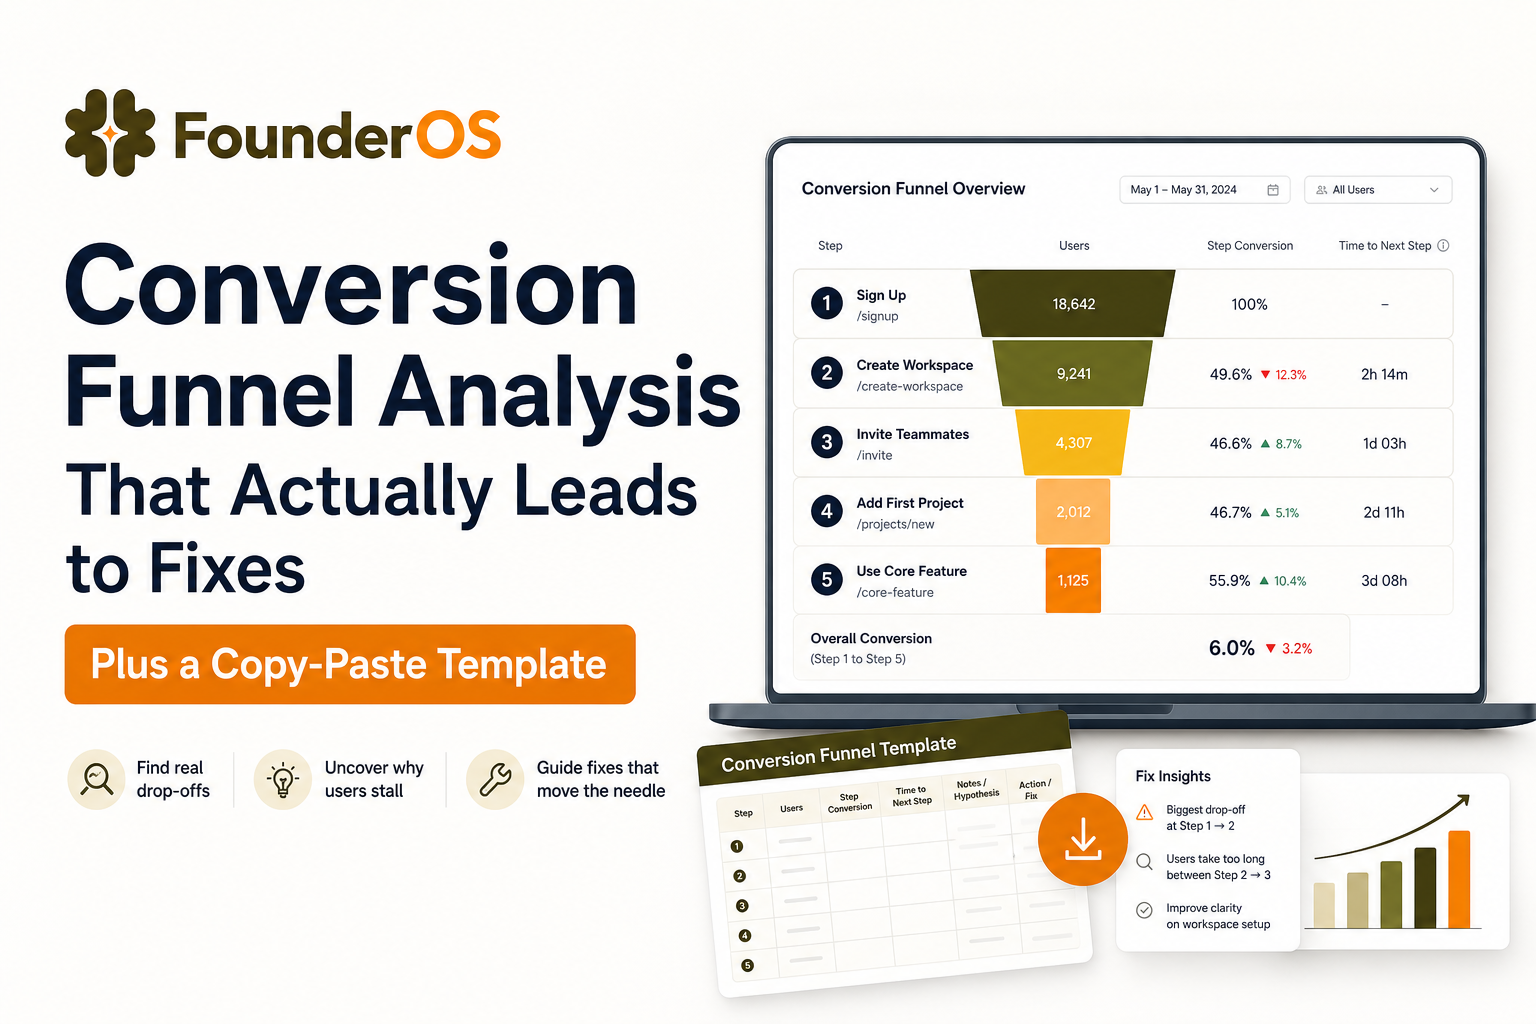
Conversion Funnel Analysis That Actually Leads to Fixes Plus a Copy-Paste Template
Conversion funnel analysis sounds simple until two people on your team build the “same” funnel and get different numbers. This guide gives you a practical, beginner-friendly way to do conversion funnel analysis that avoids counting traps, clarifies what steps to use, and turns drop-offs into a short list of next actions.
- Pick funnel steps based on one measurable user promise (not a generic model) and write each step as an event plus a counting rule.
- Make your results trustworthy by standardizing ordering, uniques vs totals, and a conversion window before you interpret drop-offs.
- Turn drop-offs into decisions using a simple diagnostic tree and a template you can reuse every time.
Conversion Funnel Analysis Explained Without Confusing It With “The Funnel”
What it is (and what it is not)
Conversion funnel analysis is the method of measuring how many people move through a defined sequence of steps, where they drop off, and how long it takes them to progress.
- It is: a measurement and diagnosis workflow (define steps, count consistently, compare segments, decide actions).
- It is not: a universal “one true funnel” model. Your steps are a hypothesis about how users reach value in your product.
The 3 questions it answers (use these to keep scope tight)
- Where is momentum breaking? Which step has the biggest absolute drop-off and which has the worst step conversion rate (CVR)?
- Who is struggling? Which cohort, channel, persona, plan, or device shows abnormal drop-off?
- Why now? Did this change after a release, pricing change, traffic shift, or onboarding update?
Minimum viable funnel analysis deliverable
A useful output of conversion funnel analysis is not a dashboard. It is a one-page brief with:
- Funnel definition (events, ordering, counting rules, window)
- Baseline results (counts, step CVR, time-to-convert)
- 1 to 3 prioritized actions with owners and expected impact
A Simple Conversion Funnel Framework to Pick the Right Stages for Your Business
Start from one “value promise” and work backward
If you try to copy a generic model, you will argue about labels instead of fixing conversion. Instead, write one sentence:
“A new user gets value when they __________ within __________.”
Examples:
- “...invites 2 teammates within 24 hours.”
- “...connects a data source and runs their first report within 30 minutes.”
- “...publishes their first project and shares it with a client within 7 days.”
That sentence determines the last step of your funnel. Then you work backward to the smallest set of prerequisites.
Selection matrix to choose steps (use 4 criteria)
Use this matrix to decide whether a candidate step belongs in your funnel. Keep steps that score “Yes” on at least 3 of 4.
- Necessary: Without it, users cannot reach the value promise.
- Observable: You can track it as an event or a reliable property change.
- Actionable: If drop-off happens here, you can change UI, messaging, targeting, or onboarding to improve it.
- Non-redundant: It is not just a duplicate of another step (for example, “Visited dashboard” and “Viewed dashboard page” may be the same thing).
Recommended step count and how to avoid “funnel bloat”
- 3 to 6 steps for a first pass. More steps can be useful, but only after your counting rules are stable.
- Prefer user actions over page views when possible (for example, “Created project” beats “Visited create page”).
- One step should map to one product decision. If you cannot name the decision, remove the step.
How to Run Conversion Funnel Analysis Step by Step Including Windowing and Counting Rules
Step 1: Write event definitions as contracts
For each step, write an “event contract” so everyone measures the same thing:
- Event name (for example,
signup_completed) - Trigger (what user action causes it)
- Required properties (for example,
plan,source,workspace_id) - Exclusions (internal users, QA traffic, bots)
If you are new to this, start with a small, high-signal event set and expand later. For deeper context on instrumentation tradeoffs, see event analytics.
Step 2: Choose your counting rule (uniques vs totals)
Most conversion funnel analysis should use unique users (or unique accounts) per step to avoid inflated counts from repeated actions.
- Use unique users when: you care about progression (activation, onboarding, trial conversion).
- Use totals when: you care about volume outcomes (number of reports generated, number of invites sent).
Pick one “unit of conversion” and keep it consistent across steps:
- User-level: best for self-serve products
- Account/workspace-level: best for team products where one admin completes setup
- Lead/opportunity-level: best when CRM stages define conversion
Step 3: Set ordering rules (strict vs flexible)
Decide whether steps must occur in order:
- Strict order: Step B must happen after Step A. Use this for onboarding sequences.
- Flexible order: Steps can occur in any order, but all must happen. Use this for “setup checklist” funnels.
Write the rule explicitly in your funnel definition so results are reproducible.
Step 4: Set a conversion window (and why it changes your numbers)
A conversion window is the maximum time allowed for a user to move from the first step to the last step. Without it, funnels can look “better” simply because you wait long enough.
- Good defaults: 24 hours for first-session activation, 7 days for trial activation, 14 to 30 days for sales-assisted conversion.
- Rule of thumb: Set the window to match your product’s expected time to value, not your billing cycle.
Step 5: QA your funnel before you interpret it
Use this quick QA checklist:
- Sample 20 users who “converted” and confirm their event sequence makes sense in session replays or raw logs.
- Check duplicates: Are events firing twice (double-clicks, retries, SPA route changes)?
- Check missing properties: If 30% of events lack
source, channel comparisons will lie. - Check identity: Are anonymous and logged-in users stitched correctly?
If you want a deeper diagnostic workflow, this guide on funnel analysis can help you structure investigations.
Copy-Paste Conversion Funnel Analysis Template and How to Fill It In
Template layout (spreadsheet-ready)
Copy this into a spreadsheet. Each row is one funnel step.
- Funnel name
- Unit (user, account, lead)
- Step #
- Step label
- Event name
- Event properties required
- Counting rule (unique unit per step, first occurrence only)
- Ordering rule (strict or flexible)
- Conversion window
- Step users (N)
- Step CVR (formula)
- Cumulative CVR (formula)
- Median time from previous step
- Top drop-off hypothesis
- Next action (experiment or fix)
- Owner
Formulas (copy-paste)
- Step CVR:
=IFERROR(StepN / StepN-1, "") - Cumulative CVR:
=IFERROR(StepN / Step1, "") - Drop-off count:
=StepN-1 - StepN
Interpretation prompts (so the template produces decisions)
- If Step CVR is low, is it intent mismatch (wrong users) or friction (right users, blocked)?
- If median time is high, is it confusion, dependency (needs data/team approval), or low urgency?
- What is the smallest change that could move this step by 10% relative?
Worked Example for a SaaS Trial Funnel With Segmentation and Next Actions
Funnel definition
Value promise: “A new trial user gets value when they create a workspace, connect a data source, and generate their first report within 7 days.”
Unit: account (workspace). Window: 7 days. Ordering: strict.
Baseline funnel results (example numbers)
- Step 1: Trial started (N=1,000 accounts)
- Step 2: Workspace created (N=820) Step CVR: 82%
- Step 3: Data source connected (N=410) Step CVR: 50%
- Step 4: First report generated (N=205) Step CVR: 50%
- Cumulative conversion to value: 20.5%
Time-to-convert and what it suggests
- Median time Step 1 to 2: 3 minutes (low friction)
- Median time Step 2 to 3: 18 hours (high friction or dependency)
- Median time Step 3 to 4: 12 minutes (good once connected)
The bottleneck is Step 2 to 3. Conversion funnel analysis suggests the “connect data source” experience is the primary lever.
Segment breakdown (two cuts that usually reveal the truth)
Cut #1: acquisition source.
- Paid search: Step 2 to 3 CVR = 38%
- Referrals: Step 2 to 3 CVR = 61%
Cut #2: company size (self-reported or enriched).
- 1 to 10 employees: Step 2 to 3 CVR = 56%
- 200+ employees: Step 2 to 3 CVR = 29%
Interpretation: larger companies may face security reviews, permissions, or longer internal coordination. This is where user segmentation turns a single funnel into multiple, more actionable funnels.
Three prioritized next actions (tied to the bottleneck)
- Reduce dependency friction: add a “request access” path during connection with a pre-filled email to IT/admin. Success metric: +10% relative lift in Step 2 to 3 for 200+ employee segment.
- Improve clarity: replace generic errors with specific permission and whitelist guidance. Success metric: reduce median time Step 2 to 3 from 18 hours to 6 hours.
- Route high-friction accounts to help: trigger an in-app prompt offering setup help after 2 failed connection attempts. Success metric: +5% absolute lift in cumulative conversion to Step 4.
Note how each experiment has a segment, a step metric, and a time metric. That is how conversion funnel analysis becomes an execution plan, not a report.
Diagnose Drop-Off Patterns and Choose the Right Fixes
A decision tree you can use in every funnel review
- Is drop-off concentrated in one segment?
- Yes: fix targeting, messaging, or segment-specific friction first.
- No: proceed.
- Is time-to-next-step short or long?
- Short (minutes): likely confusion, UI friction, missing affordances, or technical errors.
- Long (hours/days): likely dependency, low urgency, unclear value, or requires data/team input.
- Is the step optional in real life?
- Optional: remove it from the “core” funnel and track it as a secondary behavior.
- Required: proceed.
- Does the step represent “work” or “reward”?
- Work step: simplify, prefill, automate, provide templates.
- Reward step: make it more visible, celebrate it, and guide users to it faster.
Common drop-off patterns mapped to fixes
- Big drop right after signup: mismatch between acquisition promise and first-run experience. Fix: landing page alignment, first-run checklist, clearer first task.
- Slow progression with moderate drop: unclear priority or dependency. Fix: reminders, calendar scheduling, “send to teammate” handoffs, setup concierge for larger accounts.
- High conversion but low retention later: activation does not match real value. Fix: redefine activation event and align onboarding with the behavior that predicts retention. (See user activation.)
Tools and Data Sources How Web Analytics Product Analytics and CRM Fit Together
Which tool answers which question
- Web analytics (for example GA4): acquisition paths, landing page performance, form starts vs submits.
- Product analytics: in-app behavior sequences, feature adoption, activation funnels, cohort comparisons.
- CRM: lead stages, opportunity progression, revenue attribution, sales cycle length.
What features matter for trustworthy conversion funnel analysis
- Flexible funnel builder with strict ordering and window controls
- Identity resolution (anonymous to logged-in, user to account)
- Drill-down to user-level evidence so you can validate why users dropped
- Segment comparisons that do not require SQL for basic cuts
A practical workflow that avoids data fights
- Use web analytics to define “entry cohorts” (by source, landing page, campaign).
- Use product analytics to run the core conversion funnel analysis and isolate the bottleneck step.
- Use CRM to validate downstream impact (do improved activations correlate with more qualified opportunities or faster closes?).
If you need a reference for standard event naming and governance, the analytics community often points to consistent tracking plans like Segment’s guidance on tracking plans: Creating a Tracking Plan.
| Data source | Best for | Typical funnel steps | Common pitfall |
|---|---|---|---|
| Web analytics | Pre-signup behavior | Landing view → pricing view → form submit | Over-counting due to sessions/devices and ad blockers |
| Product analytics | In-app activation and adoption | Signup → key setup → first value action | Ambiguous event definitions and missing identity stitching |
| CRM | Revenue and pipeline progression | Lead → qualified → opportunity → closed won | Stage hygiene issues and delayed updates |
FAQ
How many steps should a funnel have for conversion funnel analysis?
Start with 3 to 6 steps. Fewer steps hide where friction occurs, and more steps usually introduce tracking ambiguity. Add steps only when you can name a decision you will make from each step’s metric.
What conversion window should I use?
Use a window that matches your expected time to reach first value. Common starting points are 24 hours for first-session activation and 7 days for trial activation. Keep the window fixed when comparing week over week.
Should I count users, accounts, or sessions?
Pick the unit that matches how value is realized. Use users for individual workflows, accounts for team products where one person sets up for many, and avoid sessions for core conversion funnels because session definitions vary across tools.
How do I turn drop-offs into a prioritized roadmap?
Rank steps by (1) absolute drop-off count, (2) step CVR, and (3) business impact of that step. Then validate with segment cuts and time-to-next-step. Choose 1 to 3 experiments that target the single biggest bottleneck first.
If you want to implement this workflow quickly, Founder OS helps you track the full user journey, build reliable funnels with clear drop-offs, and drill into real user behavior so your conversion funnel analysis ends in concrete fixes, not debates. Start free or book a demo when you are ready.
