
Product Onboarding for B2B SaaS, A Measurement-First Framework for Activation
Learn product onboarding as a measurable system: activation metrics, event tracking, funnels, and a 1-week framework to improve time-to-value.
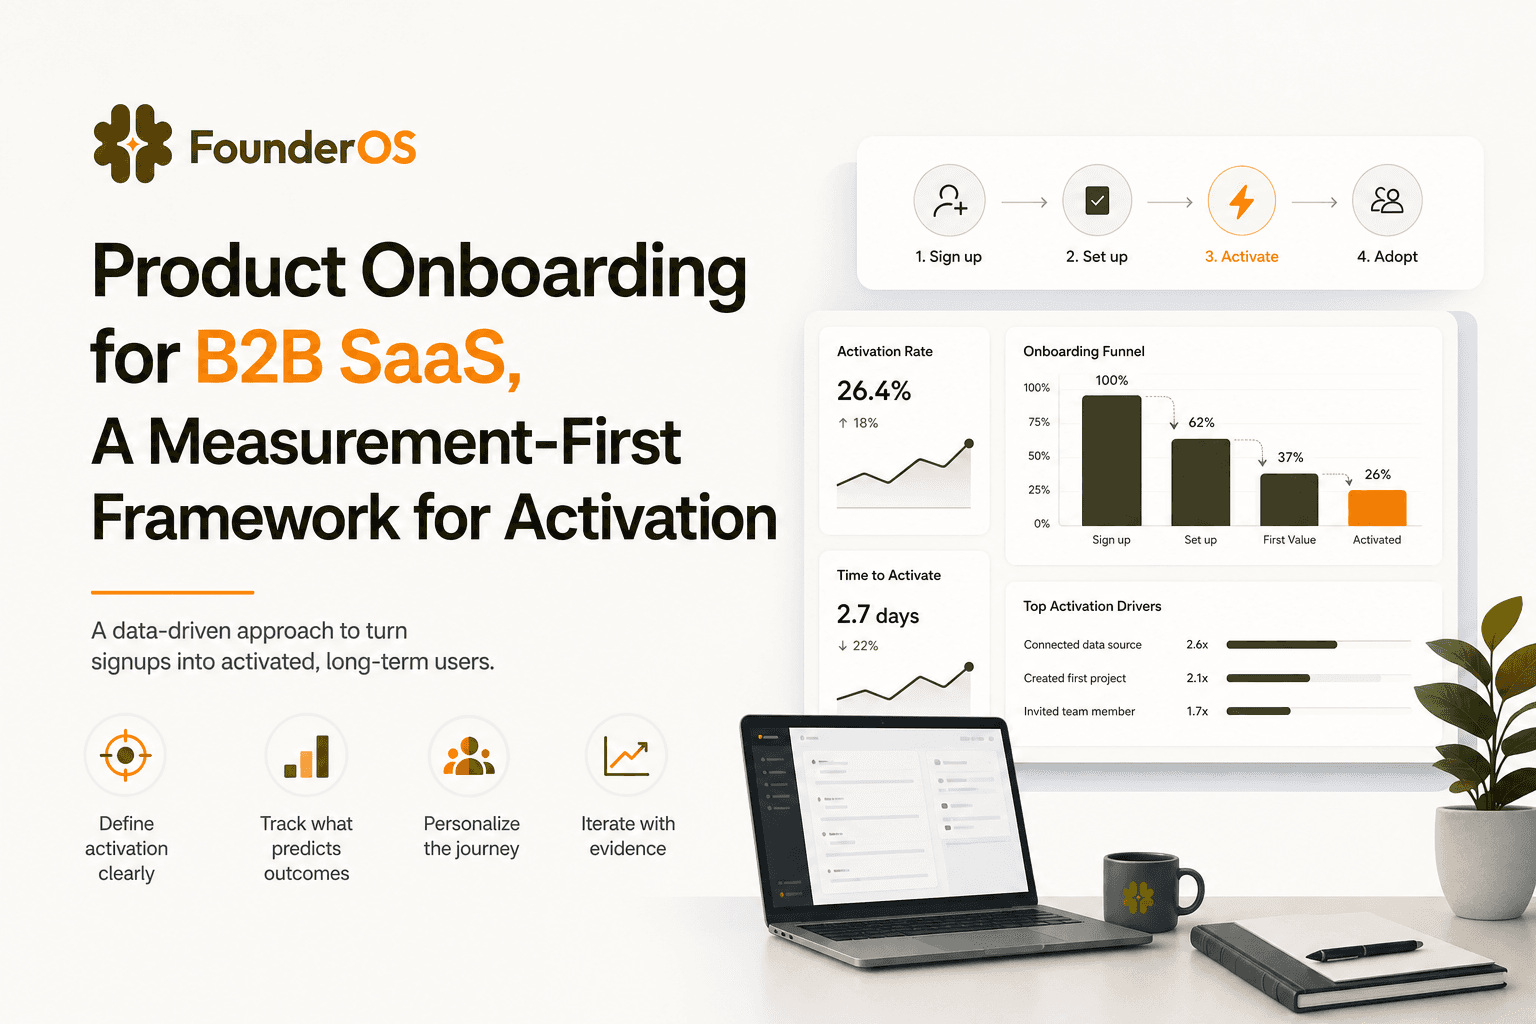
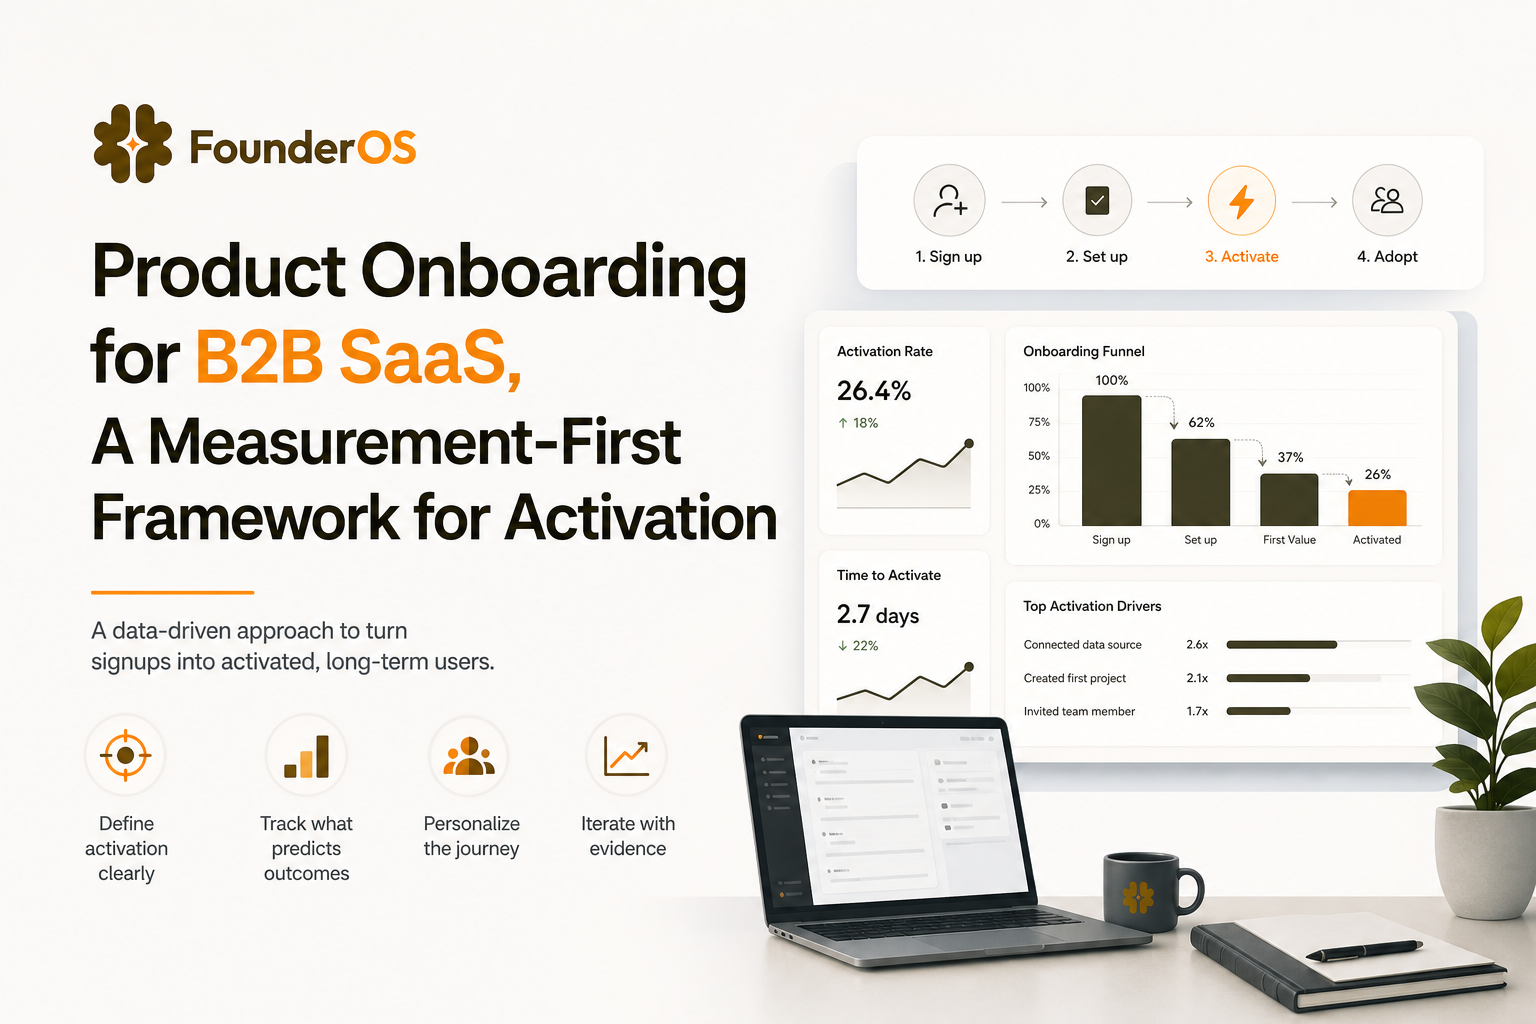
In B2B SaaS, product onboarding should not be a one-time UI tour you ship and forget. The teams that grow treat product onboarding as a measurable growth system: define the activation moment, instrument the journey with events and funnels, and iterate based on where users actually drop off.
- Define onboarding by an activation outcome (not tour completion) and separate “setup” from “time-to-value.”
- Measure product onboarding with a small set of metrics: activation rate, time-to-value, step conversion, early retention, and expansion signals.
- Use a minimum viable event taxonomy plus a single primary funnel, then segment by intent to find the real blockers.
What Product Onboarding Really Means in B2B SaaS
Most onboarding debates get stuck on UI patterns: checklists vs tours vs modals. But product onboarding is the system that moves a new account from “signed up” to “consistently receiving value” with as little friction and confusion as possible. In B2B, that value often depends on setup work (inviting teammates, connecting data, configuring permissions) and a first successful workflow (creating the first report, shipping the first campaign, closing the first ticket).
Define onboarding by a job-to-be-done, not by screens
A practical definition: onboarding is complete when the user can reliably accomplish their first meaningful job-to-be-done (JTBD) inside your product. That JTBD should be phrased like a before/after outcome, not a feature action.
- Weak: “User created a project.”
- Better: “User created a project and invited collaborators.”
- Best: “User set up a project that produces a shareable output their team uses.”
Separate setup from activation (they are not the same)
Setup is the work required to make value possible. Activation is the first moment value is realized. Treating setup as the goal is one of the fastest ways to inflate “completion” while leaving activation flat.
Use this simple split to keep everyone aligned:
- Setup steps: connect integrations, configure workspace, import data, set roles, invite teammates.
- Activation steps: run the first workflow that produces an outcome the user cares about (a decision, a deliverable, a result).
A quick checklist to sanity-check your onboarding definition
- Can you describe the activation moment in one sentence?
- Does the activation moment happen inside the product (not only in email or a call)?
- Would a user pay for the product if they repeatedly achieved that moment?
- Can you detect it with events (not a subjective survey alone)?
The Onboarding Metrics That Matter and How to Measure Them
If you only measure “tour completion,” you will optimize for the wrong behavior. A measurement-first approach ties product onboarding to outcomes: activation, time-to-value, retention, and eventually revenue. The goal is not to track everything, but to track the few signals that let you diagnose where momentum breaks.
Core onboarding metrics (definitions you can implement)
- Activation rate: % of new signups that reach your defined activation event within a time window (commonly 7 or 14 days).
- Time-to-value (TTV): median time from signup to activation event. Median is usually more stable than average.
- Step conversion: % of users who move from step N to step N+1 in your onboarding path (measured via a funnel).
- Early retention: % of activated users who return and perform a key action in week 2 or week 4 (pick one, then standardize it).
- Expansion readiness: a behavioral signal that predicts upgrade (for example: invites sent, seats used, integrations connected, usage threshold reached).
How to connect onboarding to retention and revenue without overcomplicating analytics
Start with a single “activation cohort” and compare it to everyone else. If activated users retain 2x better in week 4, you have proof that product onboarding is a growth lever, not a cosmetic project. Then add one expansion proxy that makes sense for your pricing model.
When we audited onboarding for multi-seat B2B products, the strongest early revenue predictor was often not “feature clicks,” but collaboration signals like invites sent or roles configured, because those actions correlate with internal adoption and renewal risk.
A measurement template you can copy
- Activation event: ________
- Activation window: 7 / 14 / 30 days
- Primary onboarding funnel: Signup → Step A → Step B → Activation
- Early retention definition: Returned in week 2 and did ________
- Expansion proxy: Did ________ within 30 days
A Simple Product Onboarding Framework You Can Implement in a Week
The fastest way to improve product onboarding is to stop trying to perfect everything at once. Pick one activation moment, design the shortest path to it, then remove friction with targeted experiments. Here is a week-long framework that keeps scope realistic for a small team.
Step 1: Choose one activation moment (and make it measurable)
Pick a single activation event that is both valuable and frequent enough to optimize. Good activation events are usually a combination of actions, not one click. Examples:
- “Created first dashboard AND connected a data source.”
- “Invited 1 teammate AND assigned a role.”
- “Published first asset AND received first view.”
Step 2: Map the shortest path (3 to 5 steps max)
Write the minimum steps required to reach activation. If you need more than 5 steps, you likely mixed “nice-to-have education” into “must-have progress.” A simple mapping format:
- Entry: signup complete
- Prerequisite: workspace created
- Prerequisite: data/integration connected
- Value action: user completes first workflow
- Confirmation: user sees a result they can use or share
Step 3: Remove friction with one constraint per step
For each step, choose one constraint to eliminate. Constraints typically fall into four buckets:
- Clarity: user does not understand why this step matters.
- Effort: too many fields, decisions, or dependencies.
- Trust: user hesitates to connect data or invite teammates.
- Timing: you ask for commitment before value is visible.
What surprised our team was how often a “missing why” outperformed UI polish as a fix: adding a one-sentence value explanation next to an integration step reduced drop-off more than rearranging the form.
Step 4: Add one guided nudge, not a full tour
Use lightweight guidance that moves users to the next step: a contextual tooltip, a checklist item that unlocks, or a single in-app prompt triggered by behavior. If you want a deeper structure, start from an onboarding checklist that adapts to what the user has already done, rather than a fixed sequence.
Step 5: Ship two experiments and measure the funnel impact
In a week, you can usually ship two meaningful tests: one clarity fix (copy, examples, defaults) and one effort fix (reduce fields, defer decisions, auto-detect). The key is to measure step conversion and time-to-value before and after, not just clicks on the guidance.
Instrument Onboarding With Event Tracking and Funnels Without Getting Lost
Instrumentation is where teams either get leverage or get stuck. The goal is minimum viable tracking that answers: “Where do users drop off, and which users are most affected?” You do not need a perfect schema to start improving product onboarding, but you do need consistency.
Minimum viable event taxonomy for product onboarding
Use three event types and keep naming consistent:
- Account lifecycle:
signup_completed,workspace_created,trial_started - Onboarding steps:
integration_connected,teammate_invited,first_workflow_completed - Value confirmation:
report_shared,export_created,alert_configured
Attach a small set of properties that help you segment later (plan, role, acquisition source, company size, integration type). Avoid adding 30 properties “just in case.”
Set up one primary funnel, then add one diagnostic funnel
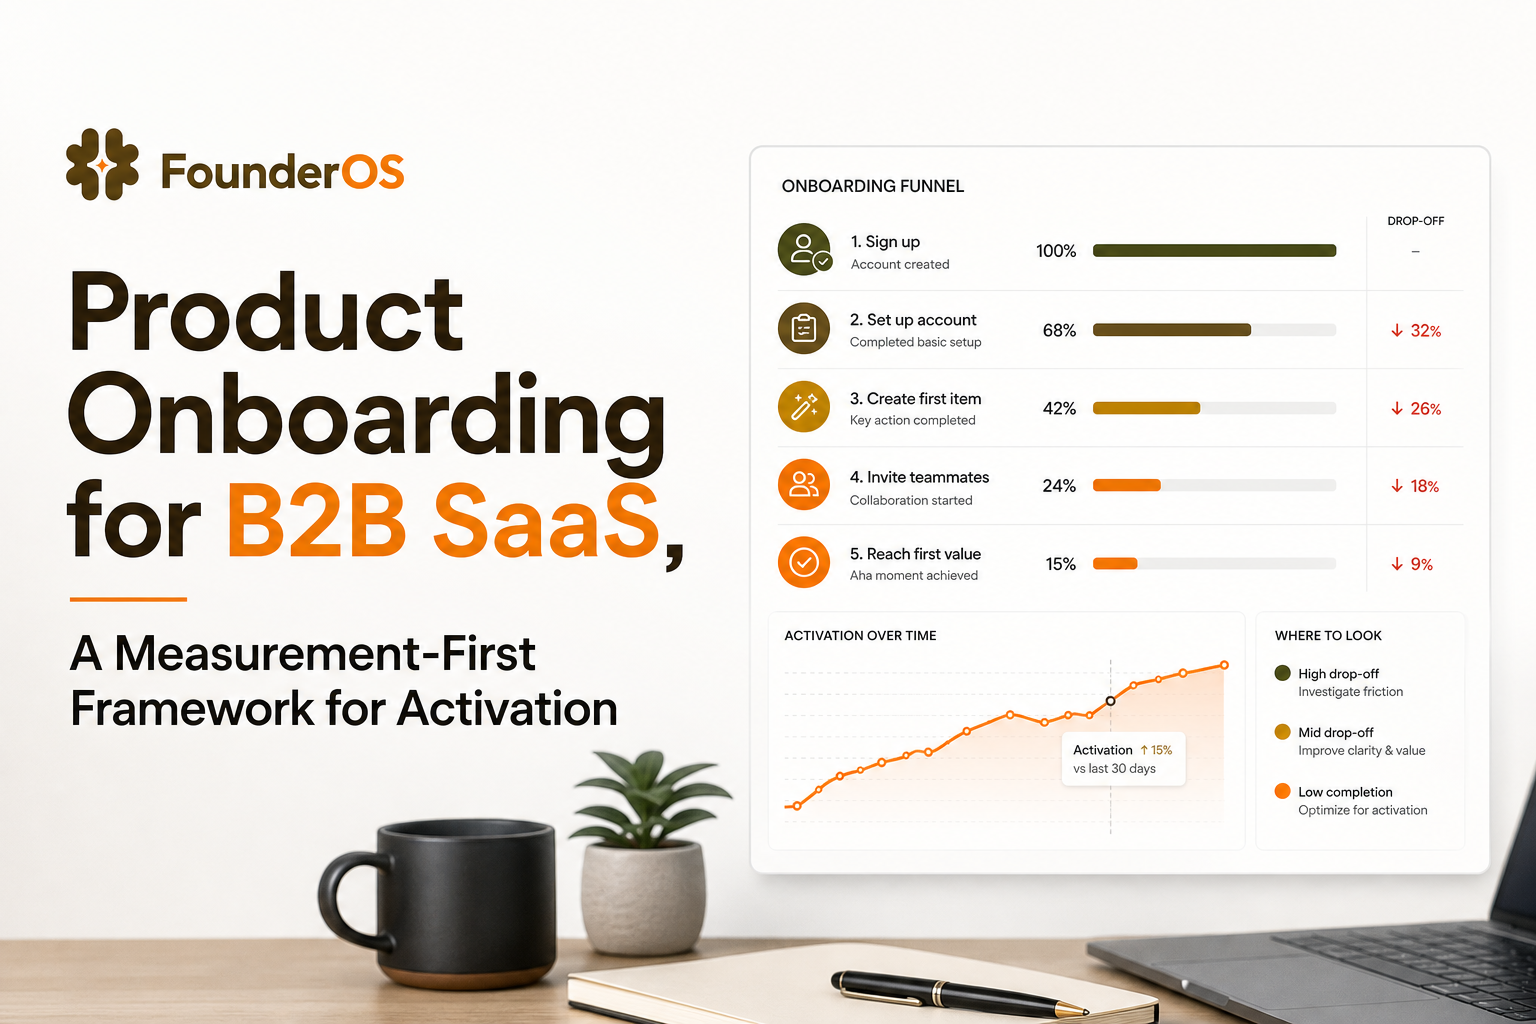
Start with a primary onboarding funnel that matches your 3 to 5 step path. Then create one diagnostic funnel for the biggest drop-off step, drilling into what happens immediately before and after that step (for example: viewed integration screen → clicked connect → auth success → first data synced).
Segment by intent, not just demographics
Segmentation is where onboarding insights become actionable. Instead of only segmenting by company size, segment by behaviors that indicate intent:
- High intent: visited pricing, invited teammate, attempted integration
- Explorers: browsed docs, clicked around, no setup started
- Blocked: repeated errors, auth failures, bounced on a specific step
If you want to go deeper on designing the in-app journey itself, this framework on onboarding flows pairs well with event-based segmentation.
Common tracking mistakes that break onboarding analysis
- Measuring page views instead of outcomes: “visited onboarding page” is not a step.
- Inconsistent event names:
integration_connectvsconnected_integrationfragments your funnel. - Missing identity stitching: anonymous events never connect to the user profile, so your funnel is incomplete.
- No timestamp discipline: time-to-value becomes meaningless if events fire late or inconsistently.
The Most Common Onboarding Failure Patterns and Fixes
Once you can see step conversion, the same failure patterns show up across many B2B SaaS categories. The fix is usually not “add more education,” but “reduce uncertainty and effort at the moment it matters.”
Failure pattern 1: Unclear value before a high-friction step
Symptom: users bounce when asked to connect data, invite teammates, or configure permissions.
Fix checklist:
- Add a one-sentence “why this matters” directly next to the action.
- Show what the user gets immediately after completion (preview, sample output, or example).
- Offer a safe path: sandbox mode, read-only connection, or sample data.
Failure pattern 2: Too many steps before the first win
Symptom: long onboarding sequences with low time-to-value and high drop-off on step 2 or 3.
Fix checklist:
- Cut or defer non-essential fields and decisions.
- Auto-detect defaults (timezone, role, templates) where possible.
- Move “education” after the first win, not before it.
Failure pattern 3: Wrong timing for prompts (interrupting the workflow)
Symptom: users dismiss tours and modals, then never return to the key action.
Fix checklist:
- Trigger guidance after a relevant behavior, not on first login.
- Use behavior triggers tied to intent signals (attempted integration, created first item, visited a key page twice).
- Cap interruptions: one prompt per session until the user progresses.
Failure pattern 4: One-size-fits-all onboarding for different roles
Symptom: admins, operators, and executives see the same path, so nobody gets a fast win.
Fix checklist:
- Ask one role question (or infer role from behavior) and branch the checklist.
- Personalize the first recommended workflow by use case.
- Create role-based activation events if needed (but keep one primary KPI).
How to Turn Onboarding Data Into Iteration Loops That Improve Revenue
Product onboarding improvements compound when you run them as a loop: measure, diagnose, change one thing, and re-measure. The missing link for many teams is connecting onboarding cohorts to revenue signals so the roadmap prioritizes what actually drives growth.
Build a weekly onboarding iteration loop (60 minutes)
- Review: activation rate, time-to-value, and primary funnel step conversion.
- Pick one drop-off: choose the biggest absolute loss of users (not the biggest percentage).
- Inspect sessions: watch 5 to 10 real user paths or event sequences around that step.
- Ship one fix: clarity or effort, not both, so the result is attributable.
- Annotate and compare: check the funnel impact in 7 days.
After running onboarding audits across multiple products, the pattern was clear: teams improved faster when they limited themselves to one primary onboarding funnel and one experiment per week, because the signal stayed clean and the iteration cadence stayed realistic.
Translate onboarding behavior into PQL and lead scoring inputs
You do not need a complicated model to start. Pick 3 to 5 behaviors that correlate with long-term usage and assign simple weights. Example scoring inputs:
- Activation achieved: +50
- Integration connected: +20
- Invited teammate: +15
- Returned in week 2: +20
- Error loop detected: -10 (route to support or success)
Then route high-scoring accounts to sales or success, and route blocked users to targeted help. This is where onboarding stops being “product-only” and becomes a coordinated growth system.
Use cohorts to prioritize what to fix
Not all drop-offs are equal. Compare funnels for:
- High-intent vs low-intent users
- By acquisition source (some channels bring mismatched expectations)
- By role (admins vs end users)
If you see that high-intent users drop off at the same step, that step is likely a true product blocker worth prioritizing. If only low-intent users drop, the fix might be messaging or qualification, not product complexity.
| Onboarding signal | What it usually means | Best next action |
|---|---|---|
| High funnel drop-off at integration connect | Trust or effort barrier before value | Add “why this matters,” offer sample data, reduce required fields |
| Activation achieved but low week-2 retention | Value not repeatable or not habitual | Create a second-win prompt and a weekly reminder tied to outcomes |
| Fast time-to-value but no expansion proxy | Solo usage, weak internal adoption | Nudge collaboration: invites, roles, shared outputs |
| Many users repeat the same error event | Broken setup path or unclear requirements | Improve error messaging, add validation, route to support |
FAQ about product onboarding
What is the difference between product onboarding and customer onboarding?
Product onboarding is the in-app journey that leads users to activation and repeatable value. Customer onboarding is broader and can include sales handoff, implementation, training, and success workflows. In B2B SaaS, they should share the same activation definition and metrics, even if different teams own parts of the process.
What is a good activation metric for product onboarding?
A good activation metric is a measurable event (often a combination of events) that indicates the user achieved first value. It should correlate with retention, be achievable within a short window (7 to 14 days for many products), and be hard to “game” with empty clicks.
How many events do I need to track to measure onboarding?
Start with 10 to 20 events: a few lifecycle events, 3 to 5 onboarding step events, and 2 to 4 value confirmation events. Add properties only when they enable a decision, like segmenting by role or integration type.
How do I improve product onboarding without building a huge tour?
Pick one activation moment, map a 3 to 5 step path, then add one contextual nudge triggered by behavior. Iterate weekly using funnel step conversion and time-to-value, and use segmentation to focus on high-intent users first.
If you want to implement measurement-first product onboarding quickly, Founder OS combines event tracking, user profiles, segmentation, and funnel analysis so you can see drop-offs and iterate onboarding guidance based on real behavior, not assumptions.
Read Next
View all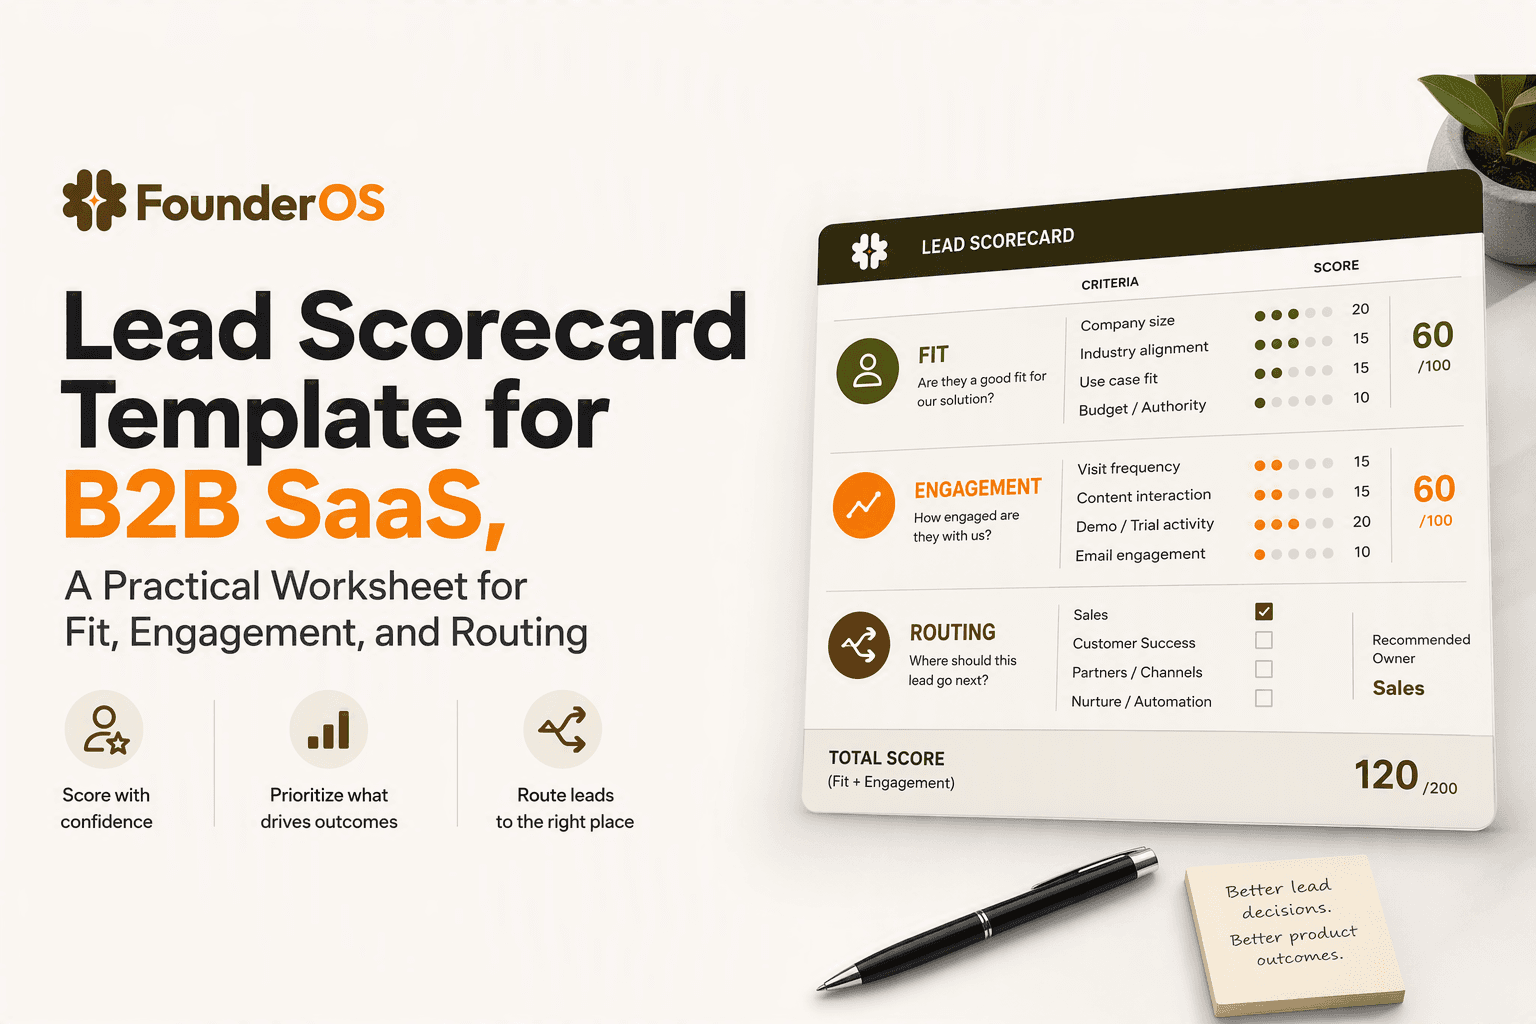
Lead Scorecard Template for B2B SaaS, A Practical Worksheet for Fit, Engagement, and Routing
Build a lead scorecard for B2B SaaS with fit, engagement, negative signals, scoring rules, and routing steps.
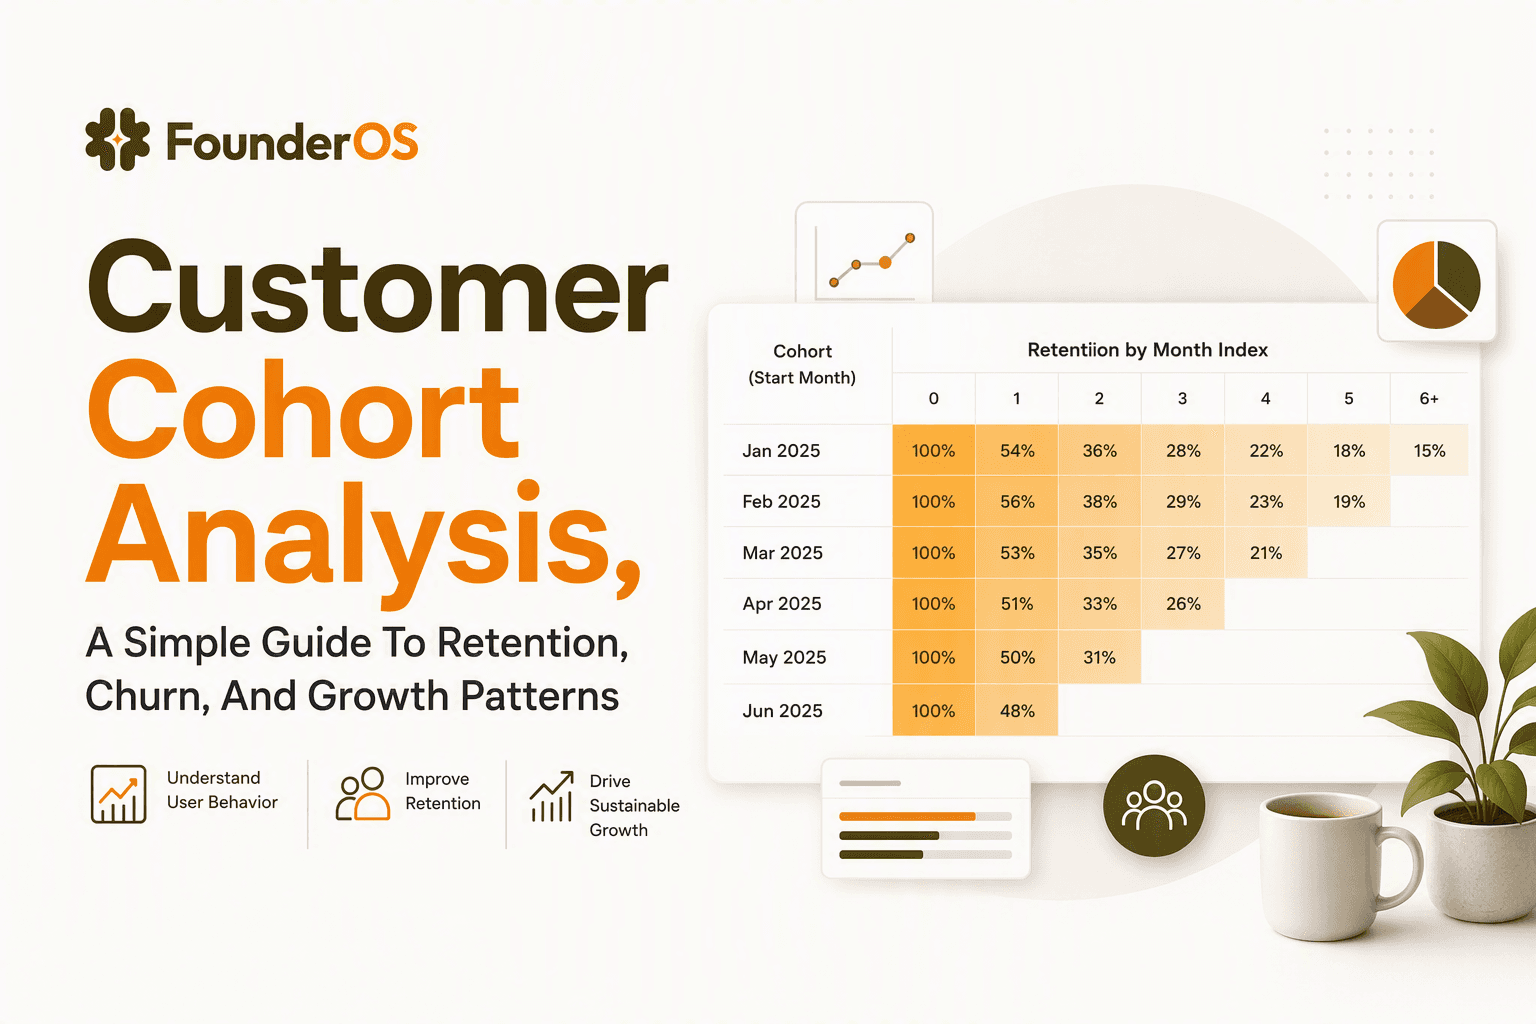
Customer Cohort Analysis, A Simple Guide To Retention, Churn, And Growth Patterns
Learn customer cohort analysis with a simple framework, how to read cohort tables, and a copyable spreadsheet template for retention and churn.
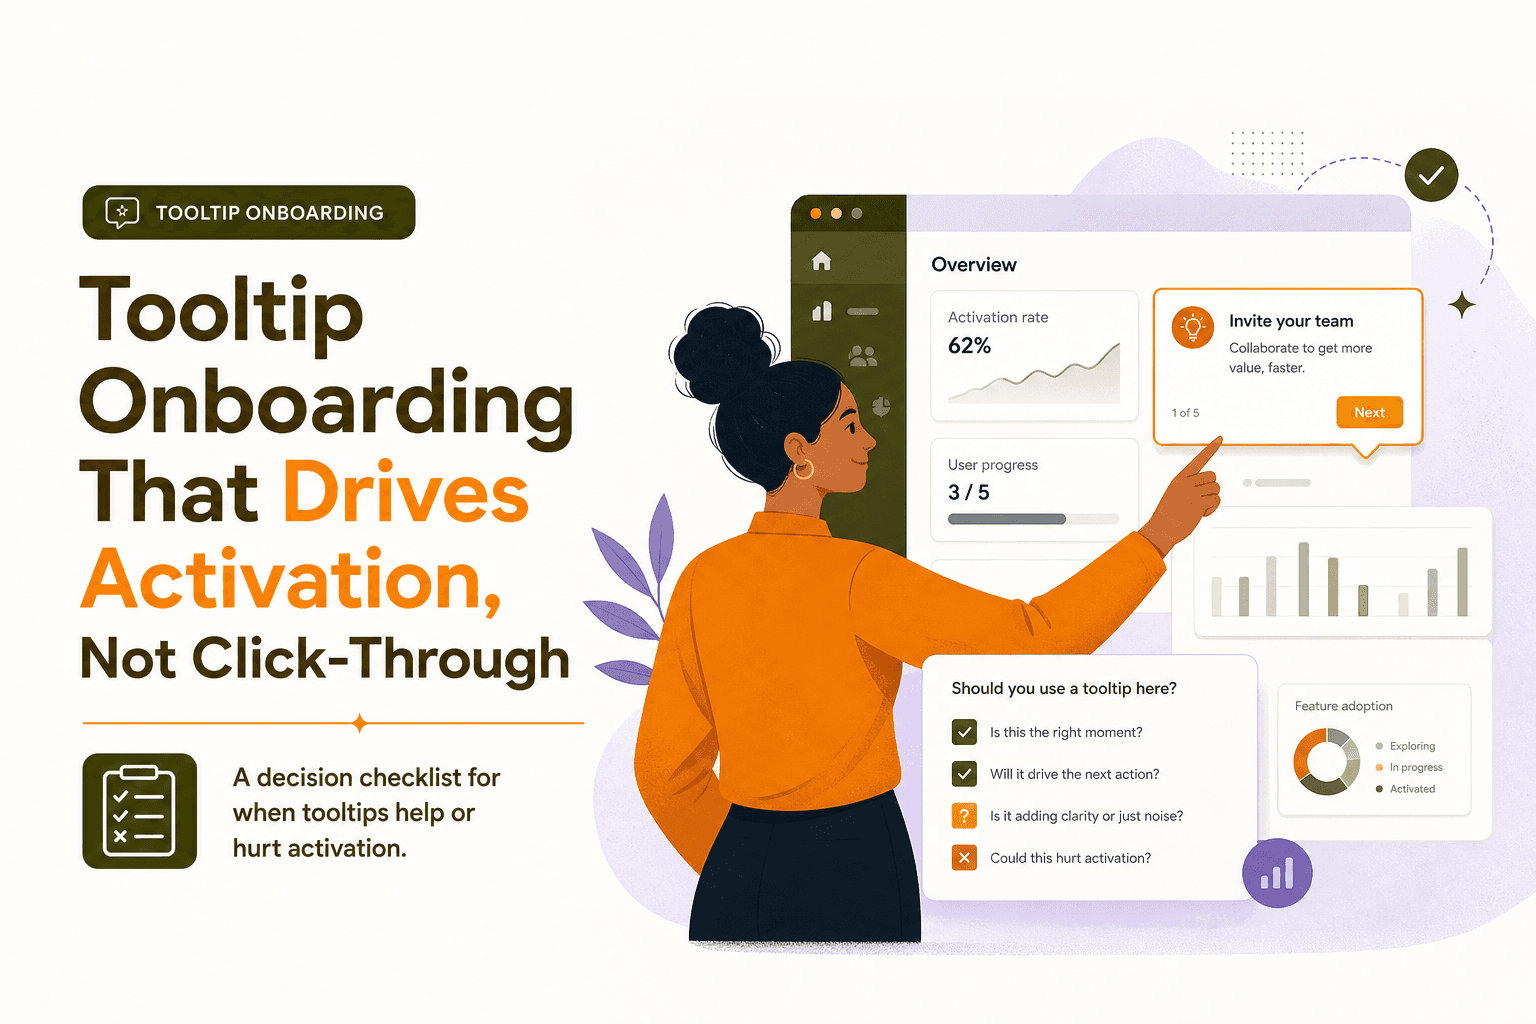
Tooltip Onboarding That Drives Activation, Not Click-Through
Learn tooltip onboarding that changes user behavior: when to use tooltips, a Trigger-Promise-Proof framework, and a measurement plan.