
Sales Funnel Optimization for B2B SaaS, A Measurement-First Playbook
Sales funnel optimization in B2B SaaS often fails for one simple reason: teams try to “improve conversion” without measuring the full journey from first touch to product value to revenue. If your CRM stages look healthy but pipeline quality is drifting, or activation is improving but sales outcomes are flat, you need a measurement-first playbook that connects marketing, sales, and product behavior in one model.
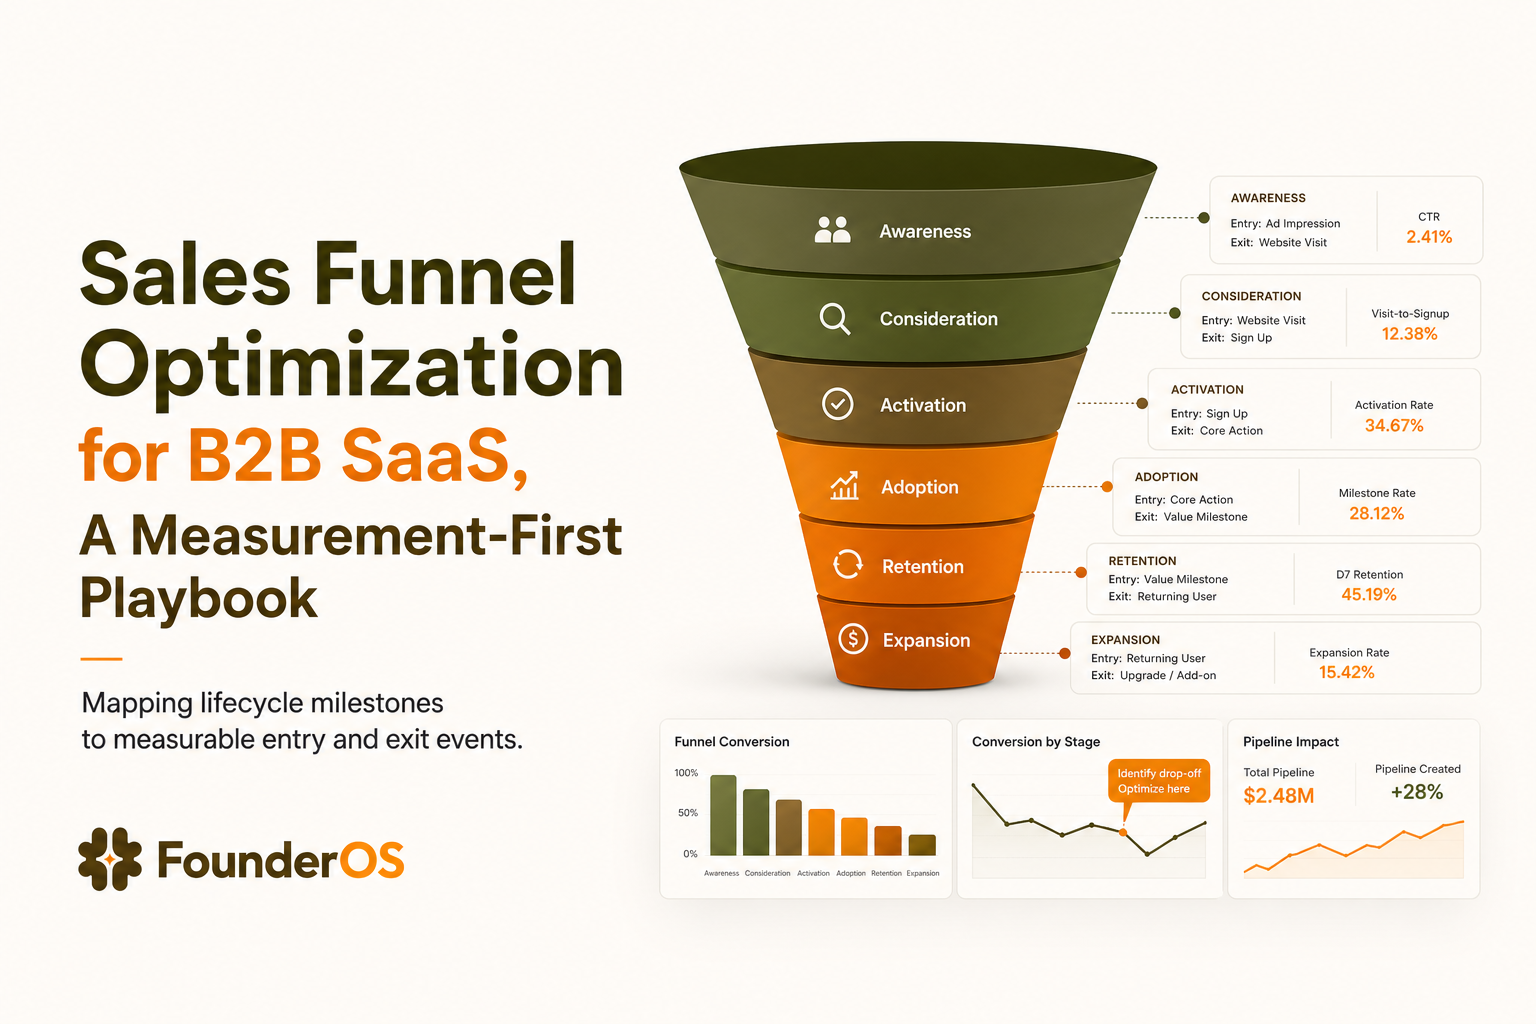
- Map your buying journey to lifecycle milestones and define entry and exit events so every stage is measurable, not subjective.
- Instrument identity and events end-to-end (anonymous to known) so you can attribute activation and revenue to real product behavior.
- Prioritize and fix one leverage point at a time using conversion, time-to-convert, and segment breakdowns, then validate with clean experiments.
Start With a Customer Journey That Matches How Your SaaS Actually Sells
Most teams inherit a “stage model” from their CRM and call it done. The problem is that stage definitions are often subjective (for example, “Sales Qualified”) while the customer’s journey is behavioral (for example, “invited 2 teammates and created first project”). Sales funnel optimization starts by mapping what your SaaS actually needs a buyer to do, then turning that into measurable milestones.
Step 1: Define lifecycle milestones across marketing, sales, and product
Use milestones that are observable and time-bound. A practical set for many B2B SaaS motions looks like this:
- First touch: ad click, content visit, webinar registration
- Lead created: form submit, inbound email, chat captured
- Account created: signup, SSO initiated
- Activation: first “aha” action completed (your product’s core value)
- Sales engagement: meeting held, proposal sent
- Commitment: security review started, procurement initiated
- Revenue: closed-won, first invoice paid
Step 2: Write entry and exit criteria as events, not labels
For each milestone, define:
- Entry event (what starts the stage)
- Exit event (what completes it)
- Time window (how long you expect it to take)
Example for a product-led motion:
- Account created entry:
signup_completed - Account created exit:
workspace_createdwithin 15 minutes - Activation entry:
workspace_created - Activation exit:
core_action_completedwithin 7 days
Step 3: Choose one “north-star” activation definition
If you do not have a crisp activation definition, your conversion debates never end. A good activation event is:
- Value-linked: correlates with retention or expansion
- Early: happens in the first session or first week
- Repeatable: same meaning across segments
If you need help tightening this, see user activation as a definition exercise that avoids vanity milestones.
Instrument the Journey With Event Tracking and Identity, Not Just CRM Stages
Sales funnel optimization breaks when product data and sales data cannot be connected. You might know “who converted,” but not “what they did,” or you might know “what users did,” but not “which accounts became revenue.” The fix is a minimal instrumentation spec that ties anonymous behavior to known users and accounts.
Minimum event set you need to connect behavior to outcomes
Start with a small set of events that cover acquisition, activation, and sales outcomes. You can expand later.
- Acquisition:
landing_page_view,pricing_view,demo_request_submitted - Signup and onboarding:
signup_completed,email_verified,onboarding_step_completed(with step name) - Activation:
core_action_started,core_action_completed - Collaboration signals:
invite_sent,teammate_joined - Sales outcomes:
meeting_held,proposal_sent,closed_won
Identity rules that prevent attribution gaps
Most attribution gaps come from identity. Use these rules:
- Anonymous ID on first visit (cookie or device ID)
- User ID after signup or login
- Account ID after workspace creation, domain match, or admin assignment
- Merge rule: when a user logs in, merge their anonymous history into the known user profile
Also capture key properties that let you segment later: acquisition source, plan, role, company size, industry, region, and whether the account is sales-assisted.
A practical checklist for clean event data
- Each event has a clear verb and object (for example,
report_created, notclicked_button). - Events include
timestamp,user_id(when known), andaccount_id(when applicable). - Properties are consistent (for example,
planis alwaysfree,trial,pro, not mixed casing). - Error and friction events exist (for example,
payment_failed,integration_error).
Find the Leverage Point Using Conversion, Time-to-Convert, and Segment Breakdowns
Once your journey is measurable, the next mistake is trying to fix everything at once. Sales funnel optimization works best when you select one leverage point where a fix will change revenue, not just a local metric.
Use impact math to pick the stage that matters
Estimate the revenue impact of improving a stage by a small, realistic amount. Here is a simple model:
- Leads per month = 1,000
- Signup rate = 8% (80 signups)
- Activation rate = 30% (24 activated)
- Sales-qualified rate from activated = 25% (6 SQL)
- Win rate = 30% (1.8 deals)
- ACV = $12,000
If you can raise activation from 30% to 36% (a 6-point lift), activated users go from 24 to 28.8. That yields 7.2 SQL, 2.16 deals, and about $4,320 more monthly revenue (0.36 extra deals times $12,000), before expansion. This is why activation is often a leverage point, but only if activation truly correlates with sales outcomes.
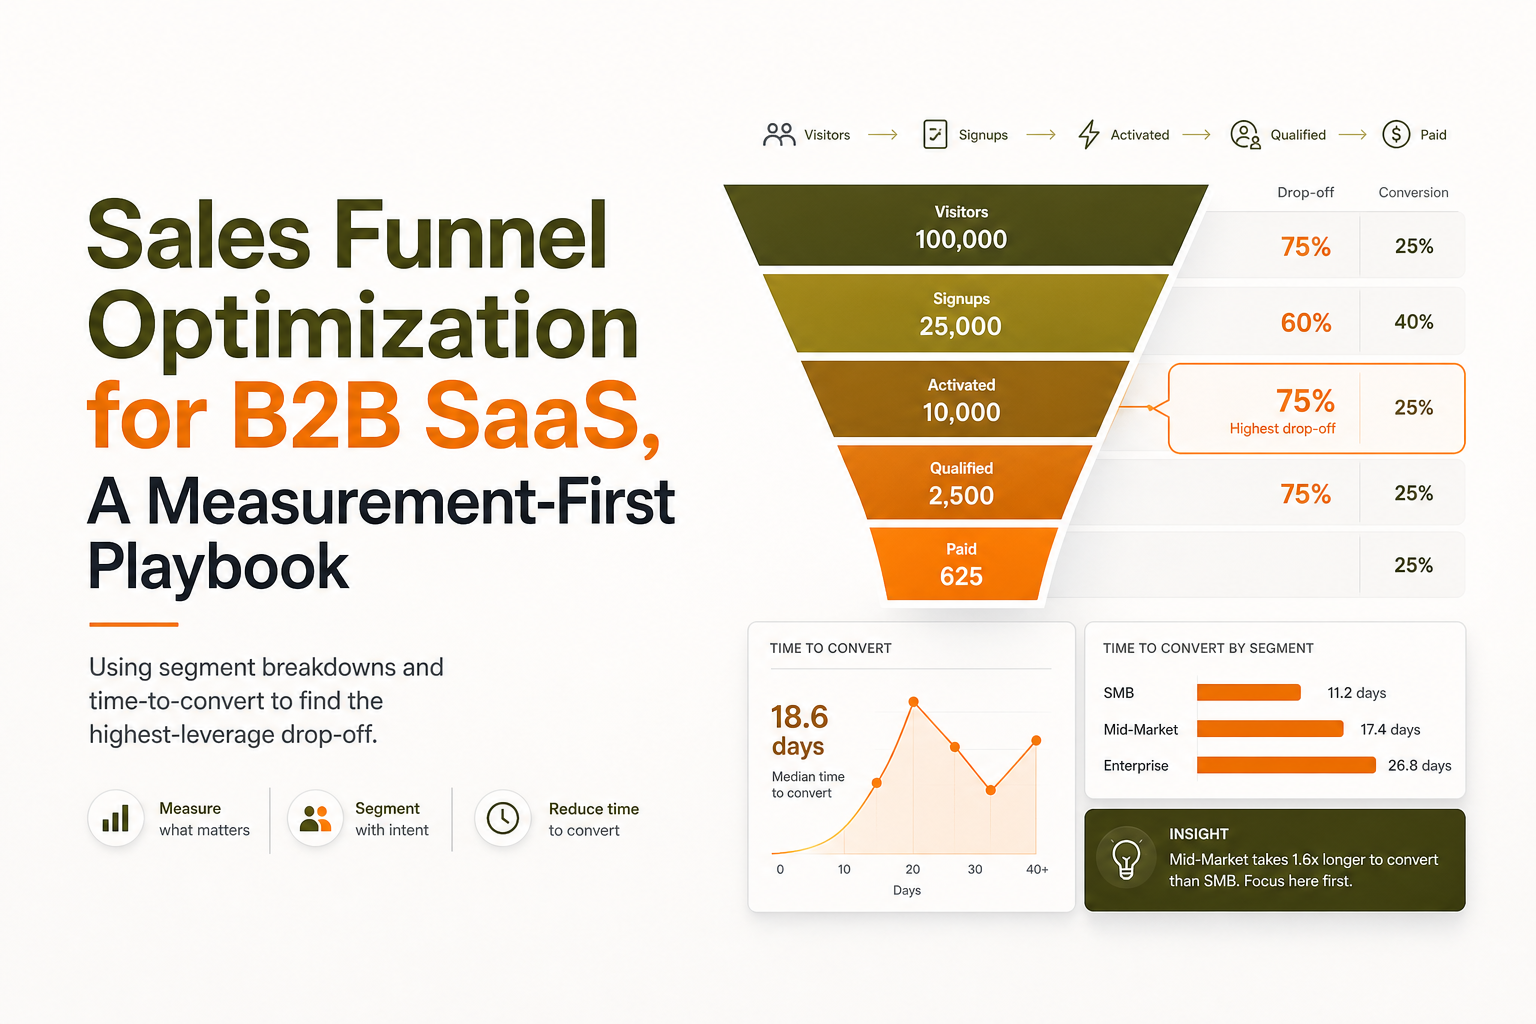
Time-to-convert is your early warning signal
Conversion rate alone hides slowdowns. Track:
- Median time from signup to activation
- P75 time (the “slow but still converts” cohort)
- Time from activation to meeting held for sales-assisted paths
If median conversion is stable but P75 is growing week over week, you likely introduced friction that only affects certain segments.
Segment breakdowns that typically reveal the real problem
Run breakdowns by:
- Acquisition source (paid search vs. partner vs. outbound)
- Role (IC vs. manager vs. admin)
- Company size (SMB vs. mid-market)
- Sales-assisted vs. self-serve
Often, the “average funnel” looks fine while one high-value segment is collapsing. This is where funnel analysis becomes diagnostic instead of descriptive.
Diagnose Drop-Off Root Causes With Behavioral Paths and Friction Signals
After you pick a leverage point, the job is not “brainstorm improvements.” The job is to isolate a failure mode you can test. Sales funnel optimization becomes predictable when you combine pathing, friction events, and qualitative tags.
Pathing: what successful users do that drop-offs do not
Take users who reached the target event (for example, core_action_completed) and compare their common paths to users who stalled. You are looking for:
- Missing prerequisite actions (for example, never connected an integration)
- Detours that signal confusion (for example, repeated pricing views mid-onboarding)
- Loops (for example, onboarding step 2 repeated 5 times)
If you want a structured way to turn this into fixes, use conversion funnel analysis with a “hypothesis per drop-off” template.
Friction signals: instrument what “pain” looks like
Many products only track happy-path events. Add friction instrumentation:
- Error events: API errors, integration failures, permission denied
- Latency: slow page loads on key onboarding screens
- Validation failures: form errors, rejected domains, weak password loops
- Support touches: chat opened, help center searched, ticket created
Then quantify: “Users who hit integration_error have a 62% lower activation rate and 3.1x longer time-to-value.”
Qualitative tags: connect sessions to reasons
Add lightweight tags from sales and support into your dataset:
- “No time,” “Missing feature,” “Security concern,” “Needs admin,” “Price objection”
Even if tags are imperfect, they help you cluster failure modes. For security and privacy expectations around analytics data, align with industry guidance like NIST privacy principles; a starting reference is NIST Privacy Framework.
Turn Insights Into Experiments and Rollouts That Sales Can Feel
Insights are only valuable if they change decisions. Sales funnel optimization needs experiments that tie product changes to pipeline and revenue, not just clicks.
Experiment design: one hypothesis, one primary metric, two guardrails
Use this structure:
- Hypothesis: “If we pre-fill workspace settings based on role, more users will complete
core_action_completedwithin 24 hours.” - Primary metric: activation rate within 24 hours
- Guardrail 1: error rate on setup flow
- Guardrail 2: support contact rate per new signup
Revenue linkage: define the sales outcome you expect to move
Pick one downstream metric to monitor with a lag:
- Meeting held rate per activated account
- Pipeline created per activated account
- Win rate for accounts that activated within 7 days
This is also where a behavioral lead scoring system can help sales focus on accounts showing real intent, not just form fills.
Rollout plan: avoid “winner” changes that break other segments
- Start with one segment (for example, self-serve SMB) and validate lift.
- Expand gradually and watch guardrails for enterprise or sales-assisted accounts.
- Document the change so sales knows what to expect in onboarding and product behavior.
Operationalize Sales Funnel Optimization With Weekly Reporting and Alerts
If your metrics only get reviewed in monthly meetings, you will ship regressions and not notice for weeks. Sales funnel optimization becomes a system when you set owners, cadence, and alerts.
A weekly cadence that actually works
- Monday: review last week’s stage conversions and time-to-convert; pick one anomaly to investigate.
- Wednesday: deep dive on one segment; produce 1 to 2 hypotheses with evidence.
- Friday: decide experiment scope, success metrics, and rollout checklist.
Dashboards: keep them narrow and decision-oriented
Use three dashboards, not ten:
- Journey overview: stage conversion, median time between milestones
- Activation and adoption: activation definition, feature adoption curves
- Revenue linkage: activated-to-meeting, activated-to-pipeline, activated-to-win
Alerts: catch drift before it becomes a quarter problem
Set alerts for:
- Activation rate down more than 10% week over week
- Median time-to-value up more than 20%
- Error events on onboarding screens above a threshold
If you are actively tracking time to value, these alerts become even more actionable because they point directly to where new users are getting stuck.
| Optimization focus | What you measure | Typical root cause | Best first fix |
|---|---|---|---|
| Lead to signup | Form completion rate, source-to-signup CVR | Message mismatch, friction in forms | Simplify form, align landing promise to product value |
| Signup to activation | Activation rate, median time-to-value | Missing prerequisite, confusing onboarding | Remove steps, add guided onboarding tied to the core action |
| Activation to meeting | Meeting held rate per activated account | Weak handoff, wrong accounts prioritized | Route high-intent accounts using behavioral scoring |
| Proposal to closed-won | Win rate, cycle time, stall rate | Security and procurement friction | Preempt security concerns, standardize proof points and docs |
FAQ
If you want to apply this measurement-first approach without waiting on data engineering, Founder OS can help you connect user behavior to outcomes with fast event tracking, user profiles, segmentation, and clear journey reporting so your next sales funnel optimization cycle is based on evidence, not opinions.
Written by Ivy Tran
Founder of FounderOS, sharing practical insights on SaaS growth, product analytics, and user activation.
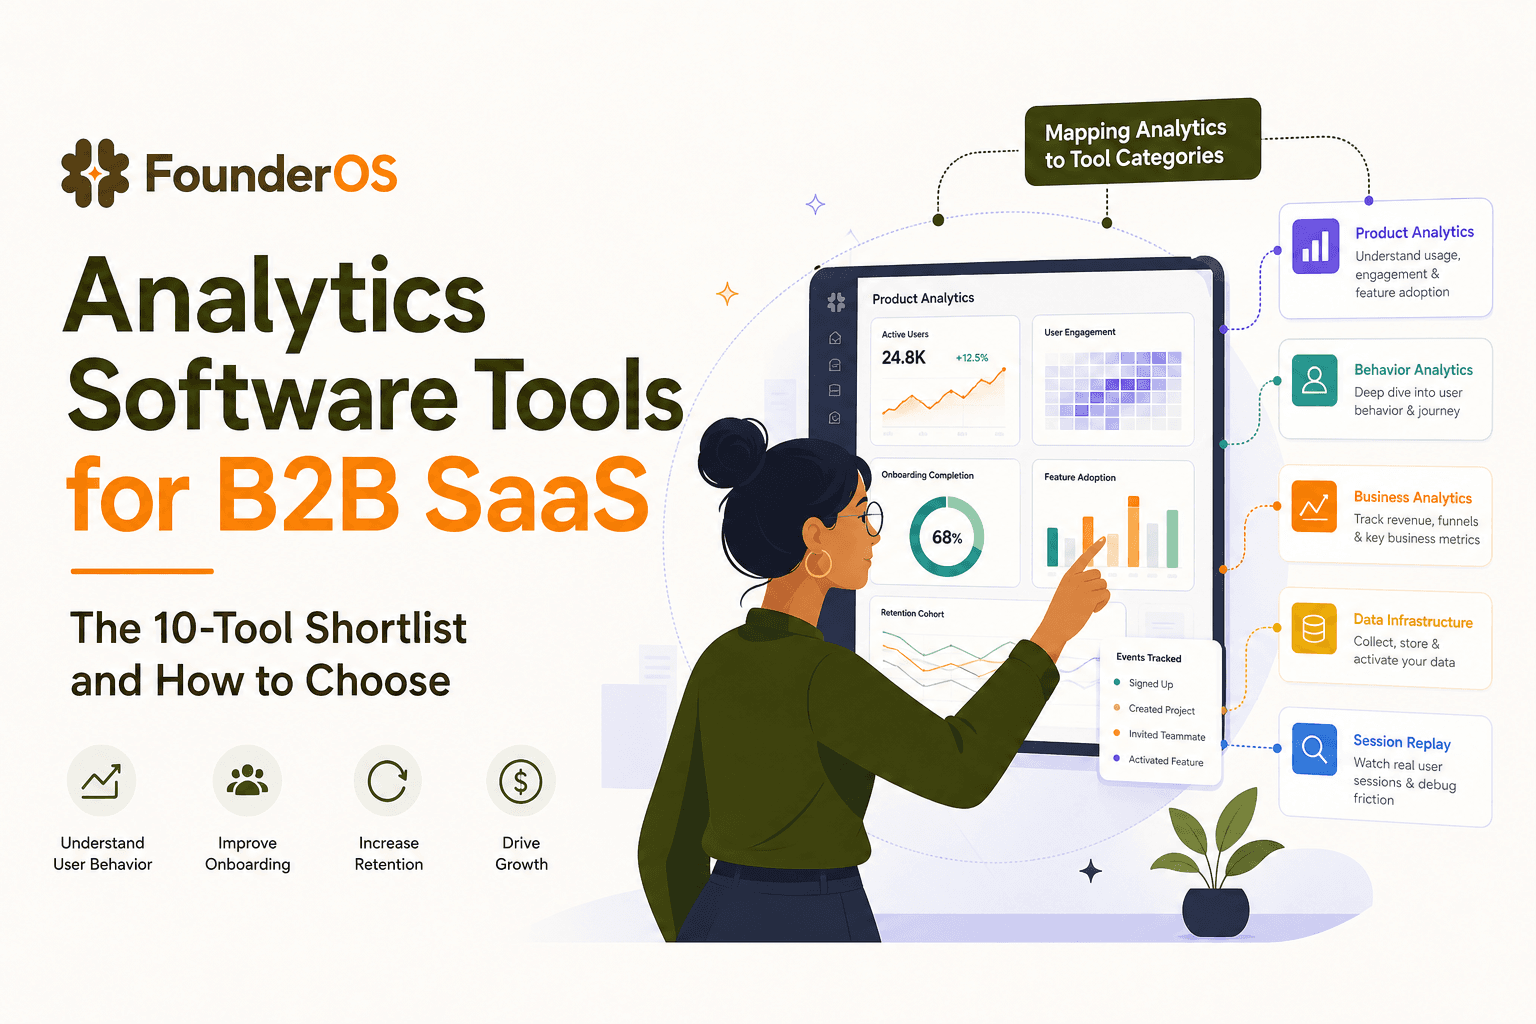
Analytics Software Tools for B2B SaaS - The 10-Tool Shortlist and How to Choose
A BOFU-ready shortlist of analytics software tools for B2B SaaS: 10 picks across categories plus a buyer rubric and rollout plan.

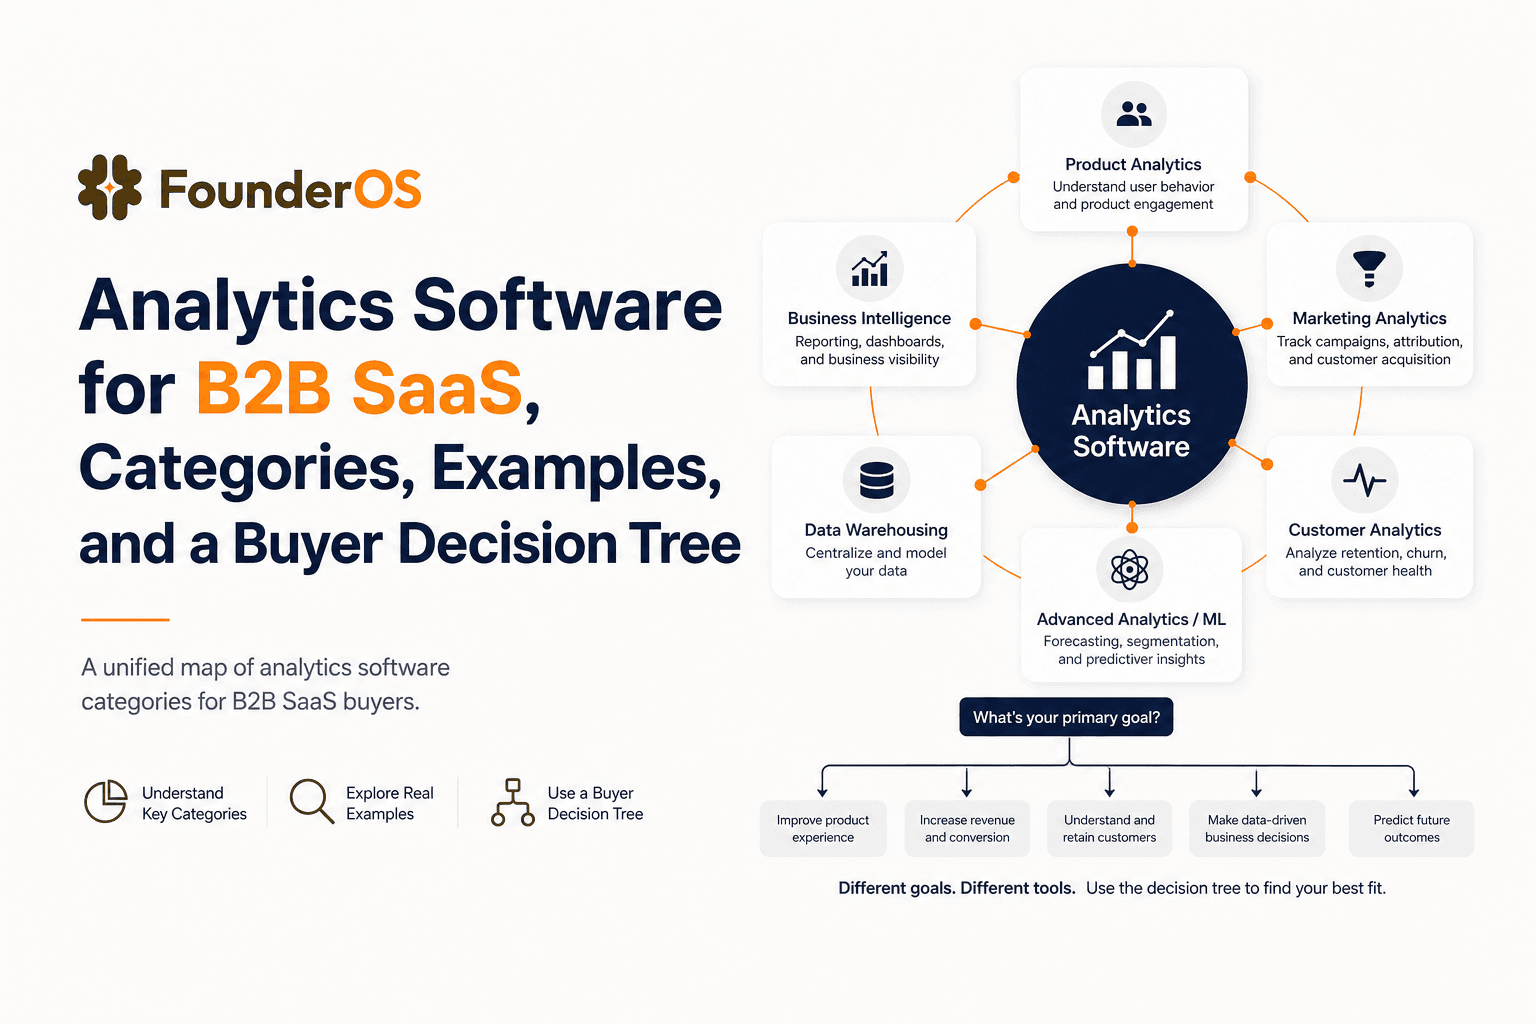
Analytics Software for B2B SaaS, Categories, Examples, and a Buyer Decision Tree
Choose analytics software for B2B SaaS with a clear category map, 10-minute decision tree, real workflows, and a practical buyer checklist.
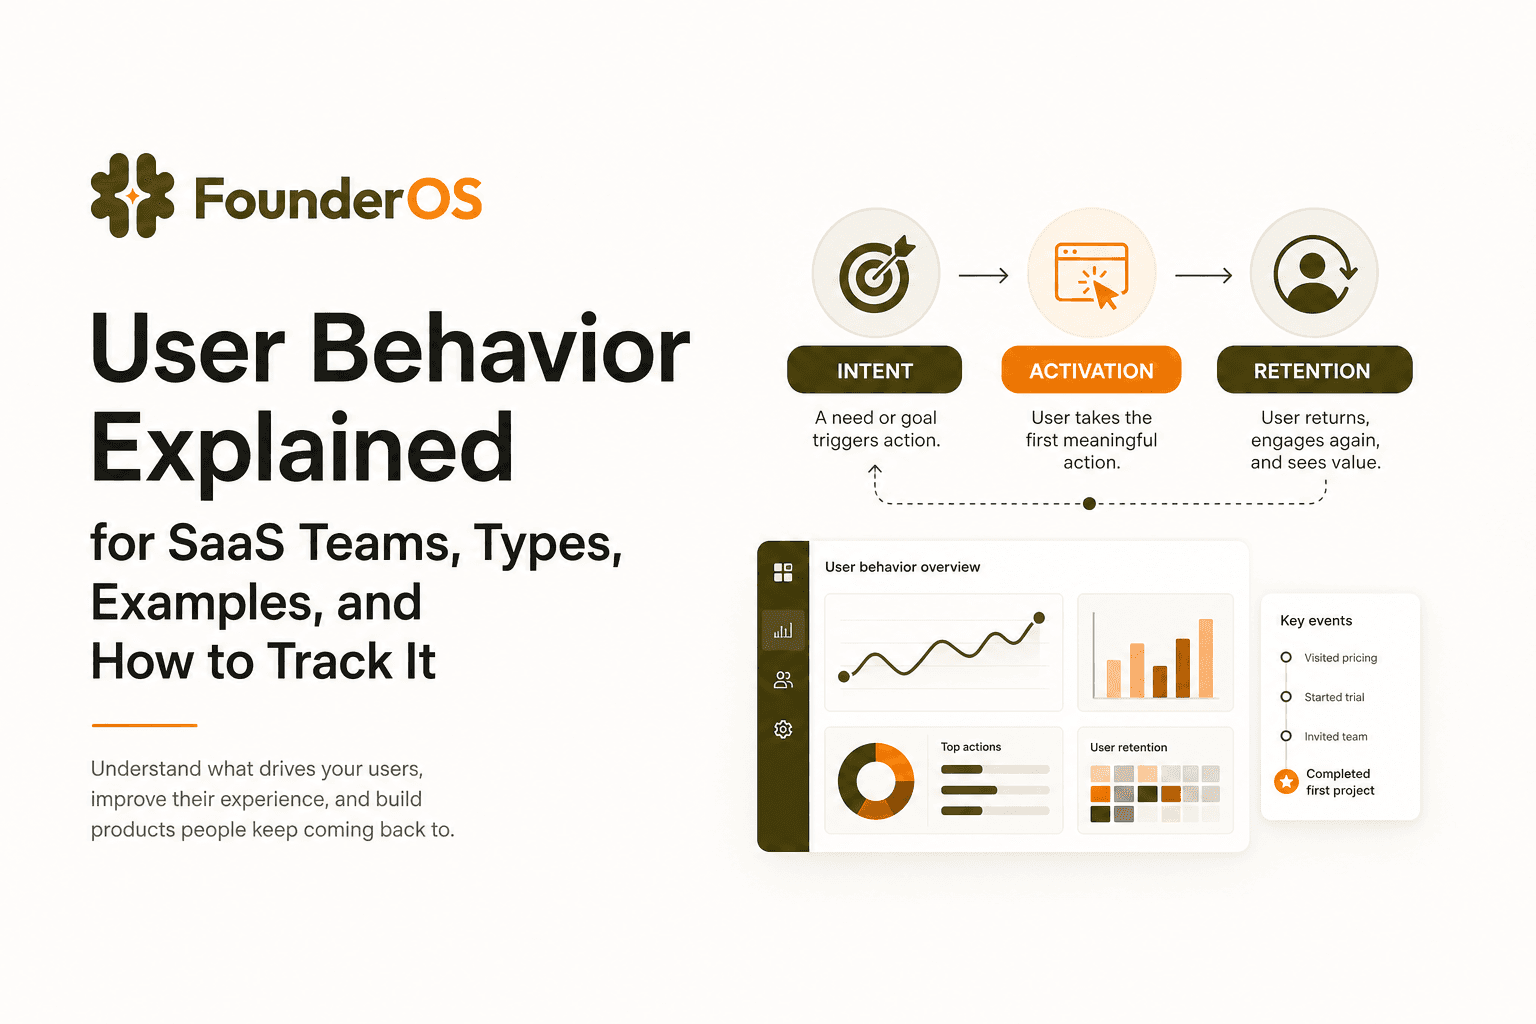
User Behavior Explained for SaaS Teams, Types, Examples, and How to Track It
Learn what user behavior means in SaaS, the key types, and a practical event tracking playbook to turn user behavior into product decisions.