
Activation Rate Explained for B2B SaaS, Definition, Formula, and Common Pitfalls
Activation rate is the percent of new users (or accounts) who reach a clearly defined “first value” action within a specific time window, and it is one of the fastest ways to tell whether your onboarding and product promise match reality.
- Define activation with an event and a time window tied to value, not a busywork click.
- Calculate activation rate by cohort and segment (persona, channel, plan) to avoid misleading averages.
- Diagnose low activation with a simple funnel plus cohort cuts to find the exact step and audience causing drop-off.
What Activation Rate Means in B2B SaaS and Why It’s Not Just Signups
Activation rate answers one practical question: “Did new users reach the moment they first experienced the product’s core value, quickly enough for them to stick around?”
Activation rate vs signup conversion vs retention
These metrics are related, but they measure different parts of the journey:
- Signup conversion: Did someone create an account (or complete a lead form)? This is acquisition and intent, not value.
- Activation: Did they complete the first meaningful action that indicates value realization?
- Retention: Did they come back and continue getting value over time (weekly, monthly, etc.)?
A common trap is treating “created workspace” or “visited dashboard” as activation. Those can be necessary steps, but they are often setup, not value.
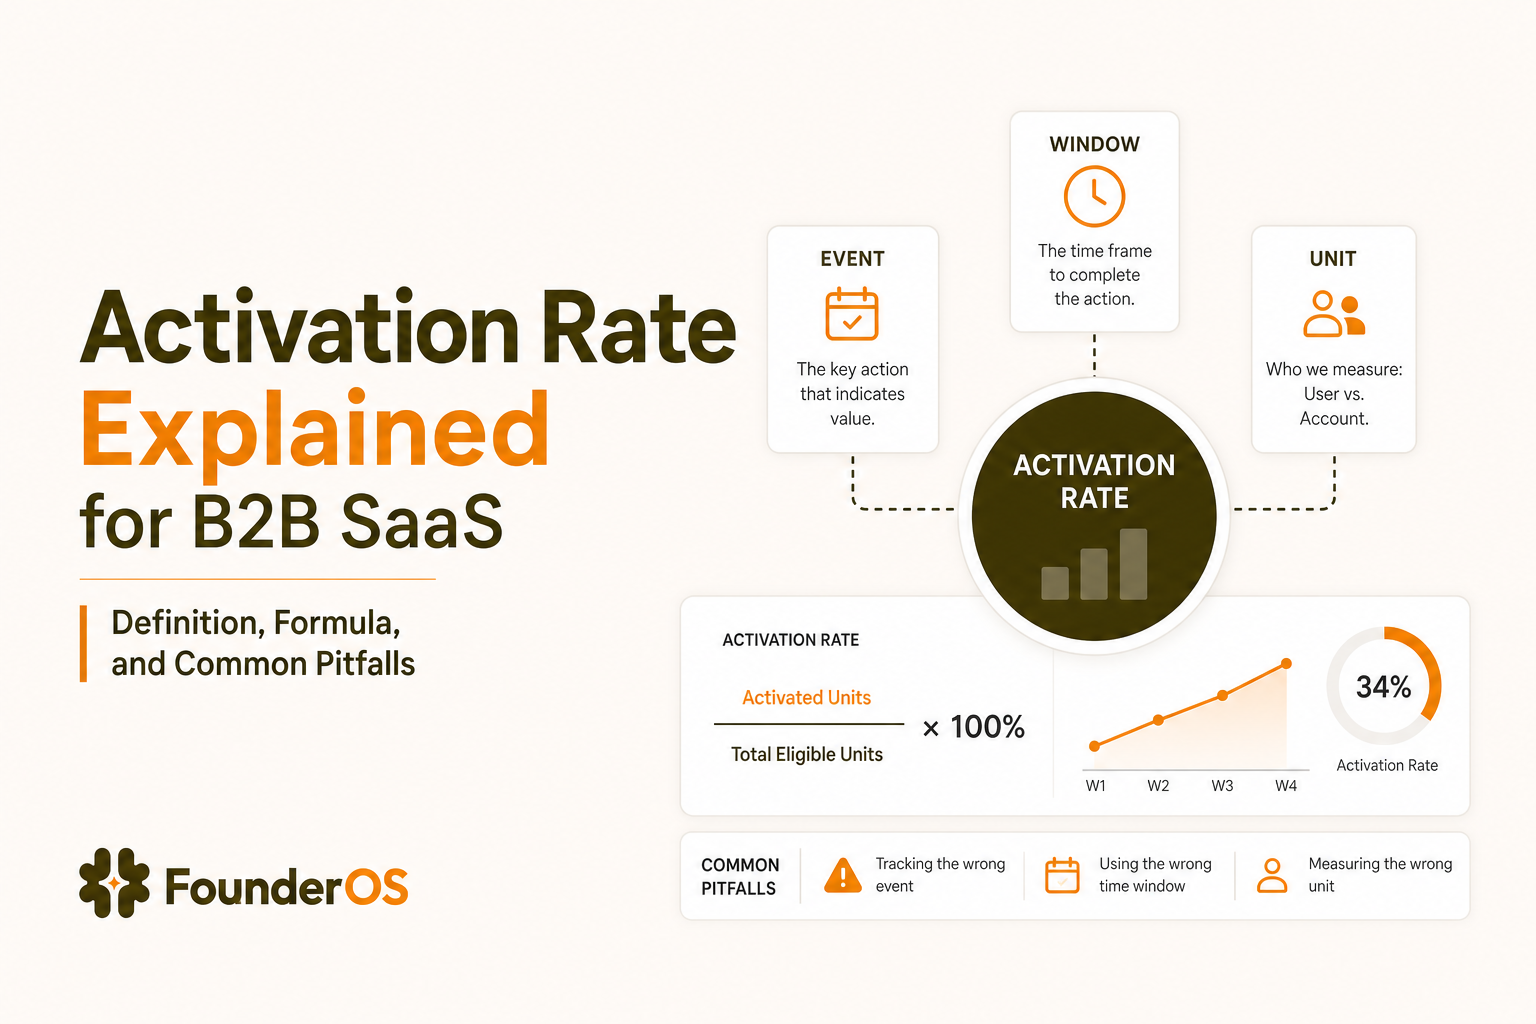
The three building blocks: event, window, and unit
A reliable activation metric has three explicit choices that you write down and keep stable long enough to learn:
- Activation event: The action that best represents first value (example: “invited teammate,” “connected data source,” “created first report”).
- Activation window: The time allowed after signup (example: 1 day for self-serve, 7 days for sales-assisted, 14 days for longer setup).
- Unit of activation: User-level or account-level. In B2B SaaS, account-level is often more truthful because value is shared across a workspace.
Why B2B makes activation trickier than it looks
B2B products frequently have multiple personas (buyer, admin, end user), longer setup, and multi-user workspaces. That creates measurement pitfalls like “one power user activates the account” or “admins activate but end users never do.” The fix is not a more complicated metric, it is a clearer definition plus segmentation so you can see which audience is driving the number.
How to Define Your Activation Event, A Simple 3-Test Method
A good activation event is the earliest action that strongly signals real value, not just progress through onboarding screens.
Test 1: Value-realization test
Ask: After this event happens, would a reasonable user say “I get it”? If the answer is “not yet,” it is probably a setup step. Examples by category:
- CRM or sales tooling: “first pipeline created” might still be setup; “first deal moved stage” can be closer to value.
- Analytics: “installed snippet” is setup; “first key event tracked” or “first funnel viewed with data” is closer to value.
- Collaboration: “created workspace” is setup; “shared first doc with teammate” is closer to value.
Test 2: Repeatability test
Choose an event that can happen across most successful accounts, not a one-off configuration that only admins do once. “Connected integration” might be necessary, but it can be vendor-specific and uneven across segments. “Created first report used in a workflow” is often more repeatable.
Test 3: Leading-indicator test
Activation should predict later retention or expansion better than earlier steps. In practice, we run a quick check: compare 30-day retention (or week-4 activity) for users who did the candidate event vs those who did not, using the same signup cohort. If the gap is meaningful and consistent across cohorts, you likely found a strong activation event.
A short list of activation event patterns that work in B2B
- “First output created”: first report, first dashboard, first proposal generated.
- “First key input connected”: first data source connected, first repo connected, first calendar synced.
- “First collaboration moment”: first teammate invited who becomes active, first shared item viewed.
- “First workflow completed”: first ticket closed, first campaign launched, first invoice sent.
If you want a deeper walkthrough of defining the moment of value, see user activation and how to define it in plain terms.
How to Calculate Activation Rate Correctly, Formula, Windows, and Segments
Activation rate is only trustworthy when you calculate it by cohort with a fixed window and a clear denominator.
The core formula
At its simplest:
Activation rate = Activated entities within window / Eligible new entities
- Activated entities: users or accounts that fired the activation event within the activation window.
- Eligible new entities: users or accounts that signed up (or became eligible) in the cohort period.
Pick the cohort and the window, then stick to them
Use a signup cohort (for example, “users who signed up between May 1 and May 31”) and measure whether each cohort member activates within the window (for example, within 7 days). This avoids the classic mistake of mixing old signups with new signups, which can make activation look better or worse depending on seasonality and growth rate.
Denominator choices that change the story
Write down your denominator rule because it will change the metric:
- All signups: good for top-level product truth, but includes spam, students, and misfit traffic.
- Qualified signups: excludes obvious non-target users (example: business email only, or completed email verification). This is often more actionable for growth teams.
- Eligible users: excludes users who never had a chance (example: invited users who never accepted, or accounts stuck in “pending approval”).
We initially assumed “all signups” was the most honest denominator, but cohort reviews often showed the metric was dominated by low-intent sources; switching to “verified signups” made the activation rate more stable while still keeping us accountable for traffic quality.
Segment before you interpret
A single blended activation rate can hide the real problem. Start with these segments because they frequently explain most variance:
- Persona or role (admin vs end user)
- Acquisition channel (paid search vs partner vs content)
- Plan or trial type (free trial vs freemium vs sales-assisted trial)
- Company size (solo vs SMB vs mid-market)
Segmentation is not “more dashboards,” it is how you avoid false conclusions. If you need a practical framework for deciding segments, see user segmentation.
Diagnose a Low Activation Rate, Funnel Breakdowns and Cohort Patterns
A low activation rate becomes fixable when you can point to one step, one cohort, and one segment where momentum breaks.
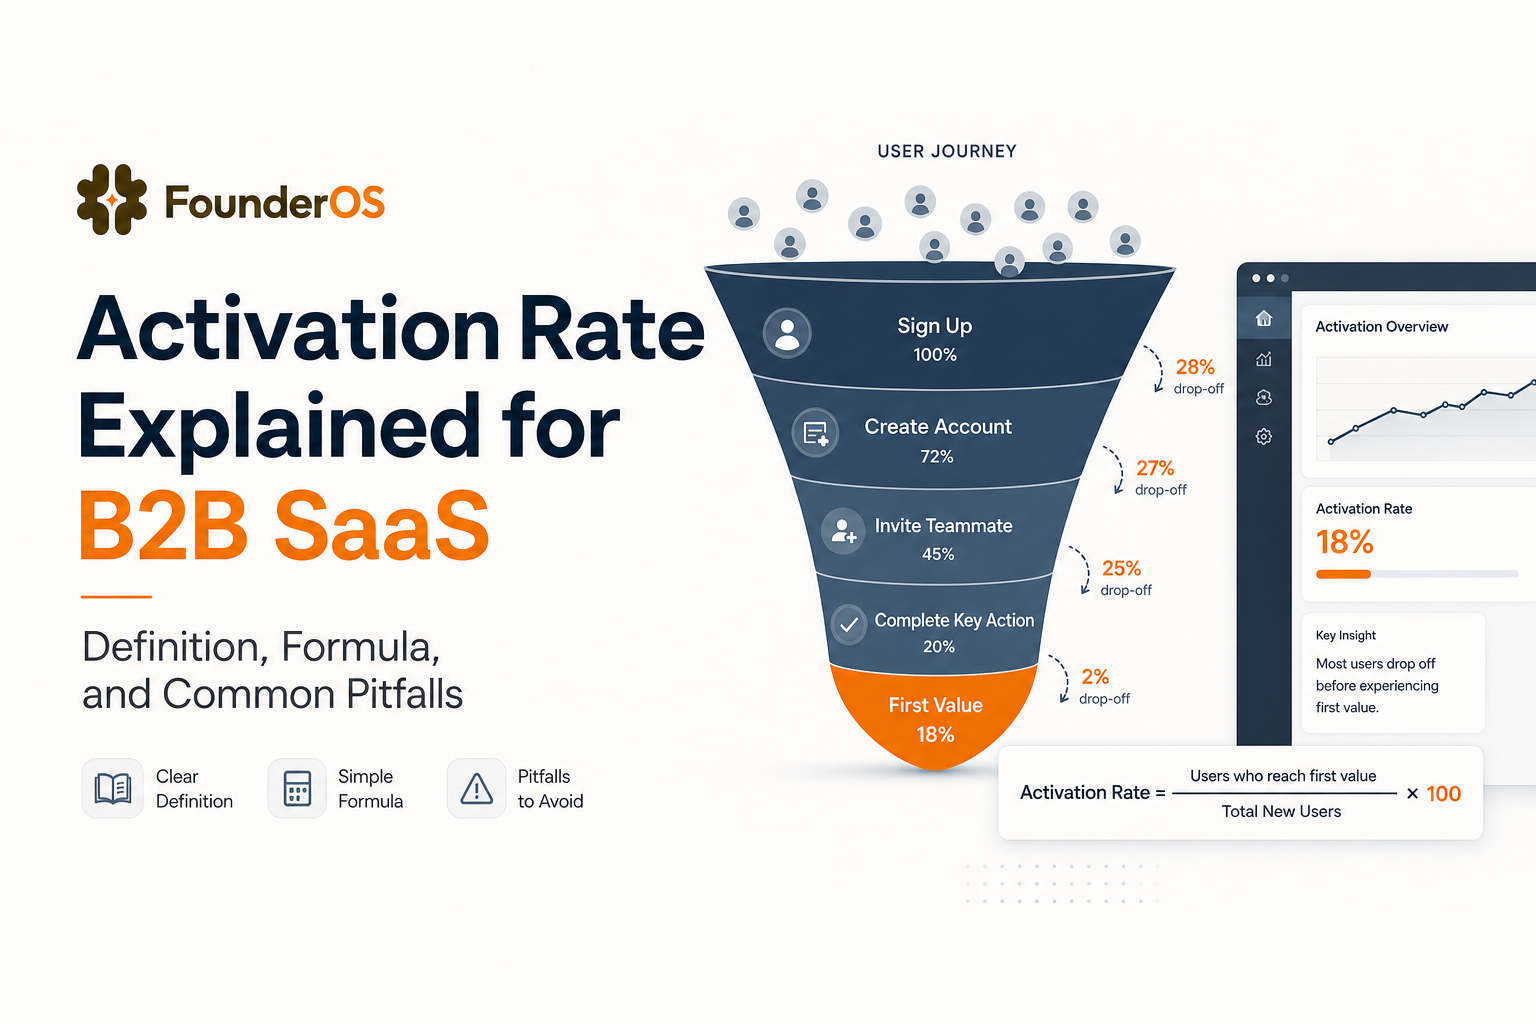
Step 1: Build a short “activation funnel” with 4 to 6 steps
Keep the funnel tight enough that each step is a real commitment, not a page view. A typical B2B self-serve example:
- Signup completed
- Email verified
- Workspace created
- Key setup completed (example: integration connected)
- Activation event (example: first report created)
The goal is to find the first sharp drop. If 90% create a workspace but only 25% connect a data source, the problem is likely setup friction, unclear value, or missing guidance at that moment.
Step 2: Compare funnels across cohorts, not just “last 7 days”
Look at at least 2 to 4 signup cohorts side by side. If the drop-off moved suddenly, you likely shipped a change, changed traffic sources, or broke instrumentation. If it is consistent, it is a product workflow issue.
Step 3: Cut by segment to separate product friction from audience mismatch
Two patterns show up repeatedly:
- Persona mismatch: admins activate but end users stall, which signals onboarding should branch by role.
- Channel mismatch: one channel brings high signup volume but low activation, which is often a positioning or expectation issue.
After running several activation audits, the pattern was clear: the “worst step” is rarely the same for every segment, so fixes that help one persona can do nothing for another.
Step 4: Use cohort behavior to choose the right fix
Once you identify the breaking point, match it to a fix type:
- Drop-off at setup: reduce required fields, add templates, add a guided connection flow, or offer a sample dataset.
- Drop-off at first value action: clarify the “next best action,” add in-app examples, and remove optional steps that distract.
- Drop-off after activation: activation event might be too weak, or value is not sustained; check next-week engagement for activated users.
For the mechanics of building and reading these steps, conversion funnel analysis is the skill that turns “we think onboarding is bad” into a specific to-do list.
The Most Common Activation Rate Mistakes and How to Avoid Them
Activation rate breaks most often because teams choose a vanity event, mix incompatible motions, or measure without a consistent unit and window.
Mistake 1: Vanity activation events
Symptom: activation rate looks high, but retention and expansion stay flat.
Fix: make the event closer to value output (created, shipped, shared, completed) and validate it with the leading-indicator test against later retention.
Mistake 2: Blended workspaces and “one user activates for everyone”
Symptom: account activation looks fine, but most users in the account never adopt the core feature.
Fix: track both account-level activation and user-level activation for key roles. For collaboration products, consider “activated account = at least 2 active users completed the activation event” to avoid counting single-user trials as success.
Mistake 3: Mixing self-serve and sales-led journeys
Symptom: activation rate swings when pipeline mix changes, and the number becomes political.
Fix: compute separate activation for self-serve vs sales-assisted cohorts (or by plan type), each with a realistic activation window. A 1-day window might be fair for self-serve, but unfair for a motion that requires an implementation call.
Mistake 4: Wrong time window (too short or too long)
Symptom: too short makes activation look terrible and discourages iteration; too long hides onboarding problems because everyone eventually activates weeks later.
Fix: start with a window that matches your product’s “time-to-first-value” expectation, then revisit after you measure real distributions (for example, if most activations happen in days 1 to 3, a 14-day window is not adding insight).
Mistake 5: Instrumentation gaps and inconsistent event definitions
Symptom: activation rate changes after tracking updates, not product changes.
Fix: define event names, required properties, and identity rules (user vs account) in a one-page spec. Then version changes so you can annotate dashboards when definitions shift.
A Starter Tracking Checklist for Activation, Events, Properties, and Dashboards
A minimal activation tracking setup is enough if it captures identity, the activation funnel steps, and the properties needed for segmentation.
Minimal event list (copy and adapt)
- signup_completed (properties: signup_method, source, campaign)
- email_verified
- workspace_created (properties: workspace_type, team_size_guess)
- key_setup_completed (properties: integration_type, setup_path)
- activation_event (properties: activation_variant, template_used, object_type)
Identity rules to decide upfront
- User ID and account/workspace ID: every event should carry both when possible.
- Invite flows: decide whether invited users belong to the original signup cohort or their own “invite accepted” cohort.
- Merges: define what happens when the same person signs up twice (common in B2B trials).
Properties that unlock action (without over-instrumenting)
If you only add a few properties, make them the ones you will actually segment by:
- persona (self-reported role, or inferred from actions)
- channel_source (UTM or referrer grouping)
- plan_type (trial, freemium, assisted)
- company_size_bucket (if known)
Dashboards to keep the metric honest
- Activation rate by signup cohort (with a fixed activation window)
- Activation funnel (4 to 6 steps, with drop-off by step)
- Activation rate by segment (persona, channel, plan)
- Post-activation engagement (1-week activity for activated vs non-activated)
When we tested this “minimum viable schema” approach, our team shipped faster because debates moved from “what do we track?” to “which step is failing for which segment?” If you are building in-app guidance to address the failing step, behavior triggers are a reliable way to show help only when it is needed.
| Decision | Good default | When to change it | What goes wrong if you don’t |
|---|---|---|---|
| Unit of activation | Account/workspace for B2B | Switch to user-level for end-user products | One power user masks broad non-adoption |
| Activation window | 7 days | Shorten if most activate in 1-2 days; lengthen for implementation-heavy products | Too short looks broken; too long hides onboarding friction |
| Denominator | Verified or qualified signups | Use all signups when auditing channel quality | Spam and low-intent traffic distorts trends |
| Activation event | First value output | Use “setup completed” only if setup itself delivers value | Vanity activation inflates the metric |
| Segmentation | Persona + channel + plan | Add company size when sales motion varies strongly | Blended averages lead to the wrong fixes |
FAQ about activation rate
If you want a lightweight way to instrument events, build an activation funnel, and segment activation rate by persona without a data team, Founder OS includes product tracking, user profiles and segmentation, GTM reporting, and an onboarding tool so you can go from “we’re guessing” to “we can see the exact step that breaks” in one workflow.

Fix Product Adoption Software Gaps and Turn New Signups Into Weekly Users
Learn how to choose and implement product adoption software to cut time-to-value, drive feature usage, and improve retention in under 10 minutes.

Building Sales Funnels for B2B SaaS, A Simple 5-Stage Model and Free Template
Learn building sales funnels for B2B SaaS with a simple five-stage model, free setup, KPI formulas, tracking plan, and copyable examples.
Best User Onboarding for SaaS, A Scorecard and Ranked Examples You Can Copy
Define best user onboarding with a practical scorecard, ranked SaaS examples, and patterns you can copy to improve time-to-value and activation.