
Amplitude vs Mixpanel, Which Product Analytics Tool Fits Your B2B SaaS in 2026
Amplitude vs Mixpanel comparison for B2B SaaS teams in 2026. Use a fast rubric for data model fit, analysis depth, collaboration, and TCO.
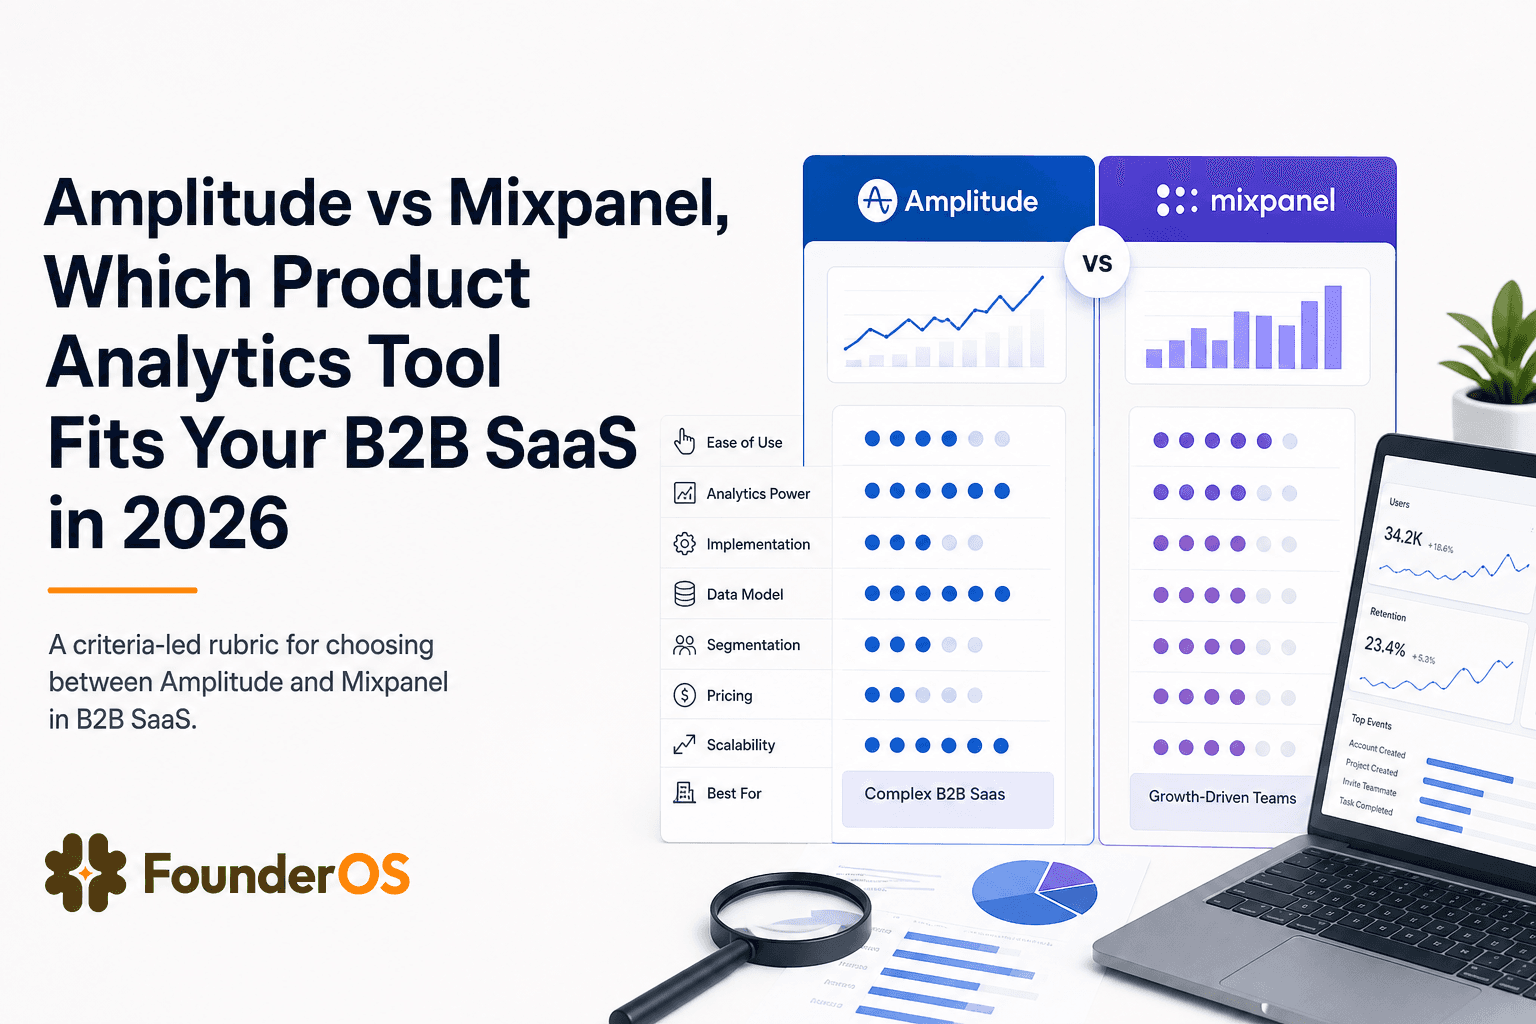
Choosing amplitude vs mixpanel in 2026 is less about who has “more charts” and more about whether the tool matches your data maturity, GTM questions, and the real cost of getting trustworthy answers every week.
- Pick based on data model fit and who will operate it weekly, not on feature checklists.
- Total cost of ownership is driven by event volume, governance overhead, and the people needed to keep tracking clean.
- If you need fast time-to-value for activation and onboarding without a dedicated analytics owner, a lighter option can outperform heavier stacks.
Amplitude vs Mixpanel in 2026, a fast decision framework
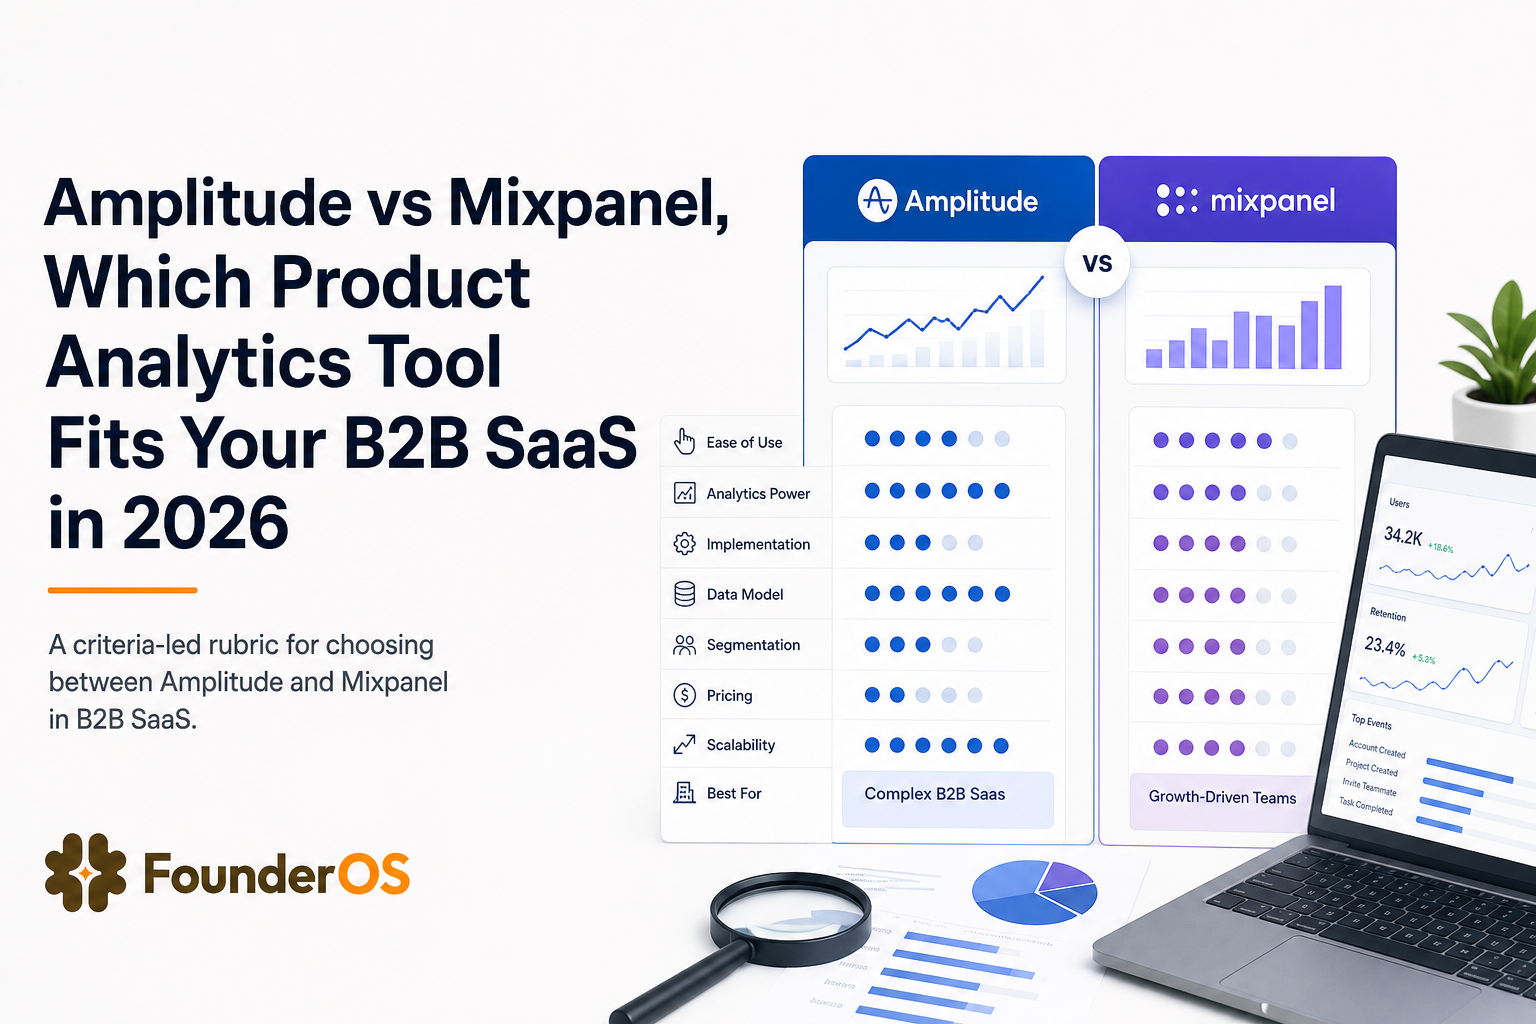
Use this rubric to decide in 15 to 30 minutes. Score each criterion 1 to 5, multiply by the weight, and compare totals. The point is not “perfect math”, it’s forcing alignment on what outcomes matter for your B2B SaaS: activation, feature adoption, retention, and revenue influence.
Step 1: Define the single weekly question you must answer
- Activation: “What % of new signups hit the first value moment within 24 hours?”
- Adoption: “Which features correlate with week-4 retention for ICP accounts?”
- Pipeline influence: “Do trial users who invite a teammate convert at a higher rate?”
If your team can’t state one question like this, you’ll end up paying for dashboards that no one trusts.
Step 2: Score your team’s operating model
- Owner: Is there a dedicated analytics owner (PM, growth, data) who will maintain tracking and reports?
- Operators: Will Sales, CS, and Marketing self-serve, or will they request analyses?
- Speed: Do you need answers today, or can you wait for instrumentation cycles?
Step 3: Use the weighted rubric
| Criterion | Weight | What “good” looks like | Red flag |
|---|---|---|---|
| Data model fit | 30% | Events, users, and accounts map cleanly to your product + CRM reality | Constant rework of naming, identity, or group/account logic |
| Analysis depth you’ll actually use | 25% | Funnels, retention, cohort comparisons, and paths answer your weekly question | Powerful features, but only one person can run them |
| Collaboration and sharing | 15% | Clear dashboards, saved views, easy annotations, consistent definitions | “Two versions of the truth” across teams |
| Governance and trust | 15% | Definitions, permissions, QA, and changes are controlled | Everyone ships events, no one owns quality |
| Total cost of ownership (TCO) | 15% | Cost scales predictably with growth and event volume | Surprise bills or forced upgrades tied to event spikes |
Core differences that actually change outcomes
Most comparisons stop at “both do funnels and retention.” In practice, the differences show up in whether your team can answer GTM questions without weeks of re-instrumentation. In our experience working with early-stage B2B SaaS teams, the failure mode is rarely “missing a chart” and more often “we can’t trust the event definitions across teams.”
1) Data model and identity, where tracking either stays clean or decays
- Identity resolution: How the tool handles anonymous to known users, multiple devices, and merges impacts every activation funnel.
- Account-level analytics: B2B often needs company or workspace rollups, not just user-level views. If your product is account-based, you’ll care about group or account constructs early.
- Event taxonomy: The more people instrument events, the more you need guardrails, naming standards, and versioning.
Decision check: if your CRM and billing are account-centric, prioritize the platform that makes account-level analysis and identity hygiene easiest to operate, not just possible.
2) Segmentation, the difference between “interesting” and “actionable”
Segmentation should let you isolate ICP behavior and then reuse it everywhere: funnels, retention, and onboarding experiments. A practical test is to define three segments and see how fast you can apply them across analyses:
- New activators: Signed up in last 7 days and completed the value moment.
- Stalled trials: Signed up in last 14 days, did not reach value moment, visited pricing page.
- Expansion-ready: Accounts with 3+ active users and adoption of a “team” feature.
If you can’t reuse segments consistently, your team will reinvent them in spreadsheets. If you want a deeper framework for building segments that drive GTM actions, see user segmentation.
3) Funnels and drop-off diagnosis, can you get from “what” to “why” quickly?
A funnel is only useful if it supports diagnosis. The workflow that matters is: build funnel, find the step with the biggest drop, then drill into the users or sessions that failed and compare them to converters.
- Event flexibility: Can you build funnels from any event sequence without re-tagging?
- Cohort comparison: Can you compare “new users last week” vs “new users this week” after a release?
- Drill-down: Can you inspect example users to see what they did before dropping?
When we tested funnel diagnostics on a typical signup to activation flow, the fastest teams were the ones who could go from a drop-off step to a specific behavioral pattern (for example, “users who never triggered X also never saw Y”) in a single working session, not a week of back-and-forth.
For a hands-on diagnostic playbook, bookmark funnel analysis.
4) Retention and product growth loops, measuring what keeps accounts around
Retention analysis is where “amplitude vs mixpanel” becomes a question of depth and usability. Your retention model should match how your product delivers value:
- Usage-based products: Weekly active usage of core actions.
- Collaboration products: Number of active seats and team invites.
- Workflow products: Completion of recurring jobs or runs.
A concrete test: define “core action” and measure week-1 to week-4 retention for two cohorts, then segment by acquisition channel and by account size. If that takes days to set up or requires a data person every time, it will not become a weekly habit.
5) Governance and collaboration, avoiding the silent killer of analytics programs
Governance is not a nice-to-have once you have multiple teams shipping events. The cost shows up as wasted meetings and mistrust. Look for:
- Definition control: Who can create or edit key metrics?
- Permissions: Can you safely share dashboards with go-to-market teams?
- Change management: Can you track when an event changed and what broke?
If your organization is small, you may prefer lighter governance to preserve speed. If you are scaling, governance becomes the difference between analytics as a system and analytics as a debate.
Pricing, implementation, and total cost of ownership
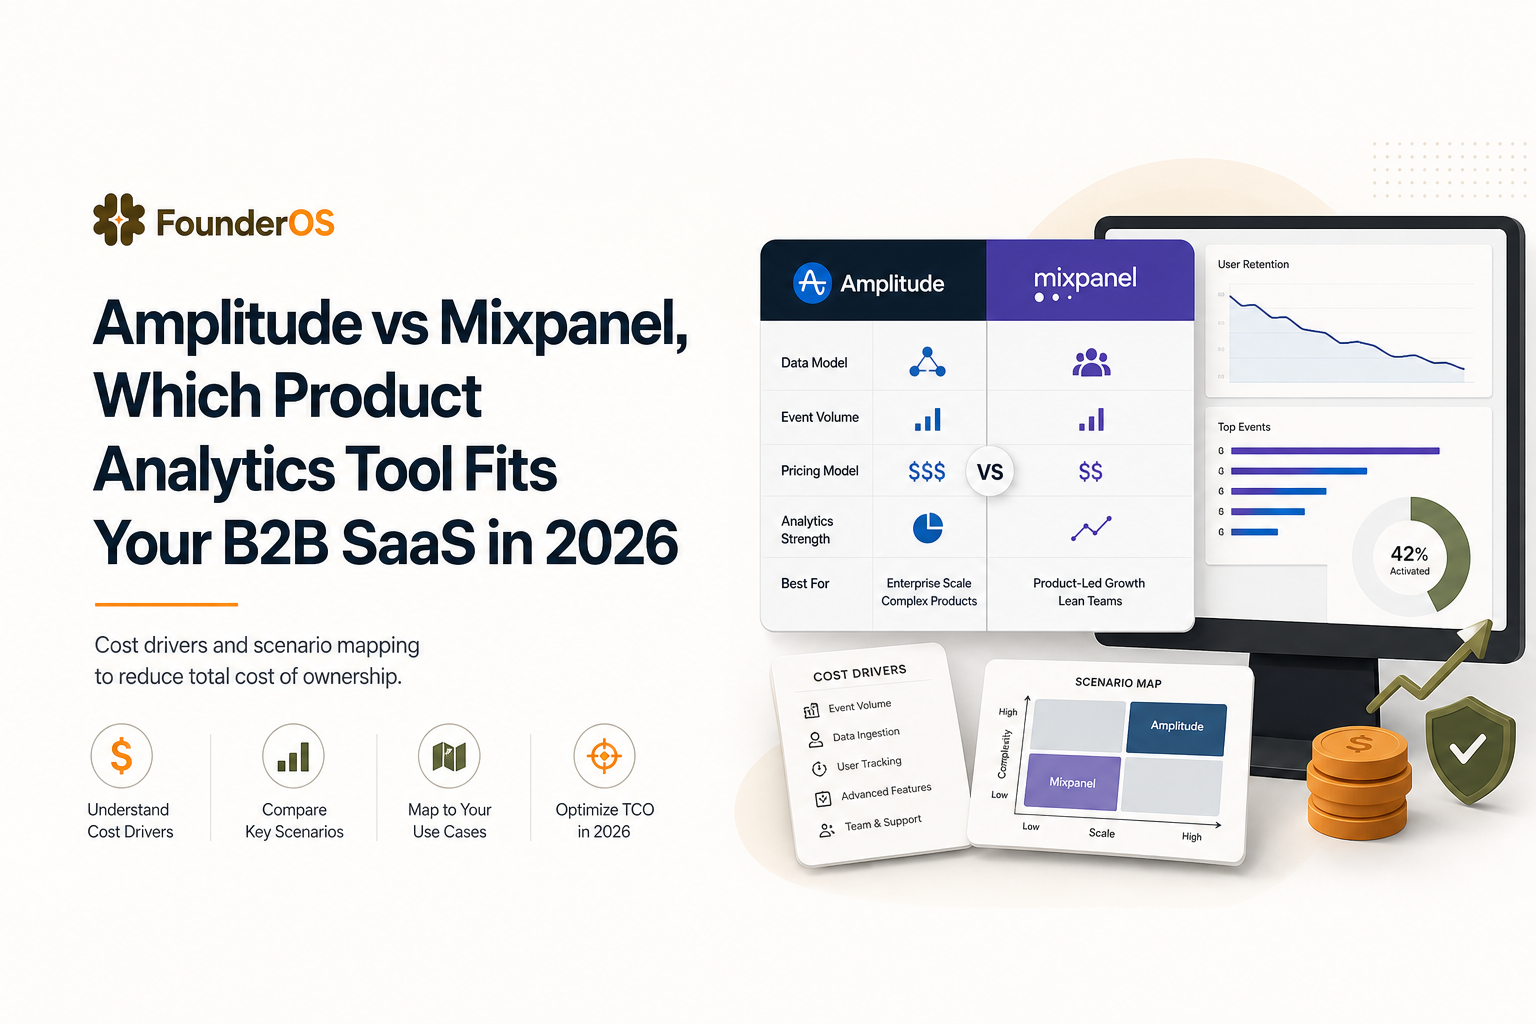
Most teams underestimate TCO because they only compare list price. For amplitude vs mixpanel, the real cost drivers tend to be event volume, the number of seats who need access, and the operational overhead to keep tracking accurate as the product evolves.
Cost driver checklist, what to estimate before you buy
- Monthly events: Page views, clicks, and auto-captured events can explode volume. Estimate events per active user per day, then multiply by MAU.
- High-cardinality properties: Properties like URL, search queries, and IDs can increase processing and complexity.
- Environments: Do you need separate projects for dev, staging, and production?
- Data exports: Will you need raw export to a warehouse for long-term retention or BI?
- Seats: Who needs edit vs view permissions? Product, growth, marketing, CS, and leadership add up quickly.
Implementation reality, time-to-value depends on who owns tracking
Plan the work in three phases and assign an owner for each:
- Instrumentation (week 1 to 3): define events for activation and adoption; implement identity; validate data.
- Standard reports (week 2 to 4): activation funnel, feature adoption, retention cohorts, top segments.
- Operationalization (ongoing): QA new events, maintain definitions, onboard new stakeholders.
What surprised our team was how often “implementation” failed not because engineering couldn’t send events, but because no one owned the metric definitions and naming conventions after the first sprint. The result is predictable: dashboards diverge, then trust collapses.
Event volume pitfalls and how to avoid surprise bills
- Start with a minimal event set: activation, core action, key feature adoption, upgrade intent events.
- Be intentional with auto-capture: it can be useful for discovery, but you should prune what you keep.
- Define a property policy: restrict high-cardinality properties unless you have a clear analysis use case.
If you are evaluating other categories in parallel, these buyer checklists can help you ask better questions: user analytics tools and product analytics tools.
Which tool fits which B2B SaaS scenario
Below are decision patterns I use to map company context to the right choice. The goal is to avoid the common mismatch: buying an enterprise-grade platform when you mainly need fast activation insights, or buying a lightweight tool when you actually need governance and deep analysis across teams.
Scenario mapping
- Early-stage, founder-led growth: You need reliable activation and onboarding insights fast, with minimal setup overhead.
- PM-led product org: You need deeper behavioral analysis, reusable cohorts, and consistent definitions across squads.
- Scaling GTM with RevOps: You need account-level views, alignment with CRM, and governance that prevents metric drift.
When Amplitude tends to be the better fit
- You have a product analytics owner and a clear taxonomy process.
- You expect many stakeholders to rely on the same definitions, and governance matters.
- You need advanced behavioral analysis as a core competency, not an occasional task.
When Mixpanel tends to be the better fit
- You prioritize speed to insight for product and growth teams and want broad self-serve usage.
- You want strong day-to-day workflows around funnels, retention, and segmentation without heavy process.
- You are comfortable managing event volume and keeping instrumentation disciplined as you scale.
When a lighter option like Founder OS is the better path
If your main goal is improving activation and feature adoption without hiring a dedicated analytics owner, a simpler setup can outperform a heavier platform on time-to-value. After running multiple tracking audits, the pattern was clear: teams that install once, get immediate event visibility, and iterate weekly on onboarding usually learn faster than teams that spend a month perfecting schemas before anyone looks at a funnel.
Founder OS is built for that “move fast” workflow: it starts capturing behavior quickly, ties events to user profiles, and helps you spot drop-offs and build segments you can act on, including routing segments into onboarding flows.
| Decision factor | Amplitude | Mixpanel | Founder OS (lighter path) |
|---|---|---|---|
| Best for | Teams investing in analytics as a durable system | Fast self-serve product and growth workflows | Founder-led teams optimizing activation and onboarding quickly |
| Typical risk | Overbuying depth before you have an operating cadence | Event sprawl if instrumentation discipline slips | May not fit complex enterprise governance needs |
| Time-to-value | Often improves after taxonomy + governance are in place | Often strong early if tracking is clean | Optimized for “install to first insight” speed |
| What to validate in a trial | Account-level views, governance, and repeatable analysis workflows | Funnels, retention, and segment reuse across teams | Activation funnel clarity, drop-off drill-down, and onboarding iteration loop |
FAQ
How many times should “amplitude vs mixpanel” come up in the buying process?
At least three: when you define your weekly question, when you estimate event volume and ownership, and when you run a hands-on trial using your real activation funnel. The “amplitude vs mixpanel” decision is usually decided by operating model, not marketing pages.
What is the fastest proof-of-fit test for Amplitude or Mixpanel?
Instrument a minimal activation funnel (signup → first value moment) and create two segments (ICP vs non-ICP). If you can’t build, compare, and explain drop-offs in under 60 minutes with your own data, implementation overhead will likely be your bottleneck.
How do I avoid event volume surprises?
Start with a small event set, be cautious with auto-capture, and restrict high-cardinality properties. Then monitor events per active user per day and set an internal budget so product changes do not accidentally double tracking volume.
Is there a good alternative if we mainly care about activation and onboarding?
Yes. If your primary goal is improving activation, feature adoption, and drop-off diagnosis without heavy governance, consider a lighter platform designed for fast setup and iteration. That is often a better fit than over-investing in a complex stack too early.
If you’re still split on amplitude vs mixpanel, run a 7-day trial where the output is one decision-ready activation report and one onboarding change you can ship. If you want a faster path to those insights with minimal setup, Founder OS can get you from install to actionable funnels and segments quickly, so you can improve activation before the next growth plateau.
Read Next
View all
Product Analytics Tools for B2B SaaS, How To Choose Without Buying Another Dashboard
A practical guide to choosing product analytics tools for B2B SaaS: data model, funnels, identity, and revenue insights without dashboard bloat.

Fix Your Customer Onboarding Platform Before It Bleeds Activation and Support Time
A practical blueprint to fix your customer onboarding platform, cut time-to-value, and reduce support load with measurable onboarding flows.
Sales Funnel Optimization for B2B SaaS, A Measurement-First Playbook
Learn sales funnel optimization for B2B SaaS with event tracking, leverage-point math, root-cause diagnosis, and experiments tied to revenue.