
Analytics For Product Managers, A Practical Framework For Turning User Data Into Product Decisions
Analytics for product managers, a practical workflow to pick metrics, diagnose drop-offs with funnels, and turn event data into product decisions.

Analytics for product managers works best as a repeatable decision workflow: define a product question, confirm the data you need, investigate with a consistent set of analyses, choose an action, and measure impact against a pre-agreed metric.
- Use a 5-step analytics workflow (question, hypothesis, instrumentation check, investigation, outcome tracking) to avoid dashboard-watching.
- Connect activation, retention, and revenue metrics via explicit causal links so each chart has a decision attached to it.
- Diagnose issues with the same three lenses every time: funnels (where), cohorts (when), segmentation (who).
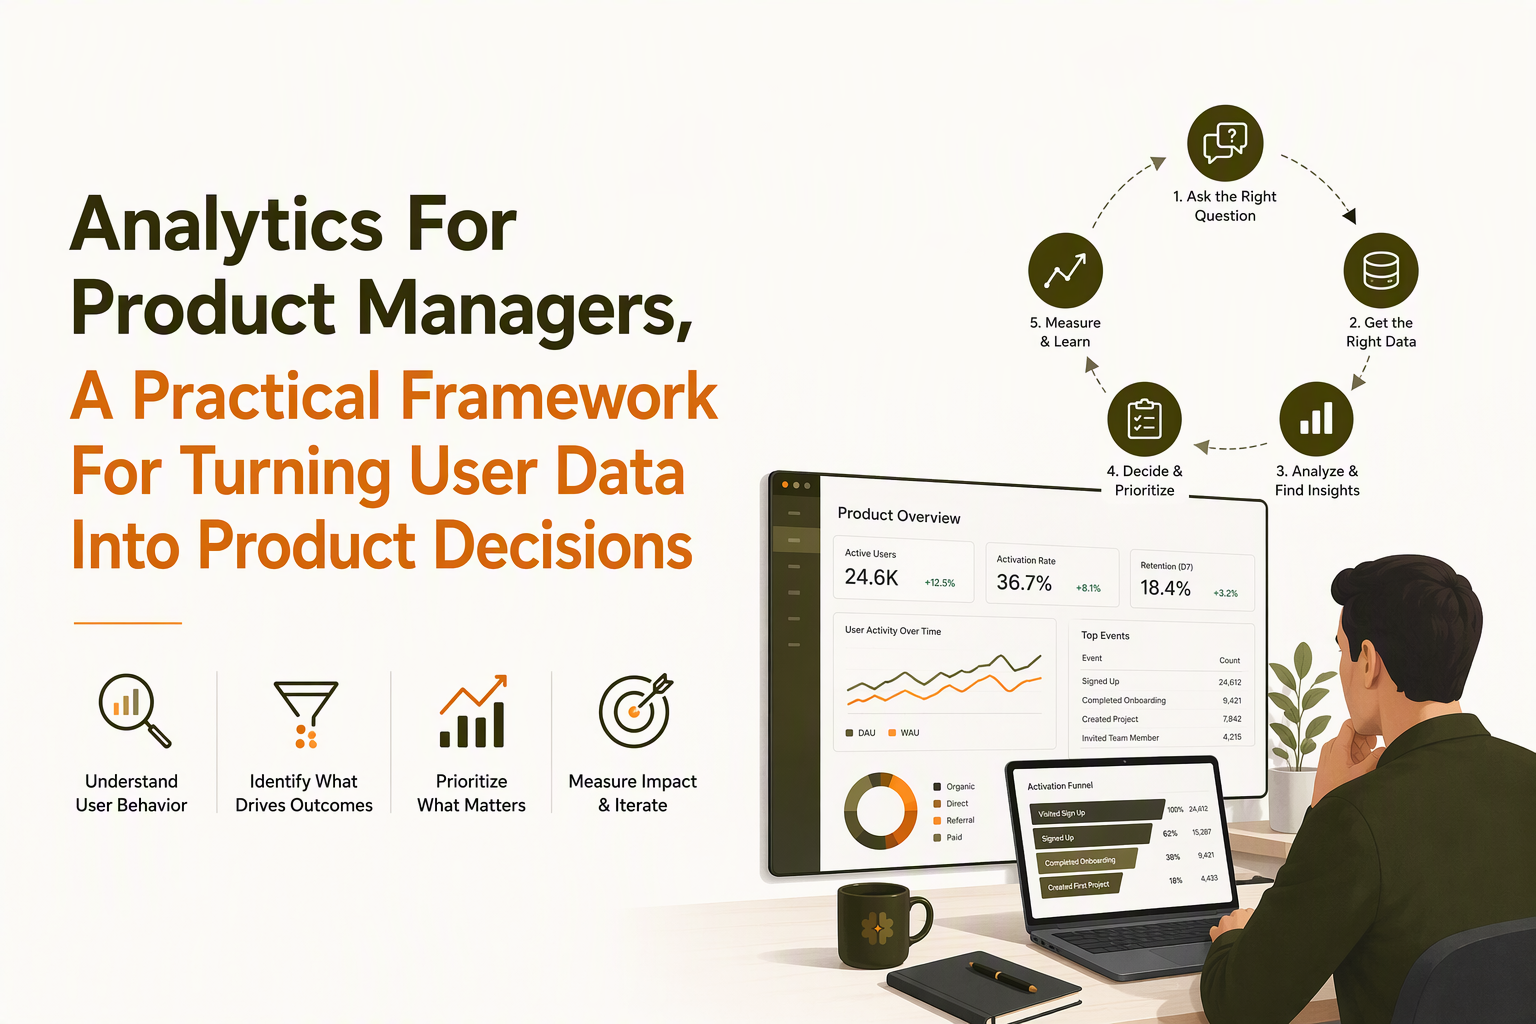
Build a product analytics workflow that turns user data into decisions
A practical analytics for product managers workflow turns every chart into a decision by enforcing one invariant: no analysis without a defined question and a measurable “done” condition.
Why passive tracking fails (and what replaces it)
Teams usually fail at analytics in two predictable ways: (1) dashboards accumulate faster than decisions, and (2) instrumentation debt makes “answers” untrustworthy. The fix is not more charts, it is a tighter loop between the question, the minimum data required to answer it, and an explicit action you are willing to take if the answer is X vs Y.
The 5-step PM decision loop (reusable)
- Write the product question as a decision. Format: “Should we do A or B to move metric M for segment S within time window T?”
- State a falsifiable hypothesis. “If we reduce step-2 friction, activation rate for self-serve signups will increase.”
- Verify data readiness before analysis. Confirm events, identities, time zone, and definitions. If you have not documented analytics events tracking, do that first or your investigation will be noise.
- Investigate using a fixed analysis stack. Start with a funnel or trend, then segment, then drill into user paths or sessions.
- Close the loop with an outcome log. Record what changed, when it shipped, the expected metric movement, and the observed result after an agreed waiting period.
A one-page “analytics brief” template
- Decision: What will we choose after seeing the data?
- Metric: Exact definition (numerator/denominator), time window, and segment.
- Primary funnel: Steps and inclusion rules.
- Guardrails: What must not degrade (support tickets per active user, refunds, latency, etc.).
- Expected mechanism: Why this should move (behavior change).
- Next action: If drop-off is highest at step X, we will do Y.
Instrumentation check you can run in 15 minutes
- Event exists: Each funnel step has an event that fires once per intended action.
- Identity is stable: Anonymous to authenticated user stitching is consistent.
- Properties are usable: Key dimensions are present (plan, channel, role, workspace).
- Backfill expectation: You know whether the dashboard reflects historical data or only new events.
Choose the right product metrics across activation, retention, and revenue
Analytics for product managers becomes decision-grade when every metric is tied to a user behavior you can influence and a business outcome you can defend.
Metric hierarchy that prevents “dashboard sprawl”
- North Star: A single value metric that correlates with long-term revenue (for many B2B SaaS products, it is tied to repeated successful usage in the workspace).
- Input metrics: Behaviors that lead to the North Star (activation, key feature adoption, successful outcomes).
- Diagnostic metrics: Explain changes in input metrics (step-level conversion, time-to-value, error rates, onboarding completion).
- Business metrics: Revenue, expansion, churn, payback period (often owned with Growth/Finance, but influenced by product decisions).
A practical mapping: metric to decision
| Area | Metric (example definition) | PM decision it should drive | Common pitfall |
|---|---|---|---|
| Activation | Activation rate = users who complete “Aha action” within 7 days / new signups | Which onboarding step to simplify or remove | Changing the definition every quarter |
| Engagement | WAU per account, or key action frequency per active workspace | Which workflows to streamline or nudge | Using DAU/MAU without a product-specific meaning |
| Retention | Logo retention by cohort (week 4, week 12) and usage retention (key action) | Which segment is slipping and why | Only tracking overall retention (hides segment churn) |
| Revenue | Trial-to-paid conversion, expansion rate, LTV drivers | Where product friction blocks monetization | Attributing revenue shifts to product without controlling for sales or pricing |
Activation, retention, and revenue: connect them with a causal chain
Instead of tracking metrics in parallel, write a causal chain you can test: onboarding completion increases first successful outcome, which increases week-4 usage retention, which increases trial-to-paid conversion (or reduces early churn). In our experience working with self-serve B2B SaaS teams, the fastest clarity comes from making this chain explicit and then instrumenting only the events needed to validate each link.
Recommended “minimum viable set” of PM metrics
- Activation: activation rate, time-to-first-value (median), and step-level onboarding completion.
- Adoption: adoption curve for 1 to 3 core features (first use and repeated use).
- Retention: cohort retention for key action, plus churn reasons tagged to segments.
- Monetization: trial-to-paid conversion by activation cohort, and expansion triggers (feature usage thresholds).
Use funnels, cohorts, and segmentation to diagnose product problems
Analytics for product managers becomes actionable when you diagnose issues with the same three lenses every time: funnels tell you where users drop, cohorts tell you when behavior changes, and segmentation tells you who is affected.
Lens 1: Funnel diagnostics (where the momentum breaks)
Start with a funnel that matches the user’s real sequence, not your internal org chart. If conversions “look bad,” resist jumping to redesign and run a structured funnel analysis instead:
- Pin down inclusion: new users vs returning, by channel and plan.
- Choose step granularity: 4 to 7 steps is usually enough to isolate a bottleneck without overfitting.
- Split by “intent” segments: users who invited a teammate, connected an integration, or created a first project.
- Drill down to user paths: compare successful sessions to failed sessions to find repeated detours.
Lens 2: Cohorts (when the problem started)
Cohorts prevent you from treating a product change like a seasonal fluctuation. A simple pattern: create weekly signup cohorts and track (a) activation within 7 days and (b) key action retention in week 4. If cohort N drops immediately after a release, you have a strong lead; if the decline is gradual across multiple cohorts, it is more likely acquisition mix, pricing, or market shift.
Lens 3: Segmentation (who is failing and why)
Segment by behavior first, traits second. Examples that reliably surface root causes:
- Activated vs not activated: compare what the activated cohort did in the first session.
- Fast time-to-value vs slow: check whether slow users hit errors, missing permissions, or configuration loops.
- Single-seat vs multi-seat: see whether inviting teammates correlates with retention in your product.
What surprised our team was how often “low conversion” was actually “wrong audience from one channel” rather than a broken onboarding. Segmentation by source and first-session intent usually exposed this within 30 minutes.
Three realistic SaaS investigations (with next actions)
- Activation drop after a UI refresh: Compare funnels by pre-change vs post-change cohorts, then watch session replays or path sequences around the highest drop-off step; ship a hotfix to clarify the call-to-action or restore a removed affordance.
- Core feature adoption stalls: Plot adoption curves by role (admin vs member) and by “setup completed” behavior; add in-product education only to the segments that fail to discover the feature.
- Retention dips in week 3: Build a cohort chart for key action retention and segment by account size; if multi-seat accounts retain but single-seat churns, prioritize collaboration value or upgrade prompts differently.
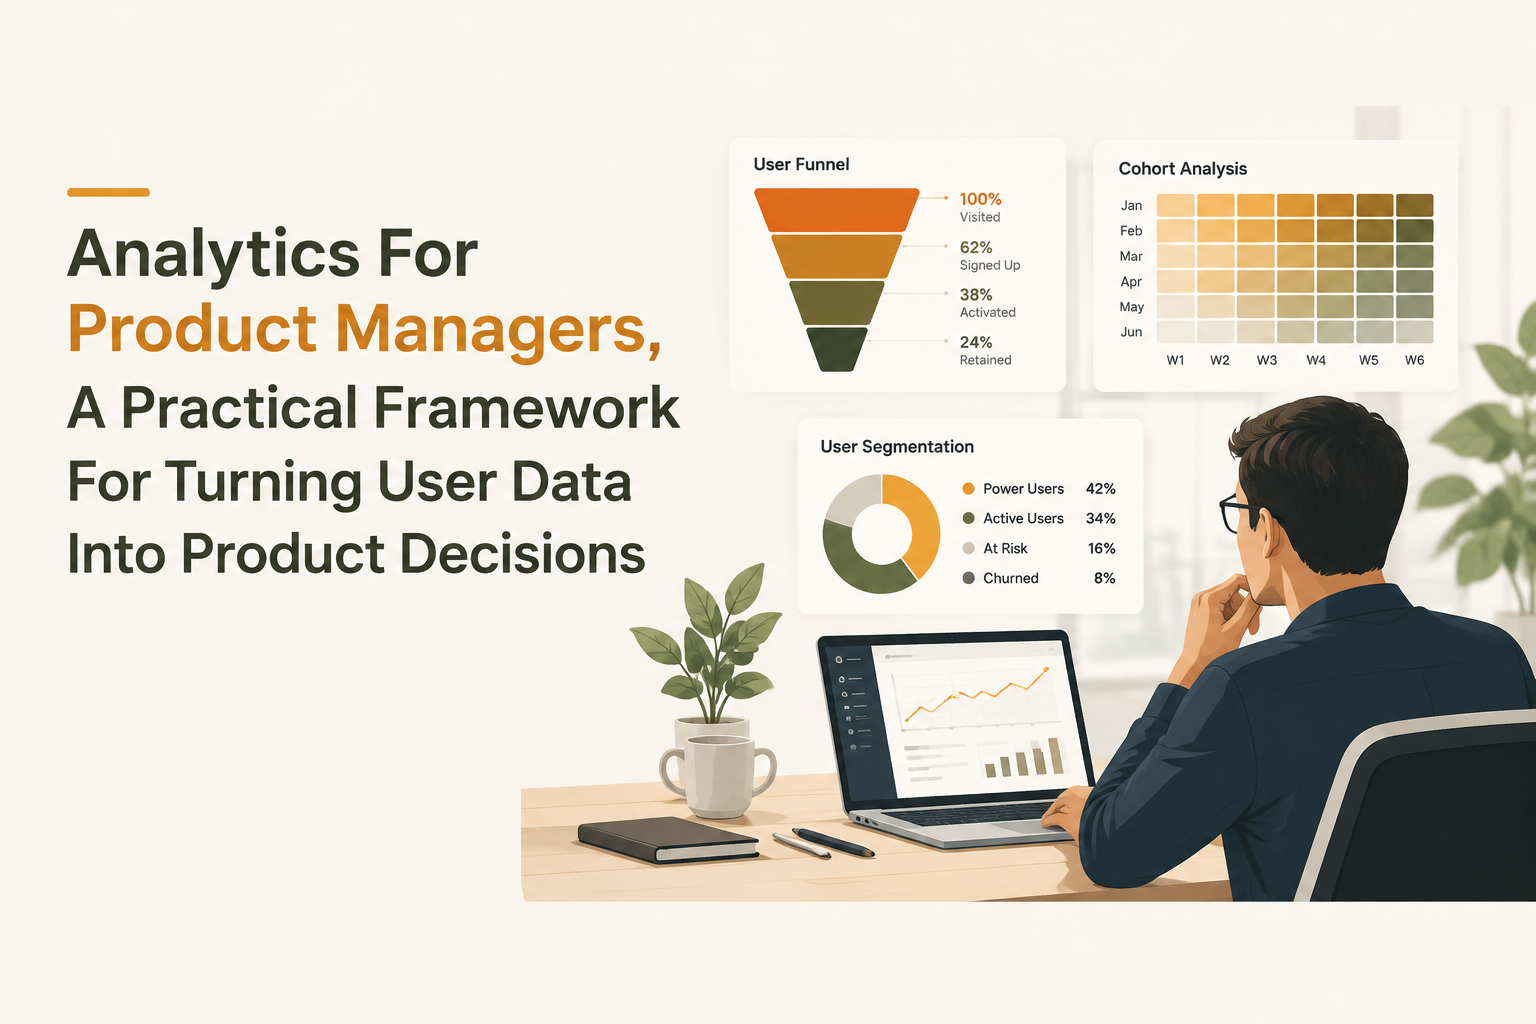
Create a PM analytics toolkit with templates, dashboards, and learning paths
Analytics for product managers becomes faster and more consistent when you standardize the artifacts: briefs, dashboards, checklists, and an investigation routine that anyone on the team can repeat.
The 3 dashboards PMs actually use (and what each must answer)
- Weekly product health: “Did anything break?” Include activation rate, key action volume, error events, and top drop-off step.
- Lifecycle dashboard: “Where are we losing users?” Include acquisition to activation funnel, activation cohorts, and week-4 retention.
- Feature dashboard (per bet): “Is the new capability adopted by the right users?” Include first use, repeated use, and adoption by segment.
An investigation checklist you can copy into every ticket
- Confirm the metric definition (time window, segment, dedupe rules).
- Check tracking integrity (event firing rate, known deploy changes).
- Locate the “where” (funnel step, screen, or workflow).
- Identify the “who” (behavioral segment, channel, plan, role).
- Explain the “why” (paths, error events, friction signals).
- Propose the smallest testable change and define success + guardrails.
Skill roadmap: what to learn next (in the order it pays off)
- Event design and tracking plans: Start with digital product analytics documentation so “activation” and “core action” are consistent across teams.
- Segmentation logic: Behavioral cohorts, recency/frequency, and journey stages.
- SQL basics: Enough to validate dashboards and answer one-off questions.
- Experimentation: Pre-registration of metrics, sample ratio checks, and interpretation, especially when changes are subtle.
Where a unified platform helps (one body mention)
When teams want one workflow from tracking to diagnosis to action, a platform like Founder OS can reduce handoffs by combining product tracking, user profiles and segmentation, GTM reporting, and an onboarding tool, so a PM can go from “drop-off at step 3” to “which users dropped and what did they do next” without waiting on a separate data queue.
Evaluate product analytics tools based on PM workflows
Analytics for product managers tool selection should be driven by workflow fit: how quickly you can instrument, segment, diagnose funnels, and share decision-ready narratives.
PM-focused evaluation criteria (use this scorecard)
- Setup effort: Can you start with auto-captured events, or do you need an engineering sprint?
- Identity and user profiles: Can you stitch anonymous to logged-in behavior and analyze at person and account levels?
- Segmentation power: Behavioral segments, not just traits; real-time refresh matters for lifecycle workflows.
- Funnel flexibility: Any-event funnels, cohort comparisons, and drill-down to users or sessions.
- Governance: Event naming conventions, versioning, and access controls.
- Data export and interoperability: Can you move data to a warehouse or BI tool as you scale?
Where common tool categories fit (without a feature checklist)
- Product analytics tools (Mixpanel/Amplitude class): Best for event-based funnels, cohorts, and segmentation for PMs. Tradeoff: needs disciplined event design to stay clean.
- Web analytics tools (Google Analytics class): Useful for acquisition and web journey measurement. Tradeoff: product-level behavioral analysis can be limited unless implemented carefully.
- BI and warehouse-first (Looker, etc.): Best for cross-functional reporting and finance-grade metrics. Tradeoff: slower for interactive product investigations unless you have strong data support.
If you are actively deciding between two PM-centric product analytics tools, the most practical next step is to define your must-have workflows and validate them hands-on; a useful reference is amplitude vs mixpanel.
Apply analytics to modern SaaS products including AI features
Analytics for product managers in AI-powered experiences requires measuring not only clicks and conversions but also quality signals, time saved, and downstream retention impact.
Instrument AI features with three layers of events
- Input events: prompt submitted, context attached, settings chosen, model option selected.
- Output events: response generated, latency bucket, refusal/error type, safety filter hit.
- Outcome events: accepted, edited, copied, applied to a workflow, shared, exported, or reverted.
Quality metrics that stay honest without inventing “AI scores”
- Adoption: % of active users who try the AI feature and return to it within 7 days.
- Success proxy: accept rate (accepted/applied) and edit distance proxy (edited vs accepted as-is).
- Reliability: error rate, timeout rate, and p95 latency buckets, tracked as guardrails.
- Business linkage: Compare retention or conversion for users who reach a meaningful AI outcome vs those who do not.
A simple investigation pattern for “AI feature is used but not valued”
- Segment by outcome: users who apply outputs vs users who only generate.
- Compare retention: week-4 key action retention for both segments.
- Locate friction: paths after generation; do users hit errors, confusing UI, or missing context?
- Ship the smallest change: better defaults, clearer affordances, or contextual prompts, then re-check accept rate and downstream retention.
After running multiple audits of AI-assisted workflows, the pattern was clear: measuring “generation count” inflated perceived success, while “applied output” correlated much better with retention and expansion conversations.
| Reusable artifact | When to use it | What it prevents |
|---|---|---|
| Analytics brief (1 page) | Before any investigation or experiment | Unclear decisions and moving goalposts |
| Funnel + segment pack | Activation drops, onboarding issues | Blaming UX without isolating the step and audience |
| Cohort retention sheet | Retention dips, post-release regressions | Confusing seasonality with product impact |
| Outcome log | After shipping changes | Repeating the same debates each quarter |
FAQ
How many events do product managers actually need to track?
Start with the minimum set needed to answer your top 3 decisions: an activation funnel (4 to 7 steps), 1 to 3 core feature events (first use and repeat use), and retention events tied to successful outcomes. Add depth only when a decision depends on it.
What is the best first analysis when activation drops?
Run a step-by-step funnel split by cohorts (before vs after the change) and then segment by channel and intent behaviors. The goal is to isolate whether the drop is a specific step regression or an audience mix shift.
How do I prevent teams from arguing about metric definitions?
Write metric definitions into a tracking plan: exact event names, inclusion rules, time window, deduping, and who owns changes. Treat definition changes like product changes, with versioning and an effective date.
Should PMs learn SQL if they already have dashboards?
Basic SQL pays off because it lets you validate dashboards, spot tracking anomalies, and answer one-off questions faster. You do not need advanced modeling to be effective, but you should be able to sanity-check the data behind a decision.
If you want to implement this decision workflow end-to-end without stitching multiple tools together, Founder OS supports event-based product tracking, user profiles and segmentation, GTM reporting, and onboarding analysis so PMs can diagnose drop-offs and measure outcomes in one place.
Read Next
View all
User Behavior Analytics Tools for B2B SaaS - How to Choose and What to Shortlist
Learn how to shortlist user behavior analytics tools for B2B SaaS using criteria tied to activation, funnels, and revenue outcomes.
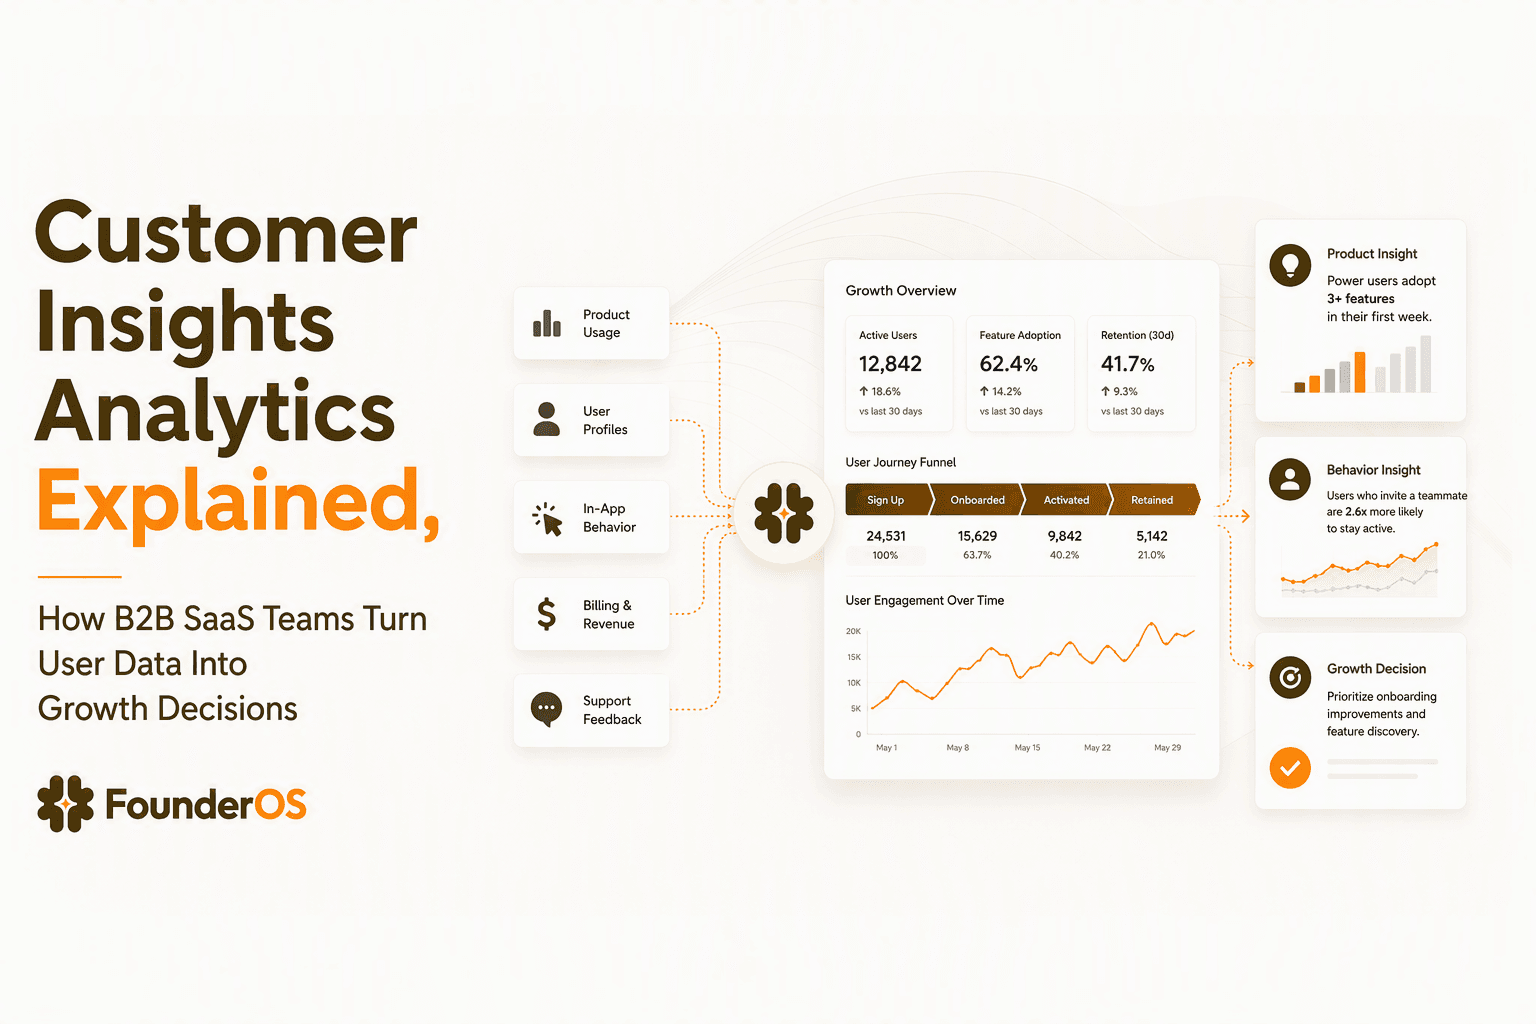
Customer Insights Analytics Explained, How B2B SaaS Teams Turn User Data Into Growth Decisions
Learn how customer insights analytics helps B2B SaaS teams connect user behavior, product data, and revenue signals to make growth decisions.

Guided Walkthrough Software, The Activation-First Buyer Scorecard and Shortlist
Compare guided walkthrough software with an activation-first scorecard, tool categories, analytics proof, and a 7-day pilot plan.