
Digital Product Analytics for B2B SaaS, The Tracking Plan and First Reports to Implement This Week
Digital product analytics is the fastest way for a B2B SaaS team to connect what users do in-product to activation, retention, and revenue, using consistent event data you can trust for decisions. The practical goal is not more dashboards, it is a tracking plan and a week-1 reporting cadence that reliably answers questions like “where does activation break?” and “which behaviors predict upgrades?” without a data team on standby.
- Start with a minimum viable tracking plan: 15 to 25 events, strict naming rules, and 8 to 12 required properties that make analyses reusable.
- Run three reports in week 1 using the same schema end-to-end: one activation funnel, one retention cohort, and one behavior-based segment tied to a revenue outcome.
- Choose a platform by validating implementation speed, identity resolution, governance, and privacy controls using a short vendor test plan.
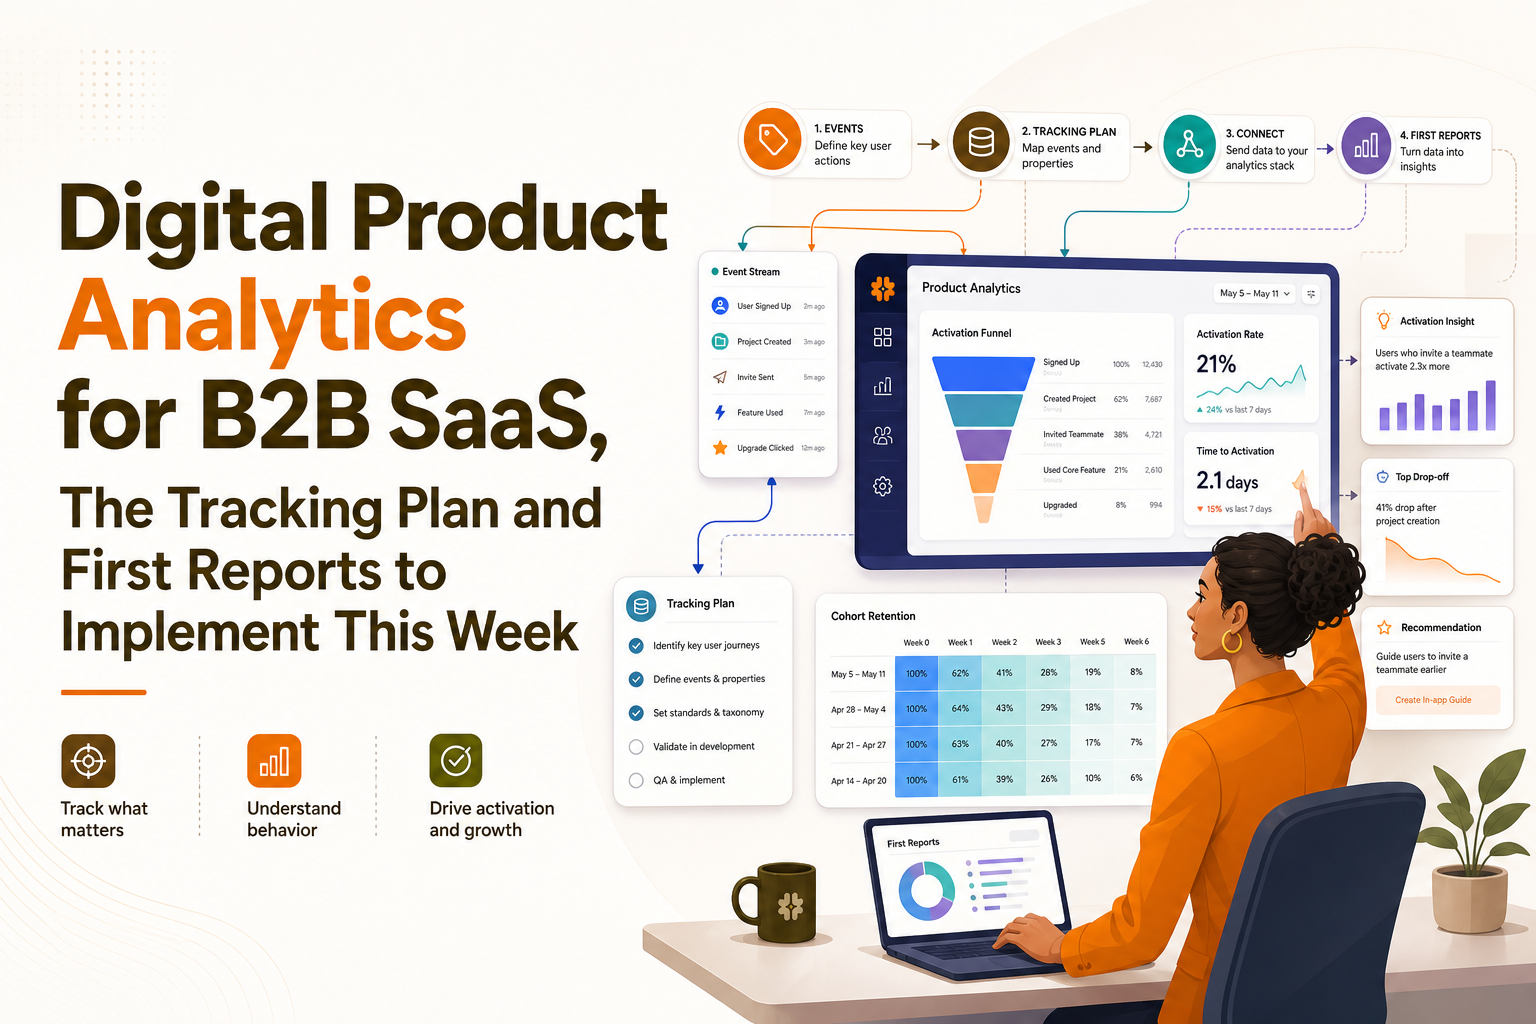
Digital Product Analytics, Defined for SaaS Teams (Not Web Analytics)
Digital product analytics answers “how users experience and adopt the product” by measuring event-level behavior across the full journey from first touch to activation and retention, rather than page-centric traffic metrics. Web analytics can tell you sessions and pageviews; product analytics tells you who did what, in what order, and what happened next.
What it includes and excludes (so you do not overbuild)
Include user events (feature use, key actions, errors), identity and account context, and analysis workflows like funnels, cohorts, and segmentation that tie to outcomes. Exclude vanity traffic reporting, one-off SQL dashboards without governance, and “track everything” schemas that no one maintains.
In practice, digital product analytics for a B2B SaaS is successful when it produces:
- A shared definition of activation (one or two concrete events) and a measurable activation rate over time.
- At least one reliable conversion funnel from signup to first value.
- A retention view that identifies disengagement early enough to intervene.
Boundaries that keep data usable
The most common failure mode is blending three different measurement systems into one messy event stream: marketing attribution, support logging, and product behavior. Set boundaries up front:
- Product events describe actions users take inside your app (and key lifecycle moments like signup, upgrade, cancellation).
- Marketing attribution is captured as properties on the user or account profile (for example, initial_utm_source), not as “events” repeated on every click.
- Support and ops logs stay in their systems unless they represent user-impacting product moments (for example, “subscription_failed”).
Success metrics you can defend in a revenue conversation
Pick 3 to 5 metrics that can be computed from your minimum schema and reviewed weekly:
- Activation rate: % of new signups that reach your activation event within X days.
- Time to first value: median time from signup to activation event.
- Core feature adoption: % of active accounts using the primary feature weekly.
- Retention: week-1 and week-4 retention (or month-1 for longer cycles).
- Expansion signal: behaviors that precede upgrade (for example, “add_teammate” or “hit_usage_limit”).
The Minimum Viable Tracking Plan That Still Answers Revenue Questions
A minimum viable tracking plan for digital product analytics is a copy-ready event taxonomy with strict naming and required properties, typically 15 to 25 events, that supports funnels, retention, and segmentation without rewrites. If you cannot reuse the same events across multiple reports, the schema is not minimal, it is incomplete.
Event naming rules (copy this into your spec)
- Format: verb_object (snake_case), for example
project_created,integration_connected. - Use past tense to represent a completed action (created, invited, exported).
- Avoid UI words like “button_clicked” unless the click is itself meaningful (it usually is not).
- One event per intention: do not create three events for the same thing across platforms (web, app, mobile).
- Version your meaning, not your name: if the behavior changes, keep the event name and add a property like
flow_version.
Identity model for B2B SaaS (the part teams regret skipping)
B2B SaaS needs a three-layer identity approach: anonymous visitor (pre-signup), user (person), and account (workspace, org). Your tracking plan should specify:
- Anonymous ID: set on first visit; used until login.
- User ID: stable internal identifier; set at signup/login and used thereafter.
- Account ID: stable identifier for the workspace or org; attached to all post-signup events.
After running several tracking audits, the pattern was clear: most “data quality” problems were actually identity problems, especially when invites, multi-workspace users, or sales-assisted trials were involved.
Required properties (8 to 12) that make analysis reusable
Keep properties consistent across events so any funnel or cohort can be segmented the same way. A practical baseline:
- user_id, account_id, anonymous_id (where relevant)
- timestamp (server-side if possible for billing events)
- plan (free, trial, pro), billing_period (monthly, annual)
- role (owner, admin, member) if permissions matter
- source or initial_utm_source (as a profile or first-touch property)
- app_version or release (helps correlate to product changes)
- environment (prod, staging) to keep test data out
Minimum event taxonomy (15 to 25 events) for activation to revenue
The exact taxonomy depends on your product, but the structure below works across most B2B SaaS motions. Replace bracketed items with your domain object names.
| Category | Events (examples) | Why it matters | Must-have properties |
|---|---|---|---|
| Acquisition and signup | signup_started, signup_completed, email_verified |
Defines the top of activation funnel and friction | initial_utm_source, auth_method |
| Workspace and invite | workspace_created, teammate_invited, invite_accepted |
Captures multi-user value, often a leading upgrade signal | account_id, invite_count |
| Activation (first value) | [core_object]_created, [core_action]_completed |
Your activation definition should be one of these | core_object_type, flow_version |
| Feature adoption | integration_connected, report_exported, alert_created |
Explains retention and expansion drivers | integration_name, export_format |
| Monetization lifecycle | trial_started, plan_upgraded, payment_succeeded, cancellation_requested |
Lets you connect behaviors to revenue outcomes | plan, mrr_delta (if available), reason |
| Quality and friction | error_shown, integration_failed, permission_denied |
Identifies silent blockers that break activation | error_code, surface |
Where “product analytics tools” fit into the plan
The best product analytics tools make it easy to implement this minimum plan, enforce naming consistency, and keep identities clean as your team ships. If a vendor cannot show you how it handles anonymous-to-known user stitching and account-level context, you will pay for it later in reporting rework.
Three Core Analyses to Run in Week 1, With the Same Event Schema End to End
Three week-1 analyses make digital product analytics operational fast: an activation funnel, a retention cohort, and a behavior-based segment you can route to onboarding or sales. The key is that all three reuse the same events and properties, which is why the tracking plan matters more than the dashboard layout.
1) Activation funnel that pinpoints your first real drop-off
Build a funnel that represents the shortest path to first value, using only completed actions. Example for a B2B SaaS with a workspace and integration setup:
signup_completedworkspace_createdintegration_connected[core_action]_completed(your activation event)
Make the funnel actionable by adding two required breakdowns:
- Breakdown by initial_utm_source or acquisition channel to see if certain channels bring low-fit users who never activate.
- Breakdown by role (owner vs member) to catch permission-related activation failures.
When we tested this exact funnel structure on a sales-assisted trial motion, what surprised our team was that the biggest drop was not onboarding. It was between workspace_created and integration_connected, which immediately shifted our roadmap to fixing integration setup friction.
If you need a deeper diagnostic method for confusing conversion paths, use a dedicated funnel analysis workflow that drills from aggregate drop-off into user-level sessions.
2) Retention cohort that separates “came back” from “got value again”
Retention is only meaningful when it is anchored to a value event, not just a login. Choose one of these patterns:
- Product usage retention: user is retained if they fire
[core_action]_completedin week N. - Account retention: account is retained if any user in the account fires the value event (better for multi-seat products).
Start with weekly cohorts if your product has frequent usage, or monthly cohorts for longer cycles. Then segment by plan, account_size (if you have it), and initial_utm_source. A worked approach to definitions and interpretation is covered in this retention analysis guide.
3) Segmentation that produces a list you can act on this week
Segmentation becomes revenue-relevant when it defines a group based on behavior sequences and recency, then routes that group to an intervention. Start with one segment in each direction:
- High-intent activators: users who completed
workspace_createdandintegration_connectedbut not[core_action]_completedwithin 24 to 72 hours. - At-risk accounts: accounts with no
[core_action]_completedin the last 7 to 14 days after previously being active.
Define the segment as a rule you can reuse:
- Sequence: did events A then B happen?
- Recency: did event C not happen in the last X days?
- Context: only include plan = trial or pro, role = owner, or segment by team size.
In our experience working with early-stage B2B SaaS teams, the biggest unlock is turning segmentation into a weekly operating rhythm instead of a one-time analysis. A practical framework is in this user segmentation article.
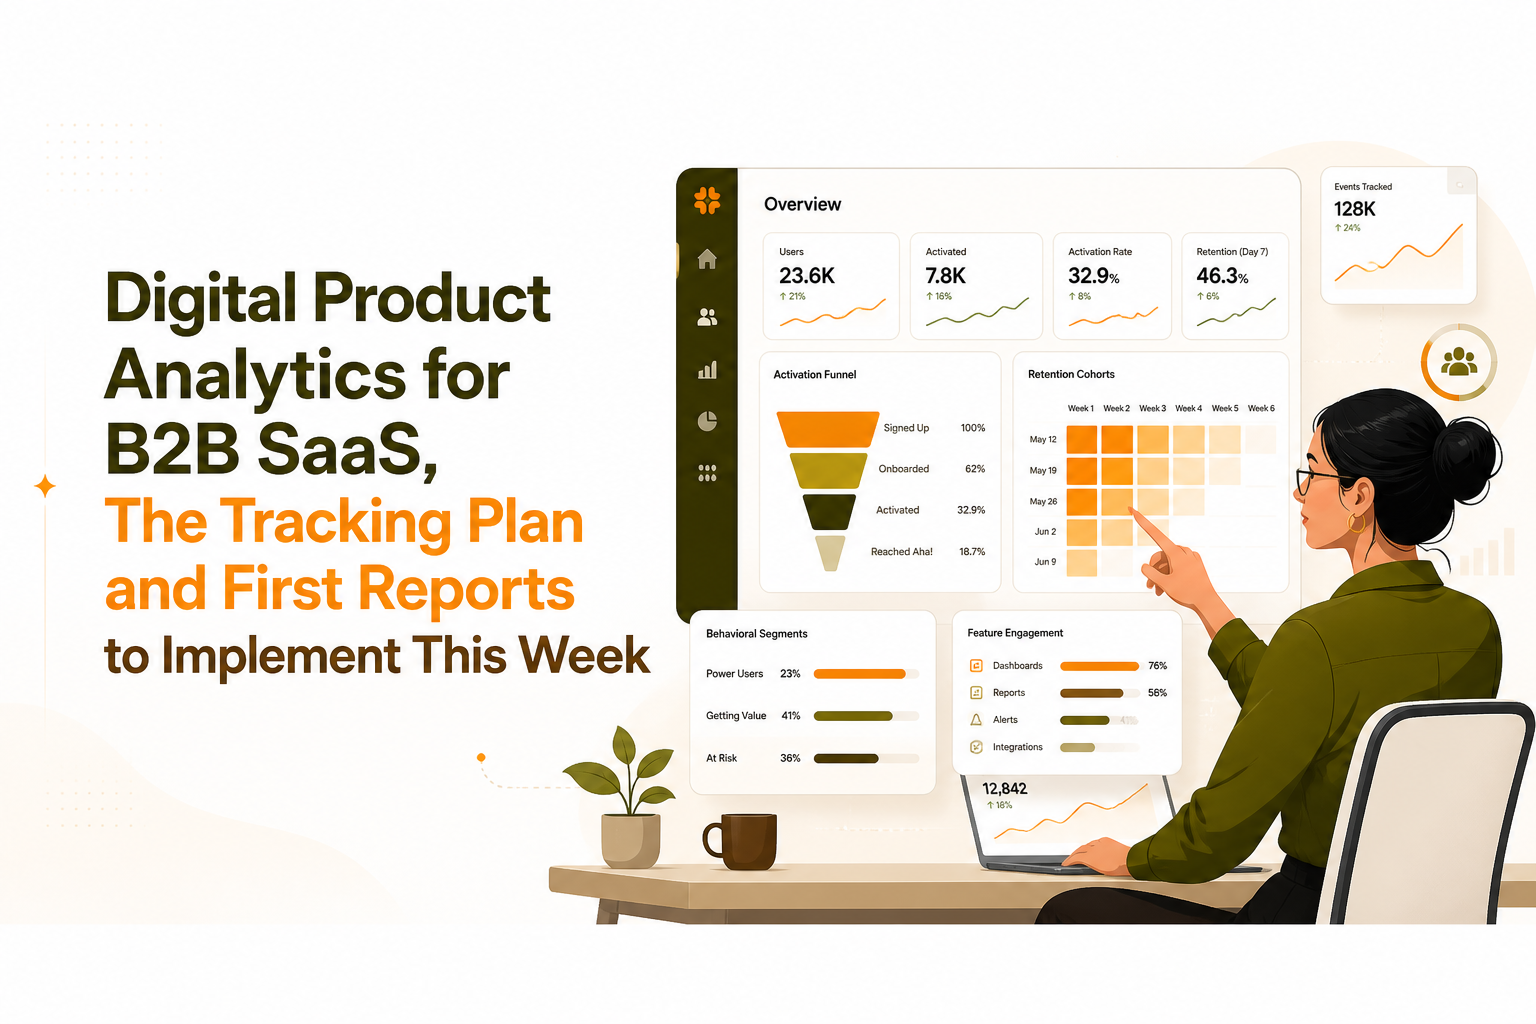
Evaluation Checklist, How to Choose a Digital Product Analytics Platform Without Regret
The best way to choose a digital product analytics platform is to validate implementation speed, identity accuracy, and governance using a short test plan before you commit your tracking plan to it. Pretty charts are table stakes; the real differentiators show up in week 2 when definitions change and stakeholders want answers fast.
Decision checklist by capability (use this in demos)
| Capability | What to verify | Red flag |
|---|---|---|
| Implementation effort | Can you capture page views, clicks, and form events immediately, plus add custom events with minimal code? | Requires weeks of manual tagging before any insight |
| Identity resolution | Can you stitch anonymous to known users, and support account-level analysis? | Only supports user-level IDs or loses pre-signup behavior |
| Governance | Can you enforce naming conventions, document events, and filter test data? | Event chaos grows with no way to manage it |
| Real-time usability | Can you see events within seconds for QA and rapid iteration? | Long ingestion delays make debugging painful |
| Privacy and security | Does it support data minimization, PII controls, and clear retention settings? | Unclear policies or you cannot control sensitive properties |
| Activation and onboarding tie-in | Can analytics segments trigger in-product onboarding or alerts? | Insights exist but cannot drive action without heavy integration work |
A simple vendor test plan (do this before buying)
- Install in staging and generate 50 to 100 test events covering your core taxonomy.
- Run identity edge cases: invite a teammate, join multiple workspaces, and confirm account-level reporting.
- Build one activation funnel from signup to activation event and verify step counts match your app logs.
- Create two segments (high-intent, at-risk) and confirm segment membership updates as events fire.
- Export or integrate a segment list to whatever action system you actually use (email, CRM, in-app onboarding).
Where event analytics fits in your stack
For many teams, event analytics becomes the behavioral source of truth that complements billing, CRM, and support data. The platform you choose should make it easy to connect “what the user did” with “what the business outcome was,” even if revenue itself lives elsewhere.
Implementation Plan, Go Live in 7 Days Without Breaking Your Data
A 7-day digital product analytics rollout is realistic when you start with a minimum schema, add QA gates, and ship in two layers: auto-capture for immediate visibility and a small set of custom events for decisions. The goal is to go live with reliable activation and retention reporting, not to reach perfect coverage.
Day-by-day rollout timeline
- Day 1: Define activation and scope. Write your activation event definition, choose 15 to 25 events, and lock naming rules.
- Day 2: Implement base tracking. Install the snippet or SDK, enable auto-capture where appropriate, and set environment filtering.
- Day 3: Implement custom events. Add 5 to 10 custom events around core value, monetization lifecycle, and major friction points.
- Day 4: Identity and account stitching. Ensure login, logout, invite flows, and workspace switching attach correct user_id and account_id.
- Day 5: QA and data validation. Compare funnel step counts to server logs for a sample window; verify event properties.
- Day 6: Build week-1 dashboards. Create the activation funnel, retention cohort, and two operational segments.
- Day 7: Governance and cadence. Document events, assign an owner, and set a weekly review meeting with a change process.
QA checklist (printable)
- No duplicate events from multiple clients (web and server) unless explicitly intended.
- All production events include account_id post-signup and use stable user_id.
- Test traffic excluded via environment property or filtering rules.
- Properties consistent: plan values are normalized (no “Pro”, “pro”, “PRO”).
- Timestamp sanity: server-side billing events use server time to avoid timezone and client clock skew.
Common pitfalls and fixes
- Pitfall: Tracking UI clicks instead of intentions. Fix by rewriting events to represent completed outcomes, then rebuild funnels.
- Pitfall: Activation defined too late. Fix by choosing an earlier value event and tracking time-to-first-value as a complement.
- Pitfall: No account-level view. Fix by attaching account_id to all post-signup events and deciding account retention vs user retention.
- Pitfall: Unowned schema changes. Fix by adding a lightweight governance step: new events require name review and property checklist.
How Founder OS Covers the Requirements for Tracking, Profiles, Segments, GTM Reports, and Onboarding
Founder OS supports a practical digital product analytics setup by capturing user behavior immediately after install, tying events to user profiles and accounts, and turning segments into actions through onboarding and reporting workflows. For a B2B SaaS team trying to go from “we think” to “we know” in a week, that combination matters more than a long feature checklist.
Fast start path using your minimum tracking plan
- Install once to start capturing page views, clicks, and form events, then add a small number of custom events for activation and monetization.
- Verify identity by confirming each event is tied to a user profile and the right account context, so you can analyze both person and workspace behavior.
- Build the week-1 reports: an activation funnel to spot drop-offs, a retention view for early disengagement, and dynamic segments based on real usage patterns.
- Route segments into onboarding so high-intent users get guided to the next step and at-risk users get a re-engagement prompt before churn.
What to validate in a demo (bring your own events)
- Event stream to dashboard latency: confirm you can see events for QA within seconds after firing.
- Funnel drill-down: confirm you can click from a drop-off step into individual user sessions to diagnose why momentum broke.
- Segment freshness: confirm behavioral segments refresh automatically as users act, without manual rebuilds.
- GTM reporting alignment: confirm reports can reflect your activation and adoption definitions, not just generic engagement metrics.
| If you need this outcome | Your tracking plan should include | The week-1 report to build |
|---|---|---|
| Improve activation | signup_completed, workspace_created, activation event | Activation funnel by channel and role |
| Reduce early churn | core value event, recency properties, account_id | Weekly retention cohorts and at-risk segment |
| Drive expansion | invite events, usage limit events, plan_upgraded | Behavior segment that precedes upgrade |
FAQ
If you want to implement the tracking plan above and see your first activation funnel and retention cohorts within a week, book a demo of Founder OS and bring your current event list or onboarding flow so you can validate identity stitching, segmentation, and reporting against real product behavior.
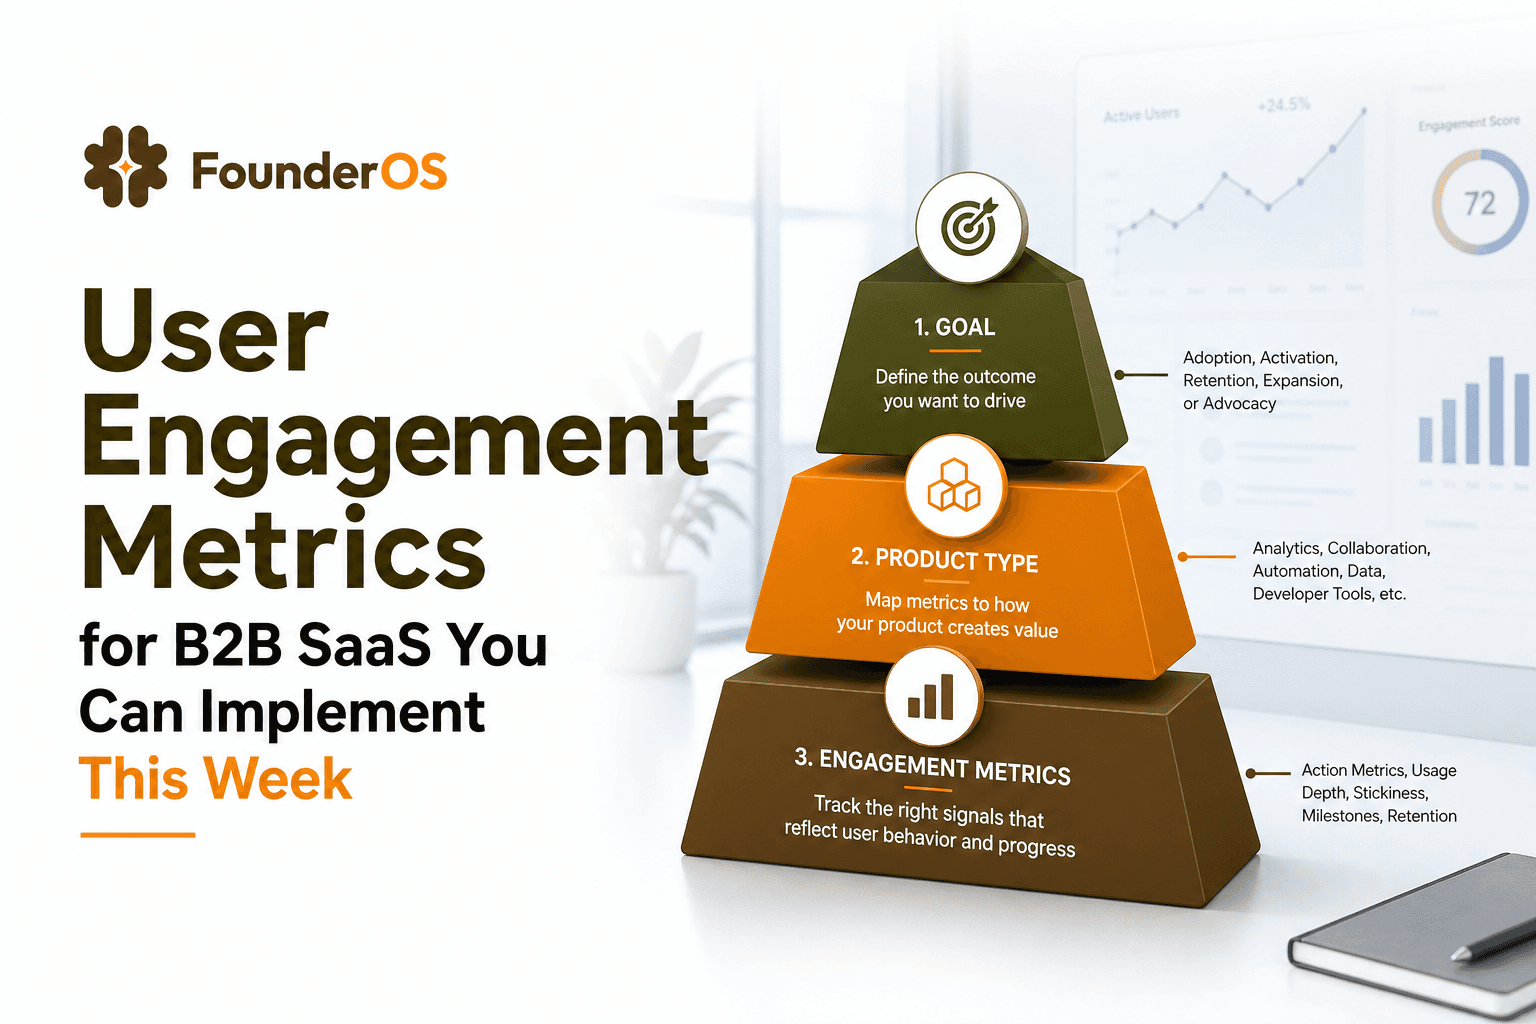
User Engagement Metrics for B2B SaaS You Can Implement This Week
A practical framework to choose user engagement metrics, instrument them in GA4 and product analytics, and turn signals into activation and retention wins.

Guided Walkthrough Strategy for SaaS Activation, A Build-Measure-Iterate Playbook
Build a guided walkthrough that drives activation with outcomes, branching, segmentation, and measurement, plus a 1-week iteration loop.

High Churn Explained, What Counts as High and What to Check First
High churn explained by type, thresholds, and a fast triage checklist to diagnose churn drivers before fixing anything.