
Retention Analysis for B2B SaaS, Formulas, A Worked Example, and How to Interpret 90% Retention
Retention analysis is the process of measuring who comes back (and who stays paid), then using that evidence to decide what to fix in onboarding, product, and lifecycle messaging. Retention analysis, sometimes referred to as survival analysis, measures the share of a starting cohort that remains active or paying over time. In B2B SaaS, the fastest way to waste time is to calculate “retention” one way, interpret it another way, and ship changes that do not move the curve.
- Pick the retention definition based on the decision: logo retention for customer count, revenue retention for dollars, cohort retention for product behavior over time.
- Compute retention from clearly defined numerators and denominators, then interpret “90% retention” only in the context of time window, cohort, and metric type.
- Turn the curve into action by linking drop-offs to event sequences, segments, and onboarding experiments with a 14-day cadence.
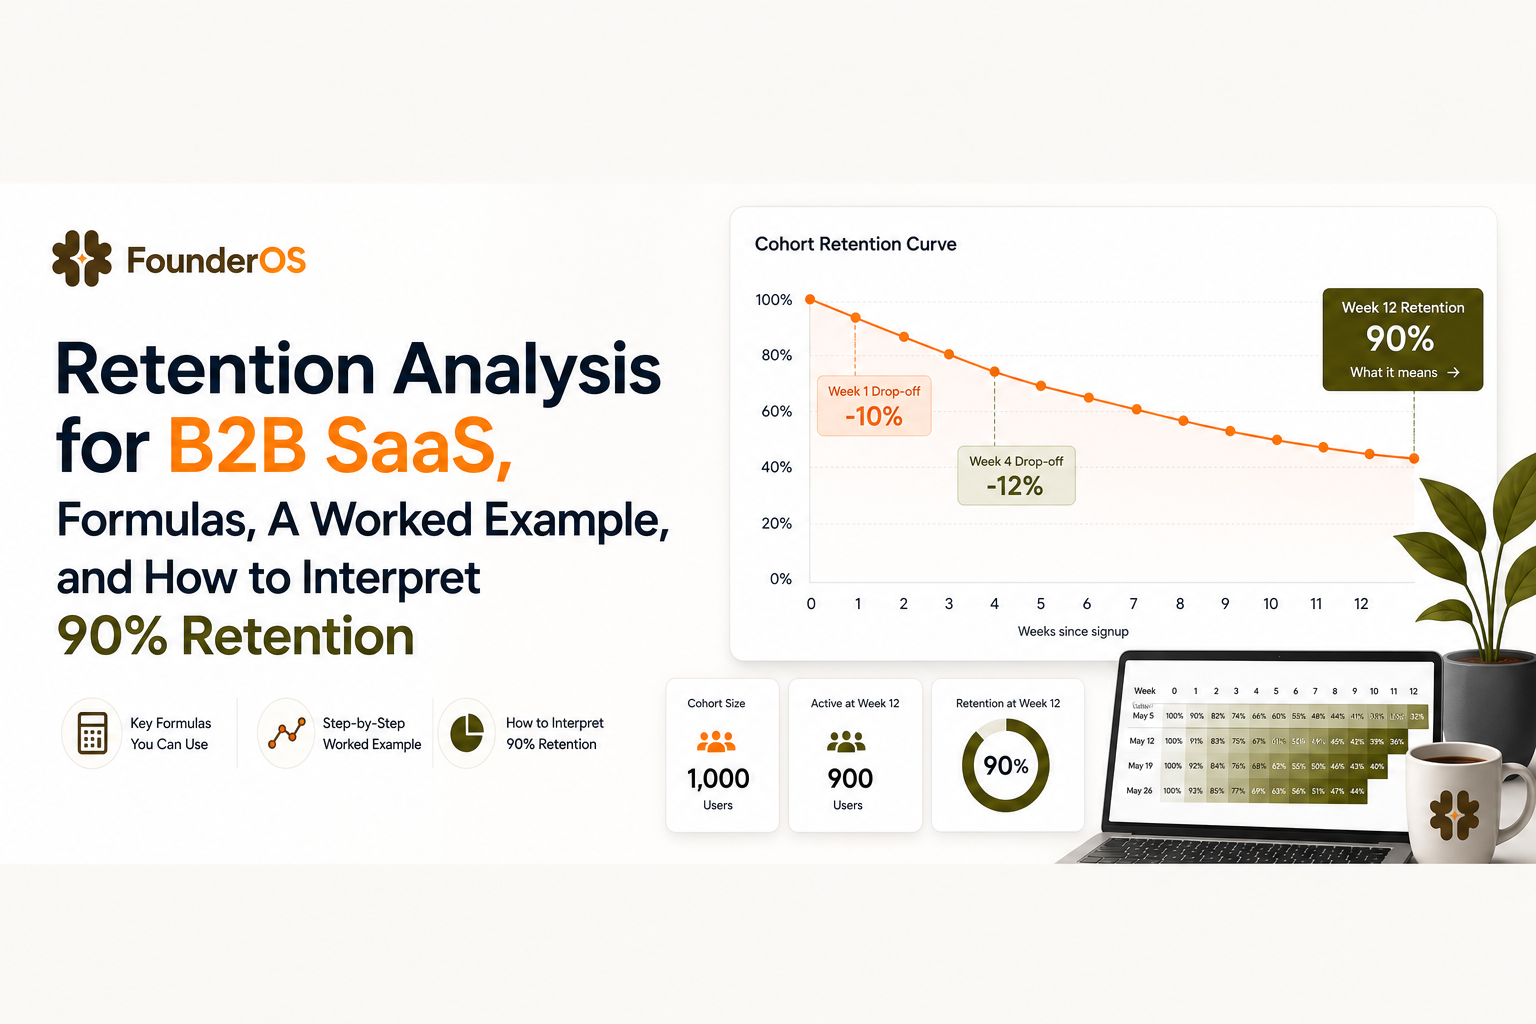
Retention analysis, defined by decisions not definitions
Retention analysis is only useful when it is tied to a specific decision, such as “which onboarding step to change,” “which segment needs intervention,” or “whether expansion is offsetting churn.” Product retention measures whether users repeat valuable actions; subscription and revenue retention measure whether customers and recurring revenue remain over time. Together, they show whether acquisition is producing lasting value: low retention reduces LTV, and growth becomes unsustainable when CAC exceeds LTV. Like a leaky bucket, a SaaS product can keep adding signups while losing users before they become recurring customers. In practice, teams get stuck because they mix three adjacent concepts and then argue about a number that cannot answer their question.
Retention vs churn vs engagement, and what each can decide
- Retention answers: “Of a starting set, how many are still active or still paying after time T?” Decisions: prioritize onboarding fixes, lifecycle interventions, packaging changes.
- Churn answers: “How many left during time T?” Decisions: churn-reason program, cancellation flow, save offers, CS playbooks.
- Engagement answers: “How deeply are retained users using the product?” Decisions: feature adoption bets, activation definition, roadmap sequencing. (Engagement is often measured via user engagement metrics.)
The decision-first checklist we use before calculating anything
Before we compute a single percentage, we write down five fields so retention analysis stays decision-grade instead of dashboard-grade:
- Unit: logo (accounts), user, or revenue.
- Event definition: what counts as “active” (for product retention) or “retained” (for subscription retention).
- Time window: day 1, week 4, month 3, trailing 30 days, etc.
- Cohort rule: signup month, first key action week, first payment month, etc.
- Exclusions: internal users, spam signups, paused accounts, free trials that never intended to convert.
Two common failure modes that create fake “improvements”
- Changing the denominator mid-stream: counting only “activated” users in one report and all signups in another makes the curve look better without any product change.
- Mixing product activity with payment status: an account can be paying but inactive (or active but unpaid). Decide which outcome you are optimizing before you label it retention.
The retention analysis formula library, logo vs revenue vs cohort
Retention analysis becomes unambiguous when every formula names its numerator, denominator, and time boundary. The library below covers the three definitions that most B2B SaaS teams need, plus when each one is the right tool.
1) Logo retention (customer retention)
Use logo retention when the decision is about customer count, such as forecasting support load, CS staffing, or whether churn is concentrated in a segment.
- Gross logo retention (GLR) over period T:
GLR = (Customers_start − Customers_churned) / Customers_start - Logo churn over period T:
Churn = Customers_churned / Customers_start
Numeric example: Start month with 200 customers, 12 cancel. GLR = (200 − 12)/200 = 94% monthly gross logo retention.
2) Revenue retention (GRR and NRR)
Use revenue retention when the decision is about dollars, such as whether expansion offsets churn, whether pricing changes are working, or whether retention is improving in higher tiers.
- Gross revenue retention (GRR) over period T (no expansion credit):
GRR = (MRR_start − Churned_MRR − Contraction_MRR) / MRR_start - Net revenue retention (NRR) over period T (includes expansion):
NRR = (MRR_start − Churned_MRR − Contraction_MRR + Expansion_MRR) / MRR_start
Numeric example: Start with $100k MRR. Lose $6k to churn, $4k to downgrades, gain $12k expansion. GRR = (100 − 6 − 4)/100 = 90%. NRR = (100 − 6 − 4 + 12)/100 = 102%.
3) Cohort retention (product retention)
Use cohort retention when the decision is about product behavior over time, such as “what do week-1 retained users do differently?” and “which onboarding step correlates with week-4 retention?” If you want the deeper math and chart patterns, see cohort retention curve.
- Classic cohort retention at time t:
Retention(t) = Active_users_from_cohort_at_time_t / Users_in_cohort_at_time_0 - Account-level cohort retention (for B2B):
Retention(t) = Active_accounts_from_cohort_at_time_t / Accounts_in_cohort_at_time_0
Define “active” with an event rule, not a login. Example: Active = completed at least 1 “core value” event in the last 7 days.
When-to-use table (so you pick the right formula fast)
| Metric | Best for | What it misses | Common pitfall |
|---|---|---|---|
| Logo retention (GLR) | Customer count stability, churn concentration | Expansion, seat growth, usage depth | Counting “paused” or non-paying accounts as retained |
| GRR | How much revenue you keep from the base | Upside from expansion | Including new sales in the numerator |
| NRR | Whether expansion offsets churn | Product adoption drivers by cohort | Celebrating high NRR while activation is weak |
| Cohort retention | Onboarding and product changes, habit formation | Billing outcomes unless you join to revenue | Using “any event” as active and inflating retention |
A complete retention analysis example, from raw events to cohort insights
Retention analysis can be computed from an event table plus a user table, as long as you define cohort membership and “active” precisely. The worked example below mirrors what most B2B SaaS teams need: a weekly product-retention cohort with an account-weighted view for revenue sensitivity.
Step 1: Start with a minimal dataset you can actually trust
You need two tables (CSV, warehouse, or exports from event analytics):
- users: user_id, account_id, signup_ts, plan, seat_count (optional), source (optional)
- events: event_ts, user_id, account_id, event_name
Activation event rule (example): “core_value” happens when a user completes ReportCreated OR IntegrationConnected. Active in week W means at least 1 core_value event in that week.
Step 2: Assign cohorts by first core value, not by signup
Cohorting by signup is fine for acquisition questions, but for product retention we usually cohort by first core value because it aligns users by “time since value.” We initially assumed signup cohorts were enough, but the moment we re-cohorted by first value, the week-1 curve separated cleanly between users who reached value in day 0-1 and users who took a week.
- first_value_week(user) = week_of(min(event_ts) where event_name in core_value)
- cohort_week = first_value_week
Step 3: Build the cohort table (counts by week offset)
For each cohort_week, compute active users at week offsets 0,1,2,3... where offset 0 is the cohort week.
- cohort_size = distinct users with cohort_week
- active_users(offset k) = distinct users in cohort with any core_value event in week(cohort_week + k)
- retention(k) = active_users(k) / cohort_size
Step 4: Add an account-weighted retention (optional, but very useful in B2B)
User-level retention can hide the fact that one large account retained and ten tiny accounts churned. A lightweight fix is to weight each account by a stable proxy such as seat_count or starting MRR if you have it.
- account_weight = seat_count (or starting MRR)
- weighted_active(k) = sum(account_weight) for accounts with at least one active user in week offset k
- weighted_retention(k) = weighted_active(k) / sum(account_weight) in cohort
Mini numeric example: Cohort has 3 accounts: A (10 seats), B (3 seats), C (1 seat). At week 4, A and C are active. User retention might be 2/3 = 67% accounts retained. Weighted retention = (10 + 1)/(10 + 3 + 1) = 11/14 = 79%.
Step 5: Interpret the curve with three diagnostic reads
- Level: week-4 retention of 25% vs 40% changes how aggressive onboarding needs to be.
- Slope: steep week-0 to week-1 drop often means activation is too broad or onboarding is leaky.
- Shape: a “cliff then flat” curve suggests a single early moment that determines long-term retention.
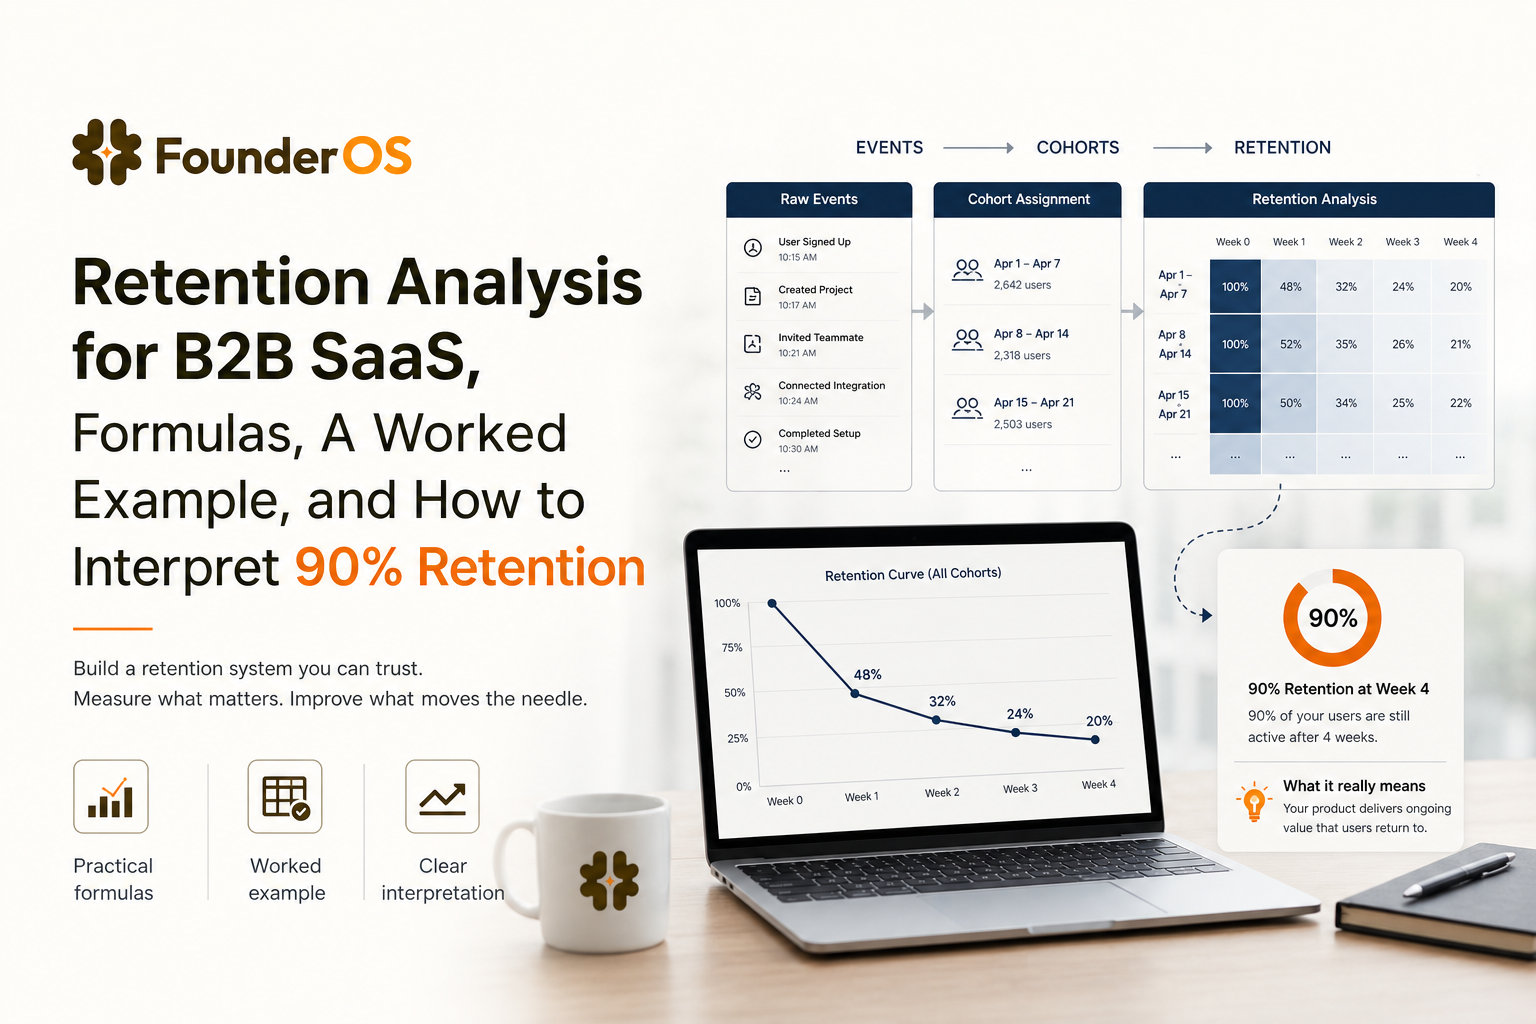
What does 90% retention mean, three scenarios most teams confuse
“90% retention” is only interpretable when you know the unit, the time window, and whether expansion is included. To decide whether it is good, compare the same definition across equivalent windows, product type, contract length, and prior cohorts rather than applying one universal benchmark. For example, 90% monthly logo retention means 10% monthly churn, while 90% day-1 product retention describes a different behavior entirely. Report the current cohort beside the previous cohort and a three-cohort average; annotate releases and seasonality, and do not annualize blindly when cohorts are immature.
Scenario A: 90% weekly cohort retention (product activity)
Meaning: In a given cohort, 90% of users who were active in week 0 were also active in week 1 (or 90% of the cohort is active at week 1, depending on your definition).
- Typical use: onboarding and habit formation.
- Interpretation trap: 90% week-1 can still lead to poor month-2 retention if the curve decays later.
Scenario B: 90% monthly gross logo retention (customer count)
Meaning: You lost 10% of customers in the month. If that rate persisted, annualized churn would be severe, but you should not annualize without checking seasonality and cohort maturity.
- Typical use: CS capacity and churn-risk segmentation.
- Interpretation trap: A small base with a few churned logos can swing the percentage wildly.
Scenario C: 90% gross revenue retention (dollars kept)
Meaning: You kept 90% of starting MRR after churn and downgrades, before counting expansion. This is often the cleanest “how leaky is the bucket” read for revenue teams.
- Typical use: pricing, packaging, and save motions.
- Interpretation trap: GRR of 90% can coexist with NRR above 100% if expansion is strong, but that does not guarantee broad product retention.
A quick “90%” decoding template you can paste into reports
- Unit: users | accounts | MRR
- Window: weekly | monthly | quarterly
- Definition: active event rule or billing status
- Cohort: signup | first value | first payment
- Formula: GLR | GRR | NRR | cohort retention at week k
How to find the why behind the curve, segments, triggers, and feedback loops
Retention analysis turns into retention improvement only when you can explain which behaviors predict retention and which moments trigger drop-off. The most reliable workflow is to combine segmentation, event sequences, and qualitative churn reasons into a single loop.
1) Segment by behavior first, then add traits
Start with behavioral segments because they point to product levers. Then layer firmographics (industry, plan) to see where the lever is strongest. Also compare retention by acquisition source—paid search, content, and referrals—to identify channels that produce durable customers, shift budget, refine targeting, or personalize onboarding. Segment by persona or job-to-be-done as well, then compare cohort retention with LTV and expansion potential so high-value segments receive priority. For every segment, report cohort retention plus GRR/NRR where applicable; otherwise product activity and revenue outcomes can diverge unnoticed. A practical guide is user segmentation.
- At-risk segment: users who activated but have 0 core_value events in the last 7 days.
- Stalled onboarding segment: users who completed Step A but not Step B within 24 hours.
- Power-user segment: users who hit core_value 3+ times per week for 2 consecutive weeks.
2) Map retention to a small set of “retention drivers” events
Pick 3 to 5 events that represent repeated value, not setup. In our experience working with B2B SaaS products, the events that correlate with week-4 retention are usually “repeatable outcomes” (exported report, shared dashboard, invited teammate), not “configuration completed.”
- List candidate events used by retained users in weeks 1 to 4.
- Compute retention(k) for users who performed each event in week 0.
- Keep events that show a consistent lift across cohorts, not a single lucky week.
3) Use trigger analysis to locate the first break in momentum
Trigger analysis asks: “What is the first missing step that predicts churn?” A simple method:
- Define the expected onboarding sequence: Signup → Create first object → Configure → Invite teammate → First recurring use.
- For churned users, compute the last completed step and the time-to-step.
- Prioritize the step with the highest volume of drop-offs and shortest time-to-drop.
4) Close the loop with churn reasons and 5-user interviews
Quant tells you where; qual tells you why. Keep it lightweight: tag cancellation reasons into 5 to 8 buckets and interview 5 churned accounts per month. The goal is not a perfect taxonomy, it is to confirm whether the event-based hypothesis matches reality.
Operationalizing retention analysis, Excel setup vs product analytics tools
Retention analysis can be operationalized in Excel for a first pass, but teams usually switch to product analytics tools when they need trustworthy event definitions, fast segmentation, and drill-down to individual sessions. The choice is less about charting and more about whether you can keep the measurement stable while shipping changes.
Option A: Excel or Google Sheets setup (good for the first iteration)
- Export events with columns: user_id, account_id, event_ts, event_name.
- Create a week bucket: WEEKNUM(event_ts) or a date-trunc to week start.
- Compute cohort_week per user: MIN(week_bucket) where event_name in core_value.
- Pivot table: rows = cohort_week, columns = week_offset, values = distinct count of user_id with core_value.
- Retention formula: divide each column by cohort_size (week_offset 0).
Excel template output: use cohort_date or cohort_week as rows, day/week offsets as columns, and retention% as the values. For example, each row can show a signup cohort with D0, D1, D7, D30 or W0, W1, W2, W4 retention. This is retrospective retention: the percentage of a starting cohort retained after X days, weeks, or months. Rolling retention answers a different question, such as whether a user was active at least once in the trailing 7 or 30 days, and is useful for ongoing lifecycle monitoring.
Limits: distinct counts get messy, event definitions drift, and it is hard to drill into “who dropped” without manual filters.
Option B: Buyer checklist for product analytics tools (what matters for retention work)
- Event capture reliability: can you track clicks, page views, and key custom events without long engineering cycles?
- User and account identity: can events be tied to a person and rolled up to an account cleanly?
- Cohorts and comparisons: can you compare cohorts side by side and filter by segment without SQL?
- Drill-down: can you click from a drop-off bar into the exact users and sessions that dropped?
- Operational hooks: can segments feed onboarding or alerts so retention findings become actions?
A lightweight way to operationalize this in Founder OS
Founder OS can mirror the workflow above by tracking product events, tying them to user profiles, building behavioral segments, and then using onboarding flows to address the exact step where users stall. What surprised our team was how much faster retention analysis cycles became once we could drill from a cohort drop-off into individual sessions and then ship an onboarding change the same week.
Retention analysis action plan for the next 14 days
Retention analysis improves outcomes when it runs on a short, repeatable cadence with one owner and a clear experiment queue. The plan below is designed to produce a usable cohort curve, one prioritized hypothesis, and one shipped change within two weeks.
Days 1 to 3: Lock definitions and build the first cohort table
- Write your active rule as an event expression (3 to 5 events max).
- Pick cohort rule: signup vs first core value (default to first core value for product retention).
- Build week-0 to week-6 cohort retention and sanity-check for data issues (internal users, duplicates).
Days 4 to 7: Find the biggest drop and generate 3 hypotheses
- Identify the steepest drop (often week 0 to week 1, or week 1 to week 2).
- Segment retained vs churned and compare event frequency for 5 candidate “driver” events.
- Write 3 hypotheses in the format: “If we reduce friction at Step X, week-k retention will increase because Y.”
Days 8 to 11: Ship one targeted change and instrument it
- Choose the smallest change that affects the highest-volume drop-off step (copy, UI, checklist, template, empty state).
- Instrument one success event for the change and one guardrail metric (support tickets, time-to-value).
- Tag users exposed to the change so you can compare cohorts fairly.
Days 12 to 14: Report results in a stakeholder-ready format
- Show the cohort curve before vs after (or exposed vs not exposed).
- Report one leading indicator (activation rate, time-to-first value) and one retention read (week-2 or week-4).
- Decide: roll out, iterate, or kill. Then queue the next experiment.
| Retention artifact | Owner | Cadence | Decision it supports |
|---|---|---|---|
| Weekly cohort retention curve (week 0 to 6) | Product | Weekly | Which onboarding step to fix next |
| At-risk segment size (no core value in 7 days) | Lifecycle / CS | Daily | Who needs intervention now |
| GRR and NRR | RevOps / Finance | Monthly | Is expansion offsetting churn |
FAQ about retention analysis
If you want to replicate the worked retention analysis inside a single platform, Founder OS can help you track the key events, build cohorts and behavioral segments, and then ship onboarding fixes tied to the exact drop-off point. Start free or book a demo with your retention question, and bring one cohort you want to improve so you can leave with a concrete experiment plan.

Product Tours Explained for SaaS Teams That Want Better User Activation
Learn what product tours are, why SaaS walkthroughs fail, and how to design lightweight onboarding that improves activation and feature adoption.

Mobile App Onboarding Explained, A Simple First-Run Framework for SaaS Teams
Learn mobile app onboarding basics, build a first-run flow, reduce friction, and help SaaS users reach value faster.

User Onboarding Flow For SaaS Teams, A Practical Activation Framework
Build a user onboarding flow around activation: map intent, choose the right in-app steps, measure time-to-value, and iterate by segment.