
User Engagement Metrics for B2B SaaS You Can Implement This Week
If your dashboards are full but your product decisions still feel like guesswork, the issue is usually not data volume, it is choosing the wrong user engagement metrics and not tying them to actions.
- Pick 1 North Star engagement outcome and 3 to 5 supporting KPIs using a simple 3-layer framework, not a long vanity list.
- Use a small set of predictive user engagement metrics (activation, retention, stickiness, feature adoption, funnels) with clear formulas and definitions.
- Instrument events once, then turn engagement signals into segments, scoring, and experiments you can run every week.
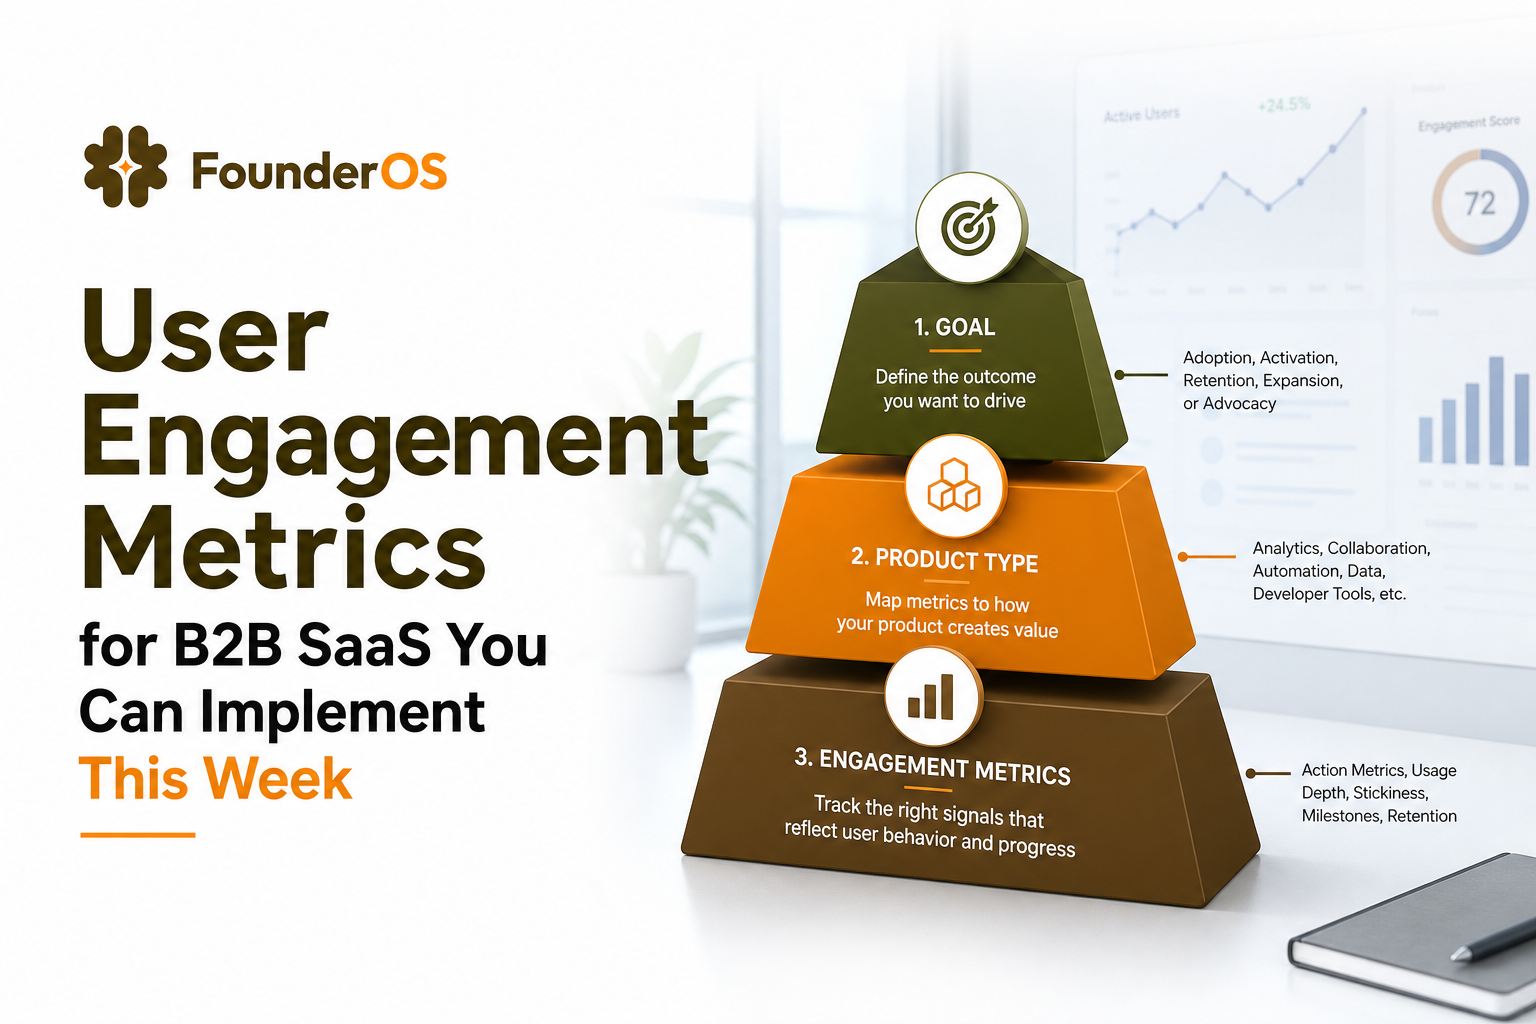
Choose the right user engagement metrics with a 3-layer KPI framework
The most common failure mode I see in B2B SaaS analytics is measuring “activity” instead of “progress.” A login, a page view, or time-on-app can be noise unless it reliably predicts retention, expansion, or successful task completion. The fix is to define engagement as a business outcome first, then select a minimal set of metrics that explain movement toward that outcome.
Layer 1: Define engagement by goal and product type
Start by choosing the engagement goal that matters for the next 30 to 60 days. Then adjust for your product type so you do not reward the wrong behavior.
- Activation-focused (new accounts): engagement means reaching first value fast.
- Adoption-focused (existing accounts): engagement means repeated use of the core workflow and key features.
- Retention-focused (churn risk): engagement means consistent return behavior and breadth of usage.
- Expansion-focused (upsell): engagement means multi-seat usage, advanced feature adoption, and higher frequency from the right roles.
Product type matters because “more time” can be good or bad:
- Workflow tools (CRM, ticketing): more time can indicate friction. Favor task completion and repeat usage.
- Collaboration tools (docs, chat): time and sessions can be meaningful, but only if tied to team adoption.
- Insights tools (analytics): fewer sessions might be fine if users get answers quickly. Favor query success and return rate.
Layer 2: Pick 1 North Star and define it precisely
Your North Star should be a single weekly metric that represents “customers got value.” It must be measurable from events and stable enough to trend. Use this checklist:
- Value-based: reflects a meaningful outcome (not just opening the app).
- Repeatable: can happen multiple times per account or user.
- Leading indicator: correlates with retention or expansion within 1 to 4 weeks.
- Controllable: can be moved via onboarding, UX, pricing, or lifecycle messaging.
Examples of North Stars by motion:
- PLG self-serve: “Weekly Activated Users” (users who complete the activation event at least once that week).
- Sales-led: “Weekly Active Accounts” (accounts with at least N key actions by target roles).
- Usage-based pricing: “Weekly Units of Value” (reports generated, API calls, automations run).
Layer 3: Add 3 to 5 supporting KPIs that explain movement
Supporting KPIs should answer “why did the North Star change?” A practical set that works for most B2B SaaS:
- Activation rate (new users reaching first value)
- Stickiness (DAU/WAU or WAU/MAU depending on cadence)
- Feature adoption (core feature usage by cohort)
- Funnel conversion (drop-off at critical steps)
- Retention (logo or user retention, plus cohort retention curve)
After running 20+ metric audits, the pattern was clear: teams move faster when they can name the North Star, the activation event, and the top drop-off step without opening a dashboard.
The core user engagement metrics that actually predict retention and expansion
Below are the user engagement metrics that tend to be predictive when defined from product events, not from page views alone. The key is consistency: one definition, one owner, and one place to review weekly.
1) DAU, WAU, MAU and stickiness
- DAU/WAU/MAU: count of distinct active users in a day/week/month.
- Stickiness (daily cadence): DAU / MAU.
- Stickiness (weekly cadence): WAU / MAU.
Definition tip: “Active” should mean “performed a key action,” not “opened the app.” For example, in a project tool, “created or completed a task” is often more meaningful than “visited dashboard.”
2) Activation rate (and time to activate)
- Activation rate: Activated users / New users.
- Time to activate: median time from signup to activation event.
Activation is one of the most actionable user engagement metrics because it maps to onboarding. We initially assumed “first login” was enough, but cohort analysis showed retention only improved when users completed the first end-to-end workflow (for example, “invite teammate” + “create first project” + “complete first task”).
3) Feature adoption (breadth and depth)
Track adoption for 1 to 3 “core” features and 1 to 2 “expansion” features.
- Breadth: % of active accounts using Feature X in the last 7/30 days.
- Depth: median count of Feature X actions per active account in the last 7/30 days.
Feature adoption becomes a retention lever when you compare cohorts: retained vs churned, paid vs trial, ICP vs non-ICP. This is where user segmentation turns metrics into a roadmap.
4) Funnel conversion and drop-off diagnostics
Funnels are the fastest way to find “where momentum breaks.” Define 1 activation funnel and 1 expansion funnel.
- Funnel conversion rate: users who complete step N / users who started step 1.
- Step drop-off: 1 minus (users who reach step i+1 / users who reach step i).
Use funnel analysis to pinpoint the exact step to fix, then watch the supporting KPI move (time to activate, step conversion, or adoption rate).
5) Retention and return behavior
- Logo retention: % of accounts still active or paying after N days.
- User retention: % of users returning to do a key action after N days.
- Cohort retention curve: retention by signup week/month over time.
If you only track DAU/MAU, you miss whether the same users are returning. Retention cohorts are the “truth serum” for user engagement metrics because they reveal whether engagement is durable or just a launch spike.
What good looks like, practical targets and when benchmarks mislead
Benchmarks can help you sanity check, but they can also push you toward the wrong optimization. The safest approach is to set directional targets based on your usage cadence, then validate against your own retention curve.
Directional targets by SaaS motion (use as starting points)
- Daily-use products: DAU/MAU stickiness often lands in the 0.2 to 0.6 range, depending on role coverage and team rollout.
- Weekly-use products: WAU/MAU is usually more meaningful than DAU/MAU; look for steady week-over-week return among your best-fit accounts.
- Monthly or quarterly-use products: focus on “successful session” rate and retention at the right interval, not daily activity.
Important caveat: for task tools, “average session duration” going up can mean users are stuck. For insights tools, fewer sessions with high success can be a win. This is why your North Star should be outcome-based, and why you should treat time-based user engagement metrics as secondary.
A simple way to set targets without external benchmarks
- Pick a “healthy cohort” (for example, accounts that retained 60+ days or expanded).
- Measure their median engagement in week 1 and week 4 (activation time, key actions, adoption breadth).
- Set your target as “move the median new cohort toward the healthy cohort’s week 1 profile.”
What surprised our team was how often the best predictor was not “more actions,” but “the right sequence of actions” in the first 10 minutes. Sequence-based targets are usually more actionable than raw counts.
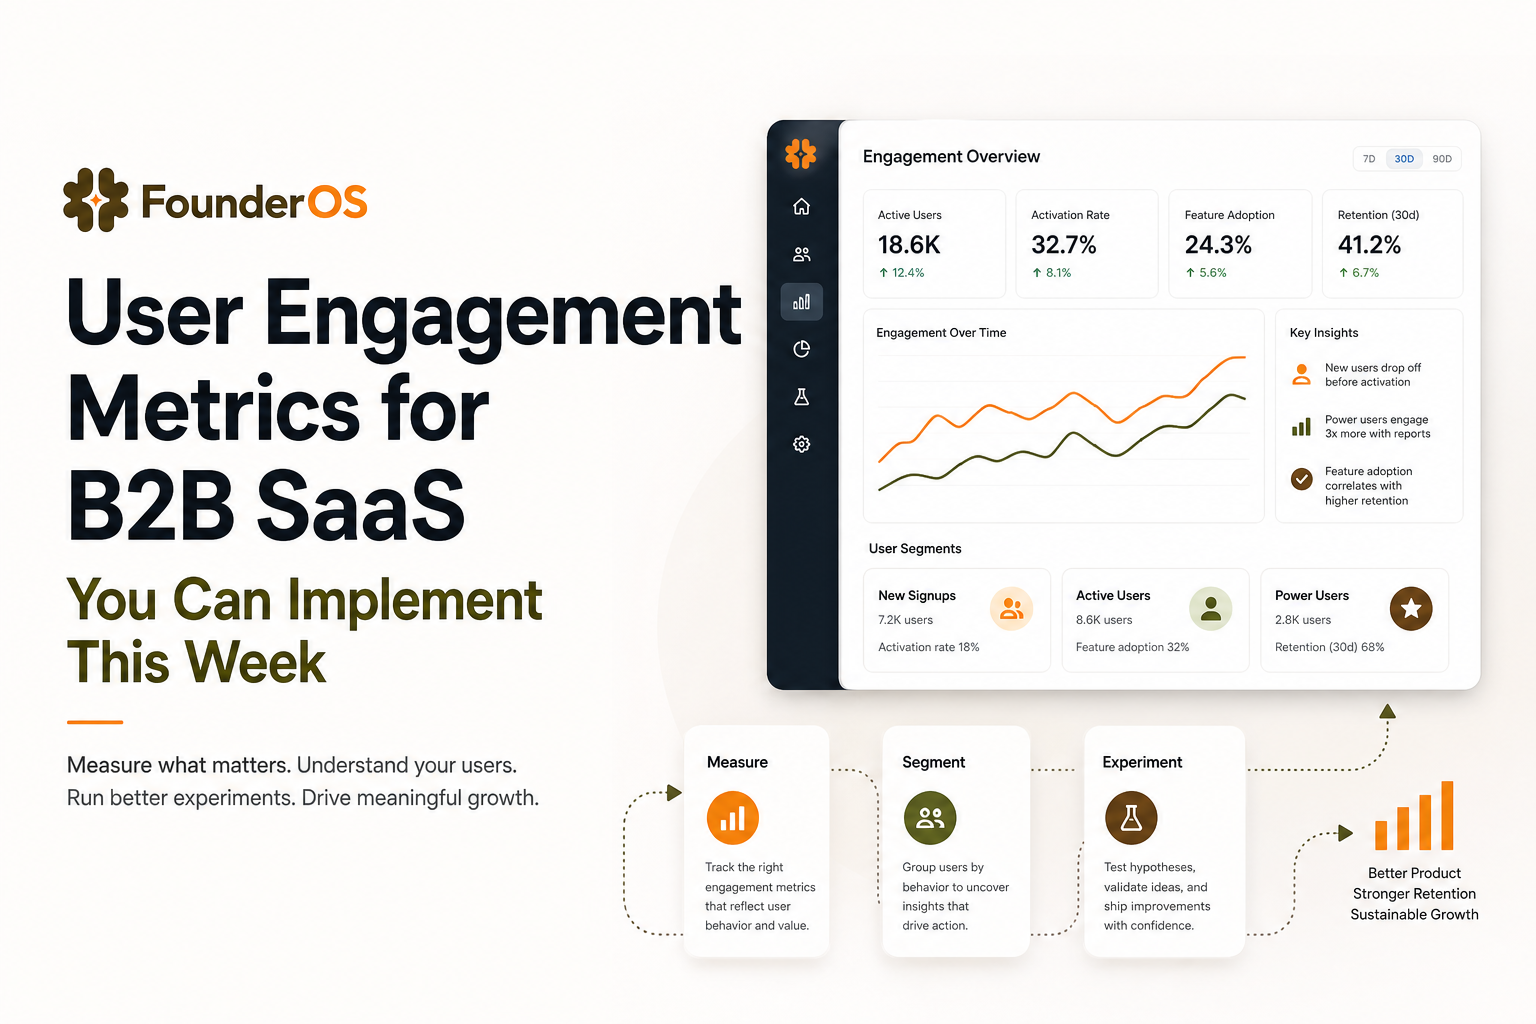
GA4 user engagement metrics, where to find them and what events power them
GA4 is useful for acquisition and web-to-product journeys, but you need to understand what its engagement numbers actually mean. The goal is to connect GA4 engagement to product events, then reconcile the story across tools.
Where to find GA4 engagement metrics
- Engagement overview: engagement rate, average engagement time, engaged sessions per user.
- Pages and screens: views, users, average engagement time per page/screen.
- Events: event count, users, conversions (if marked).
What GA4 engagement rate actually measures
In GA4, an “engaged session” is a session that lasts 10+ seconds, has 2+ page/screen views, or has at least one conversion event. So GA4 engagement rate is:
- Engagement rate: engaged sessions / total sessions.
This is a web engagement proxy, not a product value proxy. Treat it as a top-of-funnel quality signal, then use product events to define true activation and retention.
Events that power GA4 engagement reporting
- user_engagement: automatically collected in many implementations to track engaged time.
- scroll: fires at 90% scroll depth by default for web.
- click, page_view: used for basic interaction and session depth.
- Conversions: any event you mark as a conversion (for example, sign_up, generate_lead).
If you want GA4 to contribute to your user engagement metrics framework, define 2 to 3 conversion events that represent meaningful progress (signup, request demo, completed onboarding step), and keep the rest as diagnostic signals.
For deeper product usage, pair GA4 with event analytics in a product-focused tool, where you can tie every event to a user profile and run behavioral cohorts.
From measurement to action, segment, score engagement, then run experiments
Collecting user engagement metrics is only useful if it changes weekly decisions. A lightweight workflow that works for small teams is: instrument, diagnose, segment, experiment, then review cohorts.
Step 1: Instrument a minimal event schema
Keep it small. You need:
- Identity: user_id, account_id, role (if available).
- Core events: activation event, key workflow events, expansion events.
- Properties: plan, source, device, and the object being acted on (project_id, report_type).
If you are choosing between product analytics tools, prioritize the ability to build funnels and cohorts directly from events without weeks of tagging work.
Step 2: Build 3 segments that drive decisions
Start with segments that map to actions you can take this week:
- New but not activated: signed up, did not hit activation event within 24 to 72 hours.
- Activated but shallow: activated, but has not adopted Feature X within 7 days.
- At-risk: previously active, now no key actions in the last 7 to 14 days.
When we tested a “new but not activated” segment with a short in-app checklist and one contextual tooltip, activation rate improved by 8 to 12% in the following cohort, and time to activate dropped by about a day.
Step 3: Create a simple engagement score (do not overfit)
An engagement score is helpful when it is transparent. Use 3 to 5 weighted signals tied to your North Star:
- +3 points: completed activation event
- +2 points: used core feature in last 7 days
- +1 point: invited teammate or added integration
- -2 points: no key actions in last 10 days
Then map score bands to playbooks: score 0 to 2 gets onboarding help, 3 to 5 gets adoption nudges, 6+ gets expansion prompts. This is where user engagement metrics become operational, not just reporting.
Step 4: Run weekly experiments tied to one metric
Use a tight loop:
- Hypothesis: “If we reduce friction at step 2, activation rate increases.”
- Change: simplify form, prefill data, add an example, or reorder steps.
- Primary metric: activation rate or step conversion.
- Guardrails: error rate, support tickets, or time-to-complete.
Review results by cohort, not just overall averages. If the lift only appears in one acquisition channel or one role, that is still a win, it tells you where to focus.
| Goal | North Star example | Supporting KPIs (3 to 5) | Weekly actions |
|---|---|---|---|
| Improve activation | % users who reach activation in 72 hours | Time to activate, step 1-3 funnel conversion, onboarding completion, core feature first-use rate | Fix top drop-off step, update onboarding, add contextual guidance |
| Drive adoption | % active accounts using core feature weekly | Breadth, depth, repeat usage, stickiness (WAU/MAU), adoption by role | Target segments with nudges, improve discoverability, iterate empty states |
| Reduce churn risk | 7-day return rate for active users | At-risk segment size, retention cohorts, frequency of key actions, support ticket rate | Re-engagement flows, in-app reminders, remove friction in core workflow |
FAQ
If you want to implement this framework quickly, Founder OS can help you capture product events, build funnels and segments, and turn user engagement metrics into onboarding and activation improvements without weeks of instrumentation work.
Written by Ivy Tran
Founder of FounderOS, sharing practical insights on SaaS growth, product analytics, and user activation.
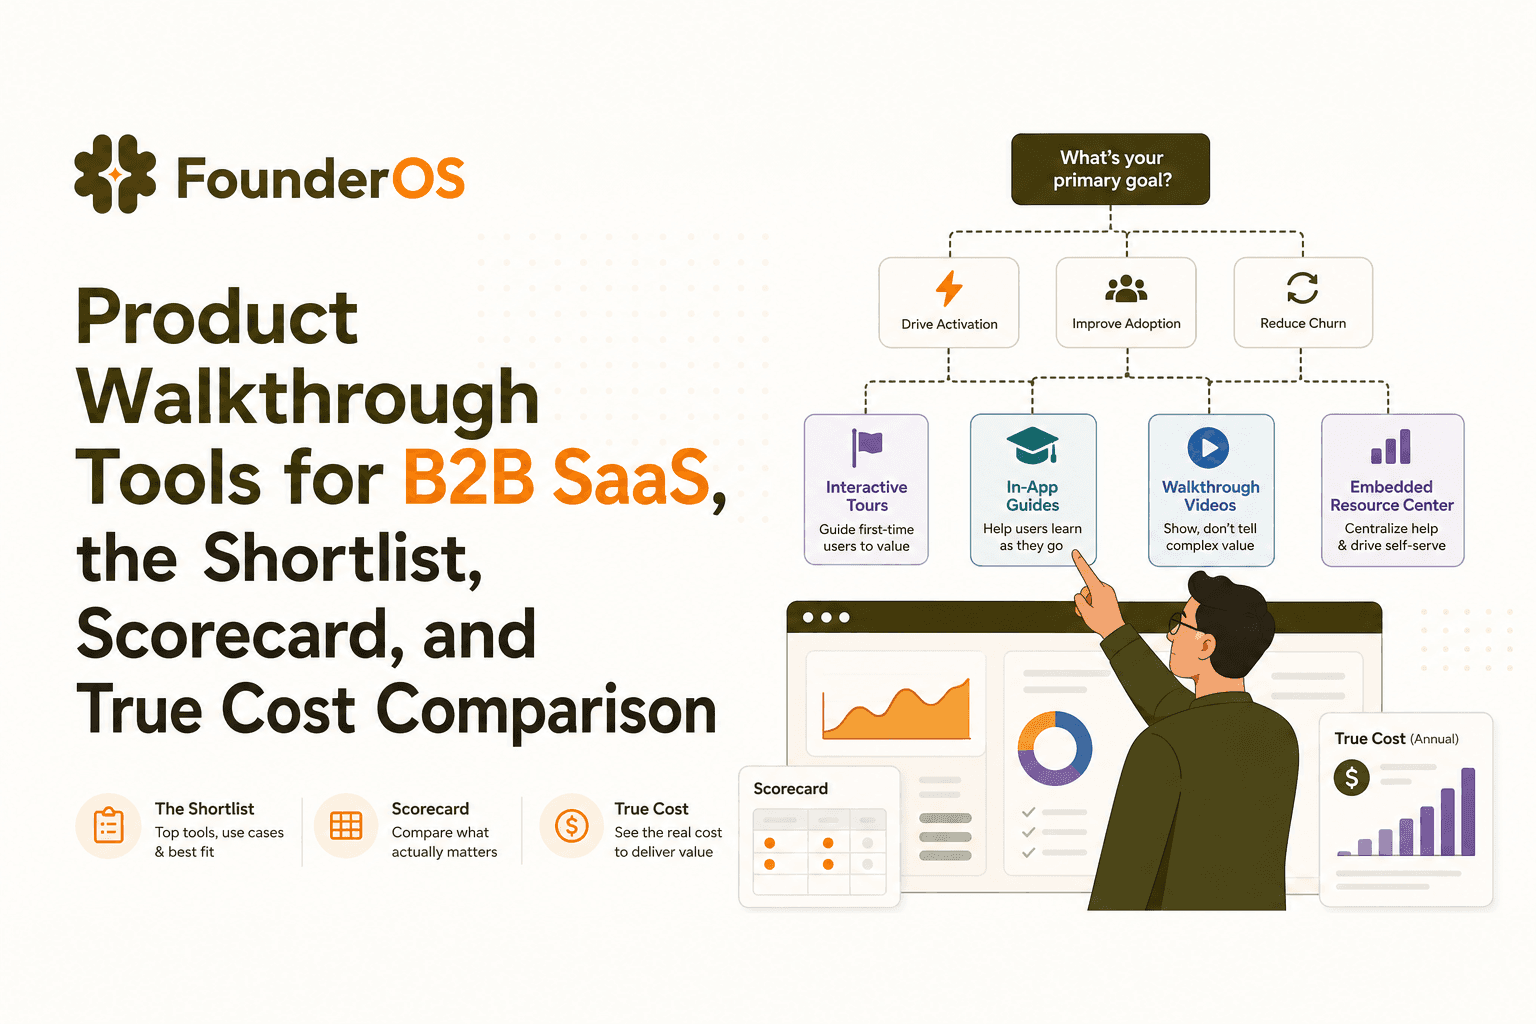
Product Walkthrough Tools for B2B SaaS, the Shortlist, Scorecard, and True Cost Comparison
Compare product walkthrough tools for B2B SaaS with a shortlist, success scorecard, and true cost scenarios for 2k, 10k, and 50k users.

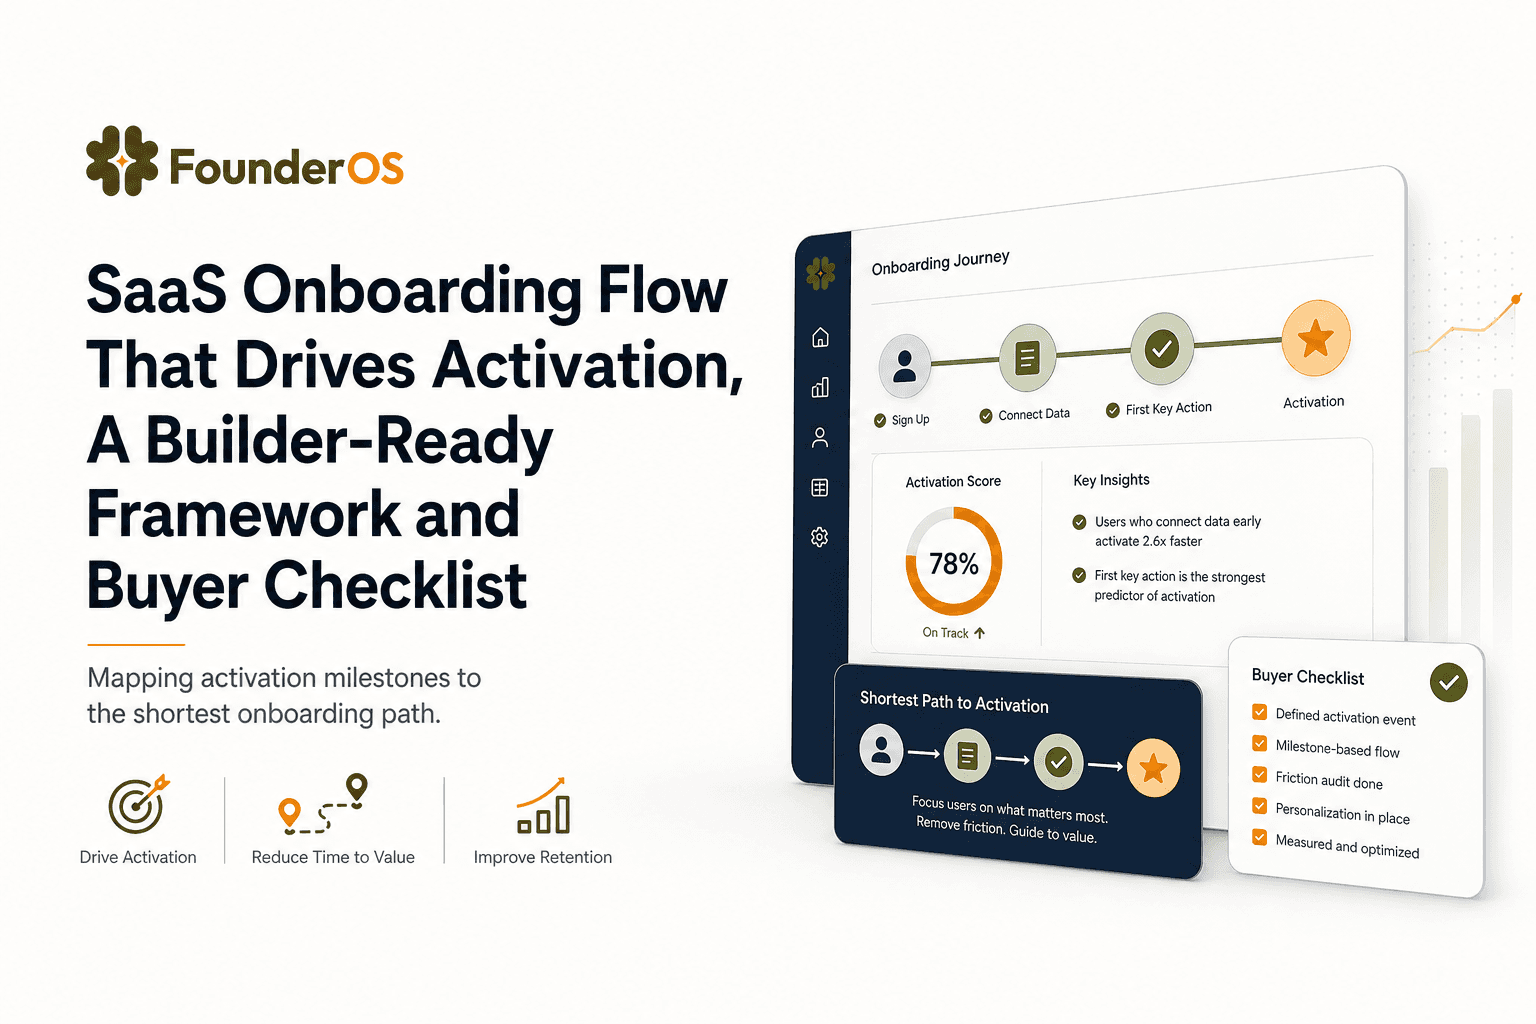
SaaS Onboarding Flow That Drives Activation, A Builder-Ready Framework and Buyer Checklist
Build a saas onboarding flow that drives activation with segments, triggers, tracking, and a buyer checklist for no-code flow builders.

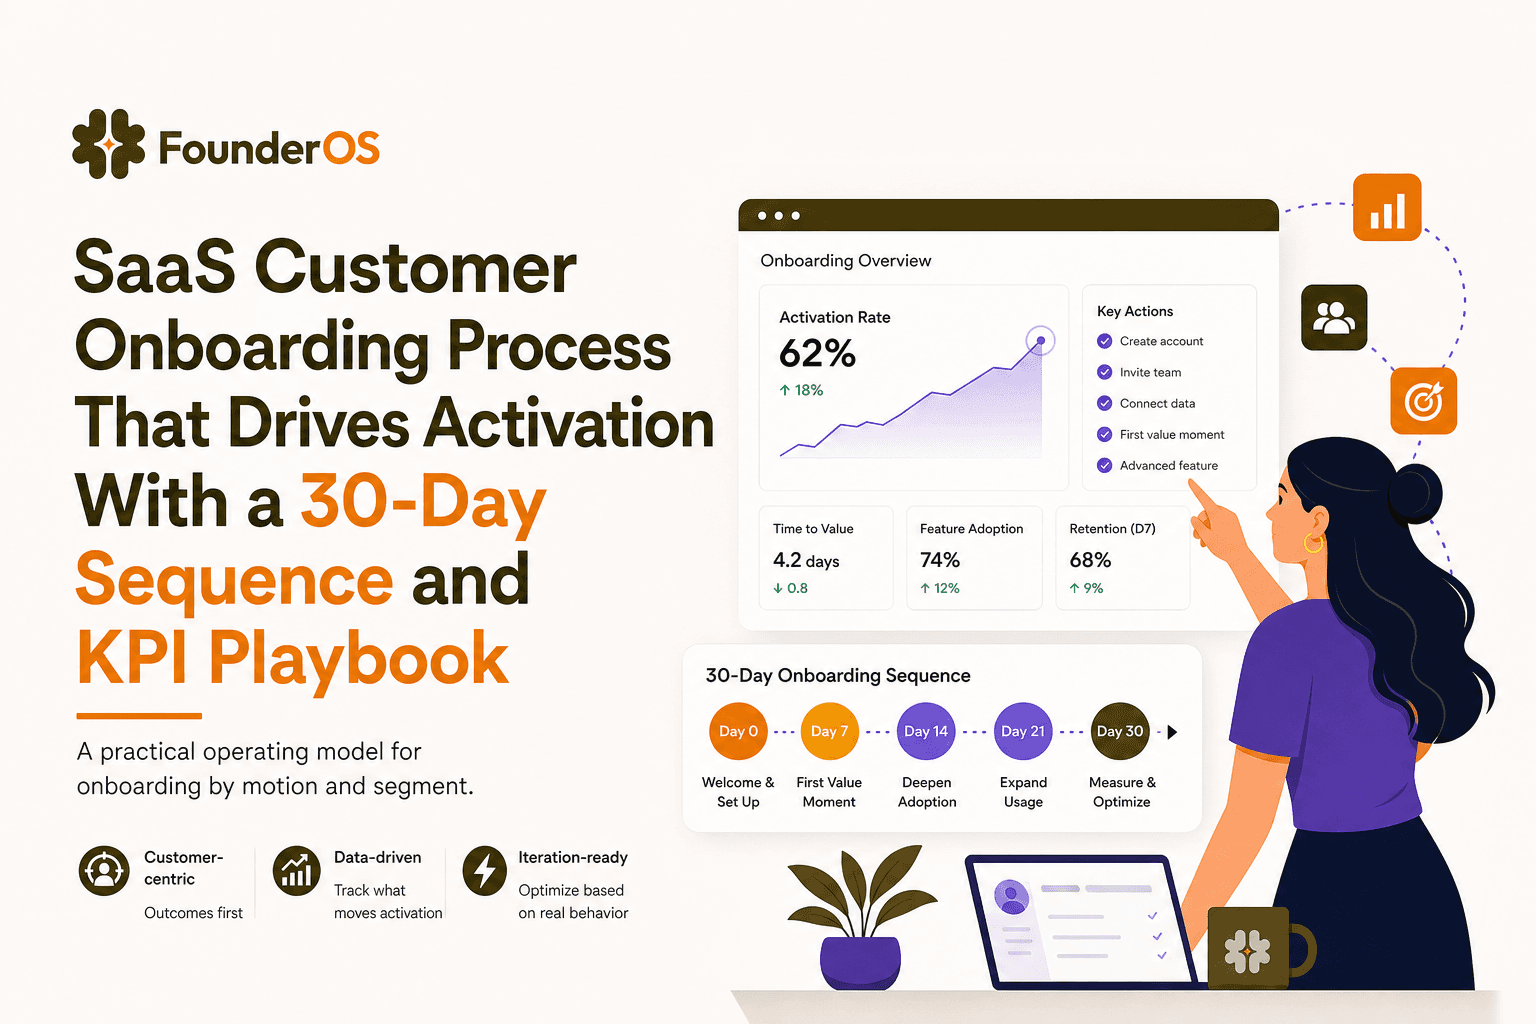
SaaS Customer Onboarding Process That Drives Activation With a 30-Day Sequence and KPI Playbook
Build a saas customer onboarding process with a 30-day sequence, triggers, RACI ownership, and KPI formulas to reach activation faster.
