
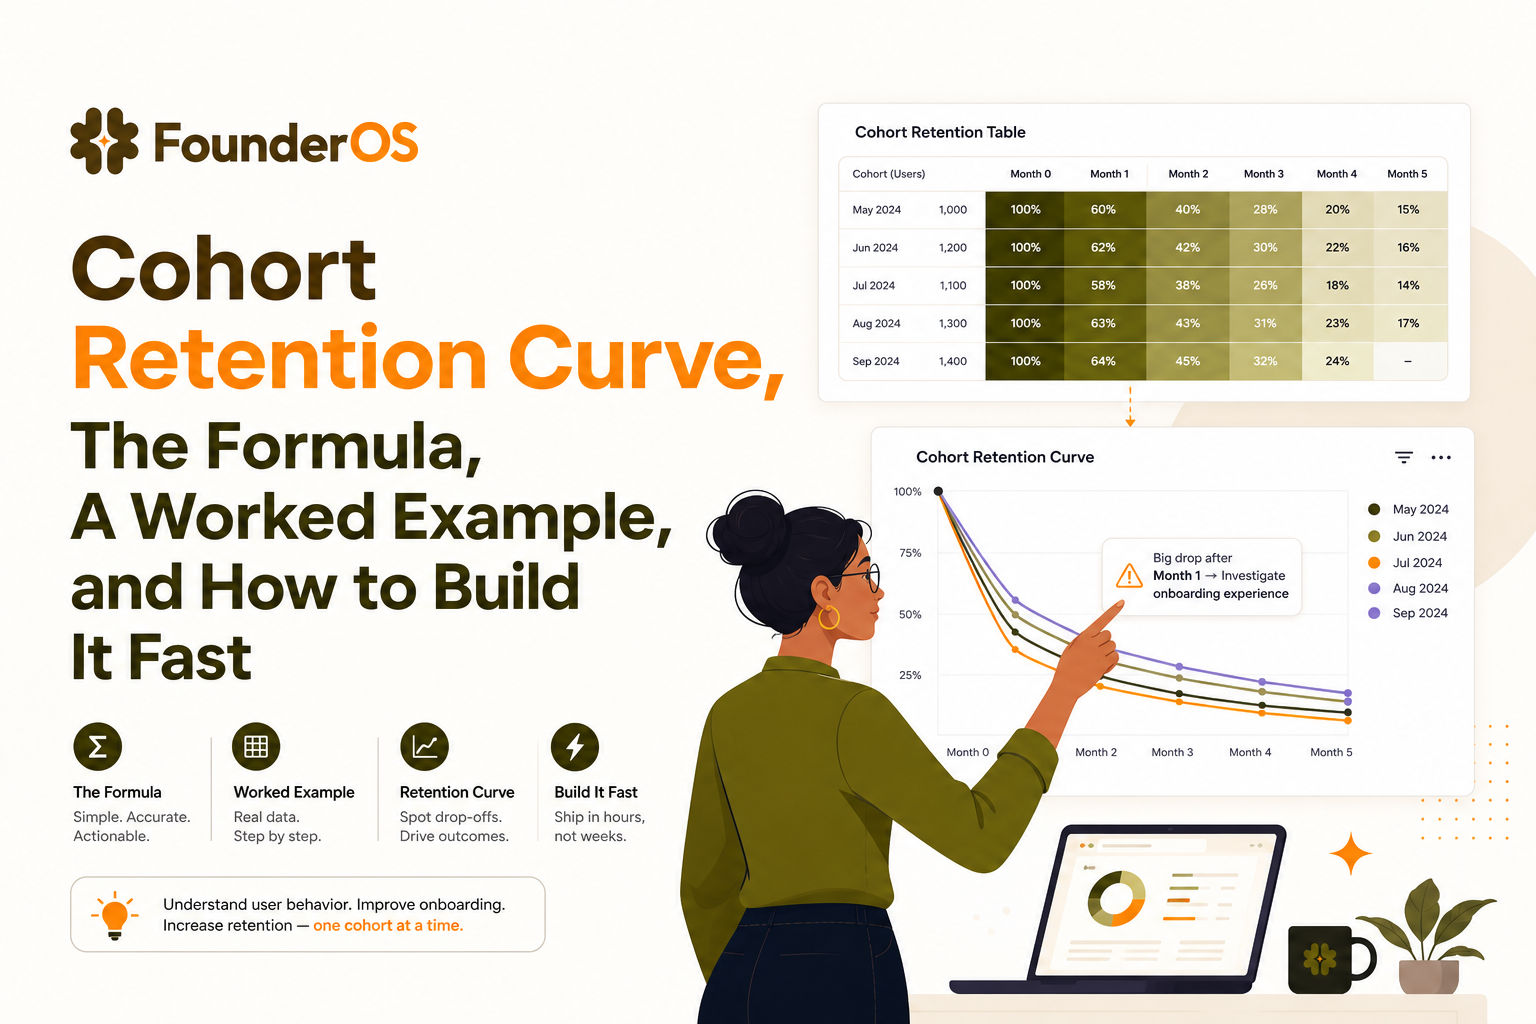
Cohort Retention Curve, The Formula, A Worked Example, and How to Build It Fast
A cohort retention curve is only useful if every point on the line is comparable across cohorts and time. This guide shows the exact inputs to define, the bounded vs unbounded formulas, and one worked example that goes from raw events to a cohort table and final cohort retention curve you can trust.
- Define four inputs first (cohort, retention event, interval, and base period) or your cohort retention curve will be misleading.
- Bounded vs unbounded retention uses the same notation but different denominators, which can change decisions.
- You can build the same cohort table via SQL or a spreadsheet, then operationalize it in-product with real-time tracking and segments.
Define Your Retention Curve Inputs So the Chart Is Actually Comparable
Most “retention” charts fail because teams mix definitions across time. Before you compute anything, lock four inputs and write them down at the top of your dashboard. If any of these change, you are no longer comparing the same cohort retention curve.
Input 1: Cohort definition (who is in the cohort?)
- Common choice: users whose first signup happened in week W (or month M).
- Alternative: users whose first activation happened in week W (often better when signup is noisy).
- Rule: each user belongs to exactly one cohort based on the first time they meet the cohort condition.
Input 2: Retention event (what counts as “came back”?)
Pick an event that represents real product value, not just a visit. Examples for B2B SaaS:
- Workspace activity: “created_report”, “sent_invoice”, “deployed_build”.
- Collaboration: “invited_member”, “comment_added”.
- Revenue-adjacent: “connected_payment_method”, “exported_data”.
Checklist to validate the event:
- It is observable in your tracking (one event name, consistent properties).
- It is repeatable (users can do it again in later periods).
- It is value-linked (a retained user doing it predicts renewal better than a login).
Input 3: Interval (what is “week 1”, “week 2”, etc.?)
Define the bucket size and alignment:
- Weekly retention: good default for early-stage SaaS and onboarding work.
- Monthly retention: better for long sales cycles or infrequent usage products.
- Alignment: use calendar weeks (Mon to Sun) or rolling windows, but do not mix.
Input 4: Base period (what is “week 0”?)
Decide whether you measure retention relative to the cohort’s start (signup week) or relative to first value (activation week). This choice changes the story your cohort retention curve tells. If you are debugging onboarding, rebasing to activation can remove noise from users who signed up but never really started.
Cohort Retention Curve Formula, Bounded vs Unbounded With the Same Notation
Once inputs are fixed, the math is simple, but the denominator is where teams accidentally lie to themselves. Use the same notation for both formulas so you can compare them clearly.
Notation
- Let c be a cohort (for example, users who signed up in 2026-06-01 week).
- Let Nc be the number of users in cohort c (cohort size).
- Let t be the period index (t = 0, 1, 2, ...), where t = 0 is the cohort’s base period.
- Let Rc,t be the number of users in cohort c who performed the retention event at least once during period t.
Unbounded retention (classic cohort retention)
Definition: a user is “retained” in period t if they did the retention event in that period, regardless of whether they were retained in earlier periods.
Formula:
UnboundedRetention%c,t = Rc,t / Nc
When it is correct:
- You care about “came back at least once this period.”
- Your product allows users to be inactive and then return (very common in B2B).
- You want to compare cohorts even if usage is bursty.
Bounded retention (survival style)
Definition: a user is “retained” in period t only if they were retained in every prior period (continuous retention). This is stricter and will always be less than or equal to unbounded retention.
Formula (continuous):
BoundedRetention%c,t = Bc,t / Nc
Where Bc,t is the count of users who have the retention event in all periods 0..t.
When it is correct:
- You need habitual usage (for example, weekly reporting compliance).
- Your KPI is tied to consistent workflows, not occasional returns.
Why the choice changes decisions
Unbounded retention answers: “Do users still get value sometimes?” Bounded retention answers: “Do users build a routine?” If your cohort retention curve is used to justify onboarding changes, unbounded is often the first place to start because it is less sensitive to one missed week, but bounded is useful when you are building a habit-based product motion.
Worked Example From Raw Events to Cohort Table to Retention Curve
Below is a small dataset you can compute by hand. We will use:
- Cohort definition: signup week (calendar week starting 2026-06-01)
- Retention event: “core_action”
- Interval: weekly (W0, W1, W2)
- Method: unbounded retention
Step 1: Raw events
Assume you have this event log (each row is one event occurrence):
| user_id | event_name | event_time (UTC) |
|---|---|---|
| U1 | signup | 2026-06-02 |
| U1 | core_action | 2026-06-03 |
| U1 | core_action | 2026-06-10 |
| U2 | signup | 2026-06-04 |
| U2 | core_action | 2026-06-05 |
| U2 | core_action | 2026-06-18 |
| U3 | signup | 2026-06-06 |
| U3 | core_action | 2026-06-12 |
| U4 | signup | 2026-06-08 |
| U4 | core_action | 2026-06-09 |
| U5 | signup | 2026-06-09 |
Step 2: Assign each user to a cohort
Define cohort as the week of the user’s first signup. For simplicity, use two cohorts:
- Cohort A: signup week starting 2026-06-01 (U1, U2, U3)
- Cohort B: signup week starting 2026-06-08 (U4, U5)
So: NA = 3, NB = 2.
Step 3: Compute period index t for each core_action
For each cohort, define:
- W0: cohort week (t = 0)
- W1: next week (t = 1)
- W2: following week (t = 2)
Now mark whether each user did core_action at least once in each week bucket.
Step 4: Cohort retention table (retained counts)
| Cohort | N (users) | R(t=0) | R(t=1) | R(t=2) |
|---|---|---|---|---|
| A (2026-06-01) | 3 | 2 (U1, U2) | 2 (U1, U3) | 1 (U2) |
| B (2026-06-08) | 2 | 1 (U4) | 0 | 0 |
Step 5: Convert counts to unbounded retention percentages
Use UnboundedRetention%c,t = Rc,t / Nc.
| Cohort | W0 | W1 | W2 |
|---|---|---|---|
| A | 2/3 = 66.7% | 2/3 = 66.7% | 1/3 = 33.3% |
| B | 1/2 = 50.0% | 0/2 = 0.0% | 0/2 = 0.0% |
Step 6: Plot the cohort retention curve
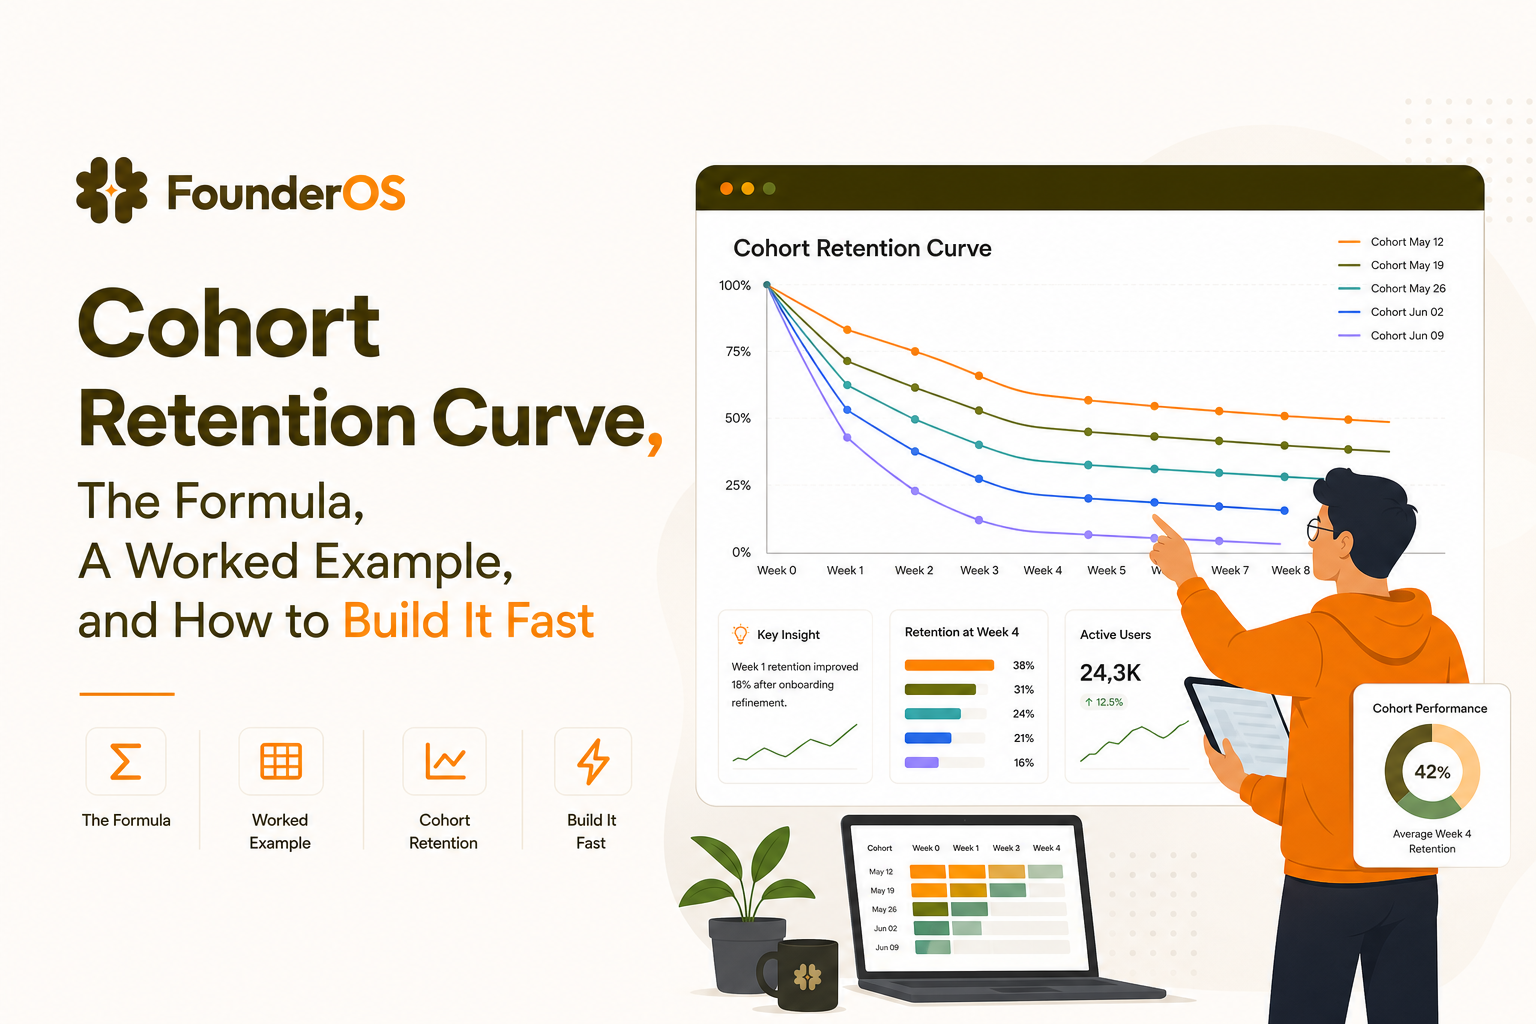
For each cohort, the line is simply the sequence of retention percentages across t. In practice, you usually plot multiple cohorts on the same axes, or plot an average across recent cohorts. This is the point where teams often start debating “why did it drop,” but the work above is what makes that debate valid.
How to Read Cohort Retention Curve Shapes and Translate Them Into Product Actions
Once your cohort retention curve is computed consistently, the shape is a diagnostic. The key is to map shapes to specific levers and then validate with segmentation and session-level investigation, not guesses.
Shape 1: Fast decline then flat (the common SaaS curve)
- What it means: many users never reach sustained value, but a subset finds a stable workflow.
- What to do next: improve early activation and time-to-value, then protect the stable segment.
Action checklist:
- Define a single user activation event and measure time-to-activation by cohort.
- Run funnel analysis from signup to activation to see where W0 users stall.
- Create segments of “activated but not retained” and compare their first-week behavior to retained users.
Shape 2: Continuous decline (no plateau)
- What it means: users keep churning over time, often due to missing product habit, weak ongoing value, or poor fit for the acquired audience.
- What to do next: identify the “sticky action” that predicts week-4 retention, then drive it.
In our experience working with early B2B SaaS teams, the fastest win is to pick one repeatable workflow and instrument it end-to-end, because otherwise your retention event is too broad and your cohort retention curve becomes a vague signal.
Shape 3: Smiling curve (drops then rises)
- What it means: users return after a delay, often because the product is used on a cadence (monthly close, quarterly planning) or needs team rollout time.
- What to do next: switch to a longer interval (monthly), or track a different retention event that reflects interim value.
What surprised our team was how often a “smile” disappeared once we aligned the interval to the real workflow cadence, for example moving from weekly to monthly for finance-oriented products.
Turn shapes into a concrete investigation plan
| Observation in curve | Most likely cause | Next query to run | Intervention to test |
|---|---|---|---|
| W0 is low | Activation friction | Signup to activation funnel drop-off | Onboarding checklist, remove one required step |
| W1 falls sharply | Value not repeated | Which events predict W1 retention | In-app nudges to repeat the core workflow |
| No plateau by W4 | Weak fit or weak habit | Retention by acquisition channel | Refine ICP targeting, improve sticky feature adoption |
Build It Two Ways, Copy-Paste SQL and a Matching Excel or Sheets Setup
You can build the cohort table in your warehouse or in a spreadsheet. The important part is that both methods output the same cohort-by-week matrix, which then feeds a cohort retention curve line chart.
Option A: SQL cohort table (unbounded weekly retention)
Assume a table events with columns: user_id, event_name, event_time (timestamp). This query:
- Finds each user’s cohort week from their first signup
- Counts distinct users who fired the retention event per week offset
WITH signups AS (
  SELECT
    user_id,
    DATE_TRUNC('week', MIN(event_time)) AS cohort_week
  FROM events
  WHERE event_name = 'signup'
  GROUP BY 1
),
retention_events AS (
  SELECT
    e.user_id,
    DATE_TRUNC('week', e.event_time) AS event_week
  FROM events e
  WHERE e.event_name = 'core_action'
),
joined AS (
  SELECT
    s.cohort_week,
    r.user_id,
    r.event_week,
    DATEDIFF('week', s.cohort_week, r.event_week) AS week_index
  FROM signups s
  JOIN retention_events r
    ON s.user_id = r.user_id
  WHERE DATEDIFF('week', s.cohort_week, r.event_week) >= 0
)
SELECT
  cohort_week,
  week_index,
  COUNT(DISTINCT user_id) AS retained_users
FROM joined
GROUP BY 1,2
ORDER BY 1,2;
To compute percentages, join in cohort sizes:
WITH cohort_sizes AS (
  SELECT
    DATE_TRUNC('week', MIN(event_time)) AS cohort_week,
    COUNT(DISTINCT user_id) AS cohort_size
  FROM events
  WHERE event_name = 'signup'
  GROUP BY 1
),
retained AS (
  -- paste the previous SELECT here (cohort_week, week_index, retained_users)
  SELECT
    cohort_week,
    week_index,
    COUNT(DISTINCT user_id) AS retained_users
  FROM (
    SELECT
      s.cohort_week,
      r.user_id,
      DATEDIFF('week', s.cohort_week, r.event_week) AS week_index
    FROM (
      SELECT user_id, DATE_TRUNC('week', MIN(event_time)) AS cohort_week
      FROM events
      WHERE event_name = 'signup'
      GROUP BY 1
    ) s
    JOIN (
      SELECT user_id, DATE_TRUNC('week', event_time) AS event_week
      FROM events
      WHERE event_name = 'core_action'
    ) r
      ON s.user_id = r.user_id
    WHERE DATEDIFF('week', s.cohort_week, r.event_week) >= 0
  ) x
  GROUP BY 1,2
)
SELECT
  r.cohort_week,
  r.week_index,
  r.retained_users,
  c.cohort_size,
  1.0 * r.retained_users / c.cohort_size AS retention_rate
FROM retained r
JOIN cohort_sizes c USING (cohort_week)
ORDER BY 1,2;
Option B: Excel or Google Sheets (same output)
Structure your sheet like this:
- Tab 1 (Events): columns = user_id, event_name, event_time, event_week (computed), cohort_week (lookup).
- Tab 2 (Cohorts): a table of user_id to cohort_week (computed from MIN signup date).
- Tab 3 (Pivot): pivot table counting distinct user_id where event_name = core_action, with rows = cohort_week and columns = event_week.
Concrete formulas:
- event_week:
=DATE(A2)-WEEKDAY(DATE(A2),2)+1(Monday-based week start; adapt as needed) - cohort_week: use a lookup from the Cohorts tab (user_id to cohort_week)
- week_index:
=(event_week - cohort_week)/7
Then create a second pivot that divides each cell by the cohort size (the W0 cohort count). Plot the row as a line chart to get the cohort retention curve for that cohort.
Common build errors (and how to catch them)
- Double-counting: count distinct users per period, not event rows.
- Timezone drift: define whether cohort_week uses UTC or customer timezone and apply consistently.
- Changing event definitions: if you rename events, backfill or map old names, or the curve will “break.”
Implement the Cohort Retention Curve in Founder OS in One Afternoon
If you want this live in-product instead of rebuilding spreadsheets, the implementation path is straightforward: track events consistently, tie them to a person profile, define cohorts and segments, then view retention over time. After running a few audits, the pattern was clear: teams get stuck not on the formula, but on inconsistent event naming and missing identity stitching.
Step 1: Install tracking and confirm the retention event fires
- Install the tracking snippet so page views and clicks are captured immediately.
- Add a single custom event for your retention event (for example,
core_action) with one line of code where the value moment happens. - Verify in the live event stream that the event arrives with the right user identifier.
Step 2: Make identity stable with user profiles
- Ensure anonymous sessions merge into the logged-in user profile at signup or login.
- Store key traits needed for slicing retention: plan, role, company size, acquisition source.
Step 3: Define cohorts and retention views
- Create a cohort based on first signup (or first activation if you want a cleaner base).
- Build a retention view using the retention event and weekly or monthly intervals.
- Compare cohorts side by side to see whether changes improved the cohort retention curve for new users.
Step 4: Turn the curve into action with segmentation
Retention gets actionable when you can isolate “at-risk” users based on behavior, not guesses. Use user segmentation to create dynamic audiences like:
- Activated in W0 but no retention event in W1
- Used feature A but not feature B (adoption gap)
- High intent (multiple sessions) but blocked before core_action
Then pair those segments with onboarding flows or targeted nudges so the cohort retention curve moves for the next cohort, not just in hindsight.
Step 5: Monitor supporting metrics so retention changes are explainable
Retention rarely improves in isolation. Track a small set of user engagement metrics that explain movement, such as time-to-activation, feature adoption rate, and repeat usage frequency. This prevents the common failure mode where the cohort retention curve moves but nobody can say why.
| What you need | Spreadsheet approach | In-product approach | Best for |
|---|---|---|---|
| One-off analysis | Fast if data is small | Setup overhead | Ad hoc investigation |
| Always-on monitoring | Fragile, manual refresh | Live dashboards and segments | Product iteration cycles |
| Behavior-based targeting | Hard to operationalize | Dynamic audiences | Retention interventions |
FAQ about cohort retention curves
If you want your cohort retention curve to update automatically as new users arrive, and you want to turn “at-risk” cohorts into real segments you can act on, Founder OS is built to take you from tracking to retention views and onboarding interventions without living in spreadsheets. Start with one retention event, one cohort definition, and a weekly view, then iterate as you learn.

Onboarding Softwares for SaaS - The Shortlist and Buyer Scorecard for In-App Flows
Compare onboarding softwares for SaaS in-app tours and flows using a buyer scorecard, shortlist, pricing notes, and a 14-day rollout plan.
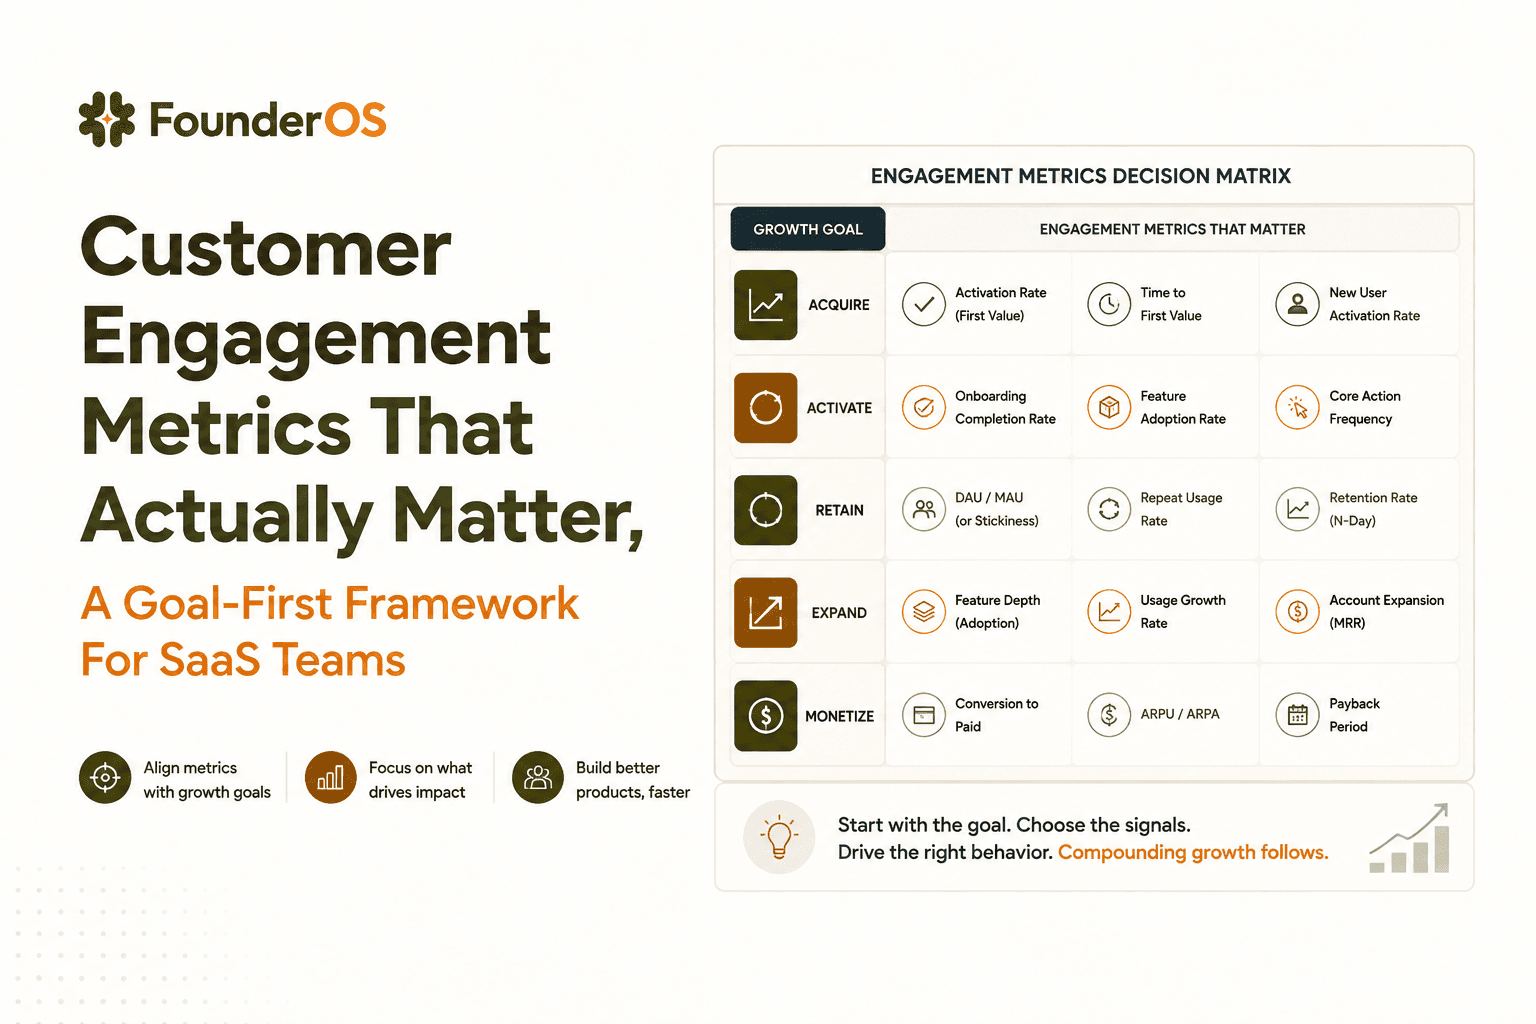
Customer Engagement Metrics That Actually Matter, A Goal-First Framework For SaaS Teams
A goal-first framework for customer engagement metrics in SaaS: pick 3 to 5 KPIs, benchmark them, build tracking, and turn movement into actions.

Onboarding Flows Explained, A Practical Framework to Drive Activation
Learn onboarding flows for B2B SaaS with a practical framework to design, segment, and measure flows that improve activation, not just completion.