
Analytics Software Tools for B2B SaaS - The 10-Tool Shortlist and How to Choose
A BOFU-ready shortlist of analytics software tools for B2B SaaS: 10 picks across categories plus a buyer rubric and rollout plan.

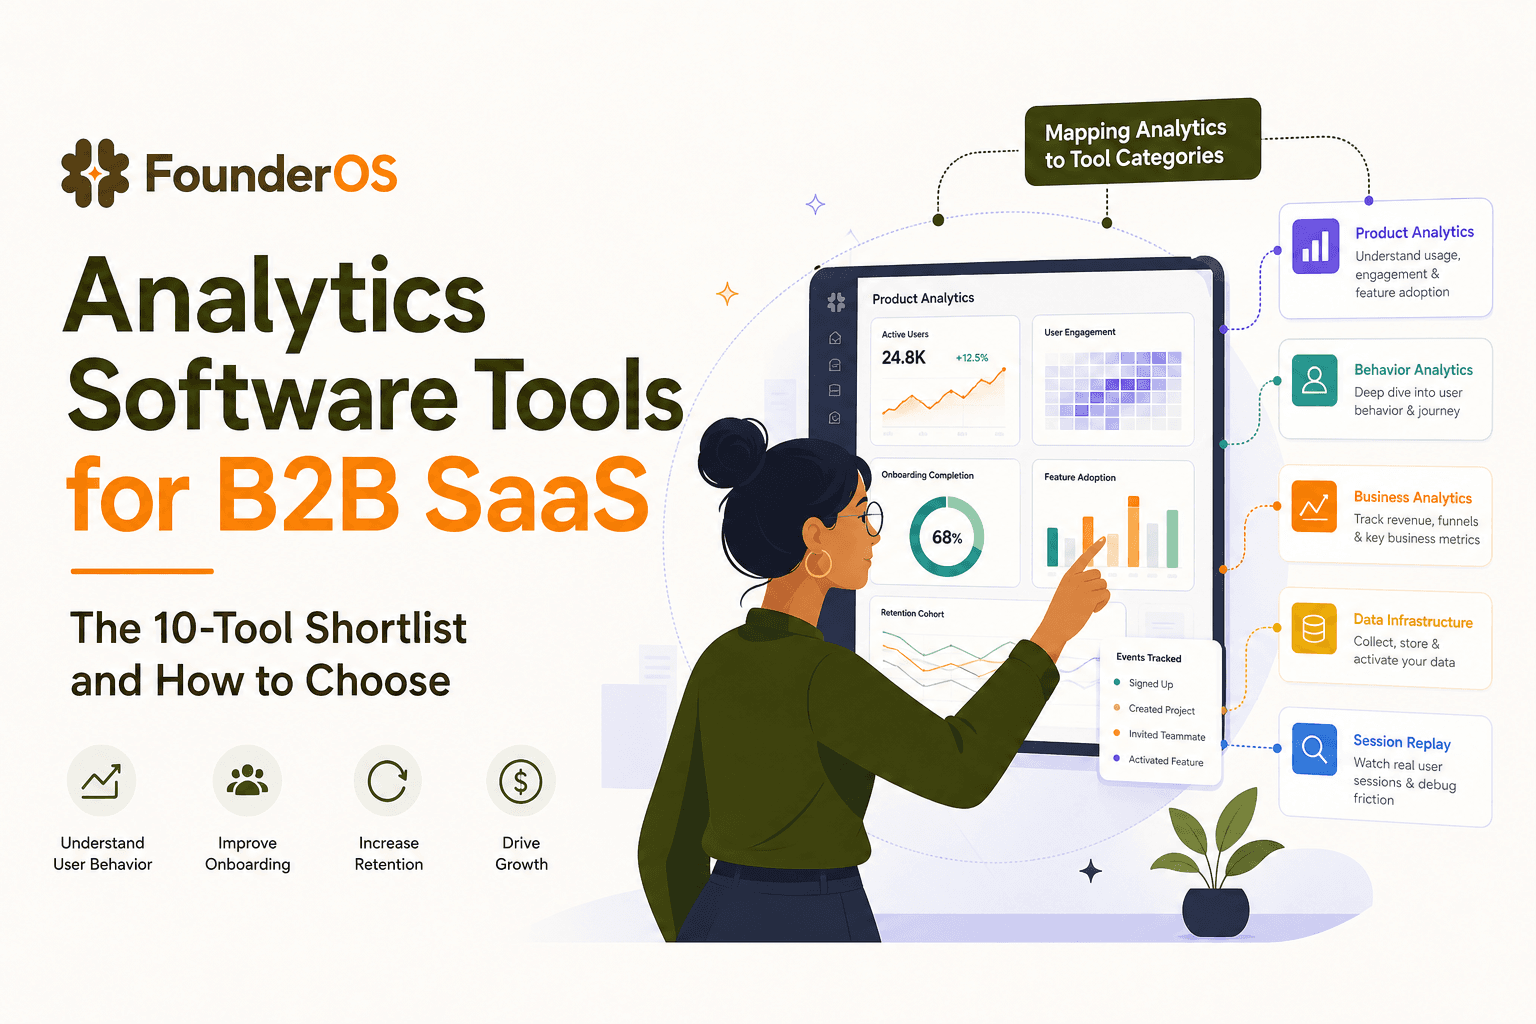
Choosing analytics software tools for a B2B SaaS team is less about “more dashboards” and more about matching the tool category to the decision you need to make: acquisition efficiency, activation lift, retention risk, or revenue expansion.
- Pick tool categories by the question you need answered (descriptive, diagnostic, predictive, prescriptive), not by brand popularity.
- Use a repeatable rubric (time-to-value, skills, governance, deployment, and data volume) to avoid buying overlapping analytics software tools.
- For most B2B SaaS teams, start with product event tracking and funnels, then add BI and warehouse modeling only when decisions require it.
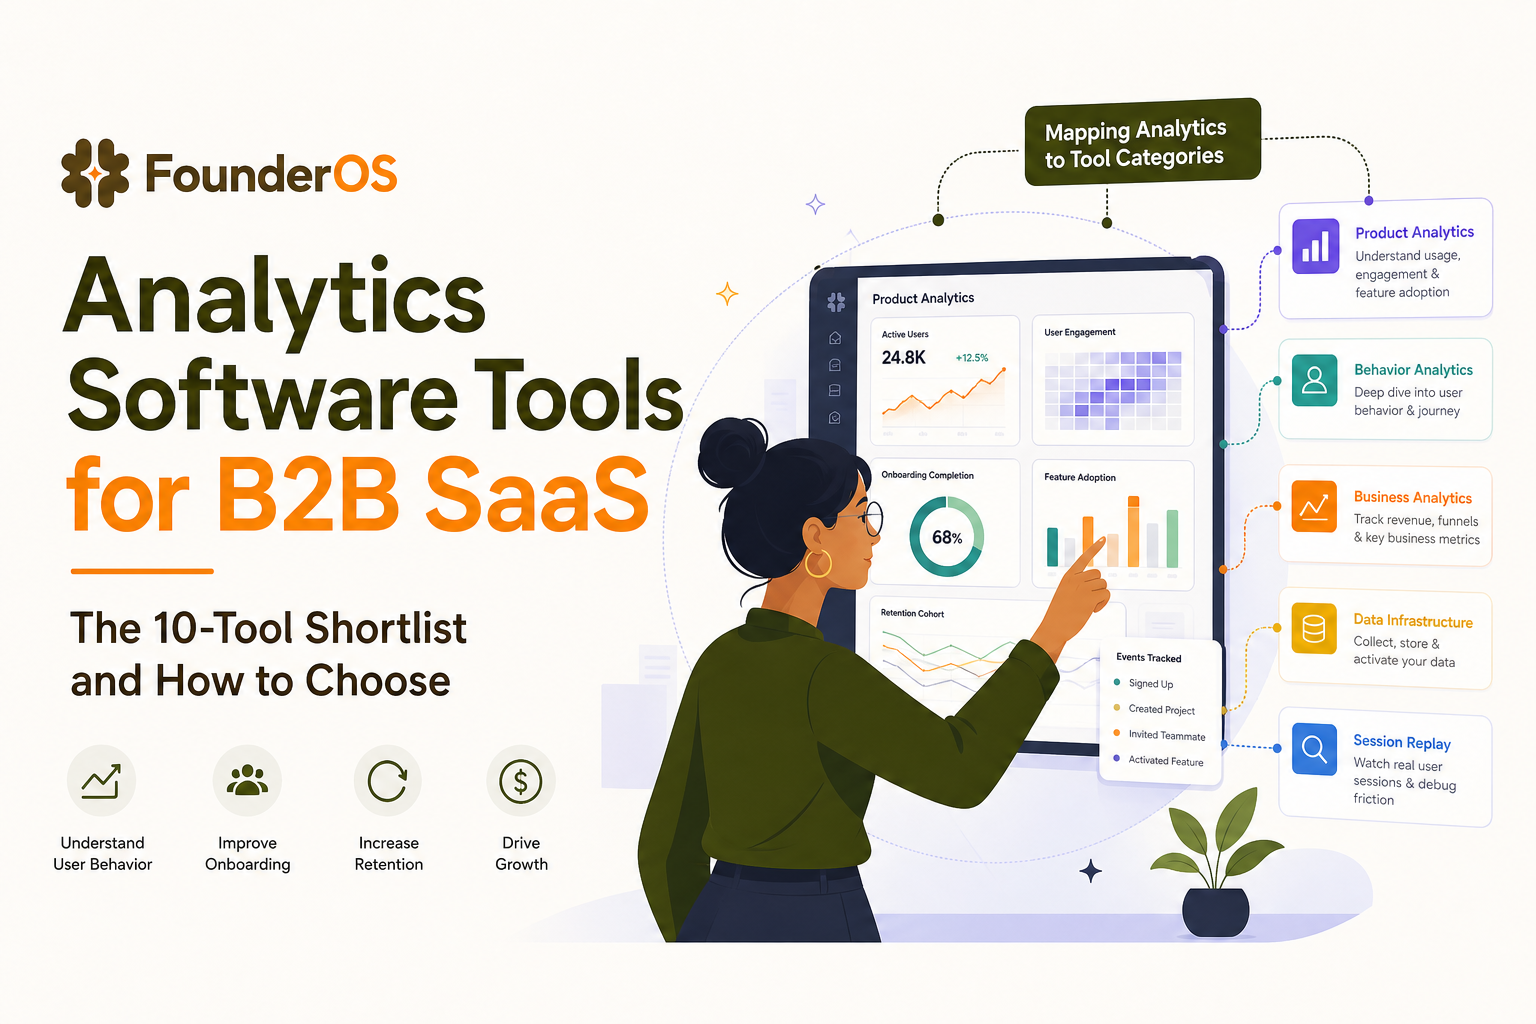
The 4 Types of Analytics and Which Analytics Software Tools Actually Deliver Each
Most “tool confusion” comes from mixing up types of analytics (what decision you’re trying to make) with tool categories (how data is collected and analyzed). Use this mapping to decide what to buy first and what to postpone.
1) Descriptive analytics: what happened?
- Best tool categories: Web analytics, product analytics, BI dashboards
- Typical SaaS questions: How many signups came from a channel? What is activation rate this week? Which features are used most?
- What “good” looks like: A single source of truth for core KPIs, updated daily or near real time, with consistent definitions.
2) Diagnostic analytics: why did it happen?
- Best tool categories: Product analytics (funnels, paths), session replay, qualitative feedback, BI with drill-down
- Typical SaaS questions: Where do users drop off in onboarding? Which cohort churned and what did they do differently?
- Selection trigger: You need to click from an aggregate metric into the users, sessions, or events behind it.
3) Predictive analytics: what will happen next?
- Best tool categories: Data science notebooks, warehouse + ML, CDP/Reverse ETL with scoring
- Typical SaaS questions: Which accounts are likely to churn? Which leads are likely to activate in 7 days?
- Selection trigger: You have enough historical data and stable definitions to train and monitor models.
4) Prescriptive analytics: what should we do?
- Best tool categories: Experimentation, lifecycle automation, in-app onboarding, alerting
- Typical SaaS questions: Which onboarding variant increases activation? What message should at-risk users see next?
- Selection trigger: You can turn insights into actions inside product or GTM workflows within days, not quarters.
In practice, most B2B SaaS teams get the fastest ROI by prioritizing descriptive + diagnostic first, because those are the analytics layers that directly unblock activation and retention work. If you want a broader taxonomy, see our guide to analytics software categories.
Top Analytics Software Tools Shortlist for B2B SaaS - 10 Picks Across Categories
This shortlist is organized by category, because “best” depends on whether you need event-level product insight, marketing attribution, ad hoc BI, or modeling. Each pick includes a selection trigger so you can decide quickly.
1) Google Analytics 4 (GA4) - web analytics
- Best for: Website acquisition reporting and basic conversion events
- Key capabilities: Traffic source analysis, event-based tracking, basic funnels
- Pricing note: Free tier; GA4 360 is enterprise
- Choose it if: You need a standard baseline for marketing and website reporting
2) Google Search Console - organic search diagnostics
- Best for: SEO performance data you cannot reliably infer elsewhere
- Key capabilities: Queries, impressions, clicks, indexing coverage
- Pricing note: Free
- Choose it if: Organic is material and you need query-level visibility
3) Looker Studio - lightweight dashboards
- Best for: Fast, shareable KPI dashboards across marketing and ops
- Key capabilities: Connectors, basic visualization, scheduled emails
- Pricing note: Free; enterprise options exist via Google Cloud
- Choose it if: You need “good enough” reporting without a BI implementation project
4) Power BI - Microsoft-centric BI
- Best for: Teams already standardized on Microsoft 365/Azure
- Key capabilities: Semantic modeling, governance, strong enterprise distribution
- Pricing note: Per-user licensing; capacity for scale
- Choose it if: You need governed dashboards and your org already has Microsoft admin muscle
5) Tableau - visual exploration for business teams
- Best for: Interactive, visual analysis for non-technical stakeholders
- Key capabilities: Rich visualizations, drill-down exploration, broad connector ecosystem
- Pricing note: Role-based licensing
- Choose it if: Your analytics consumers want self-serve exploration more than fixed KPI tiles
6) Metabase - open source BI for quick internal adoption
- Best for: Fast internal BI with SQL optionality
- Key capabilities: Questions, dashboards, SQL editor, permissions
- Pricing note: Open source and paid cloud options
- Choose it if: You want to ship internal reporting quickly and keep costs predictable
7) Apache Superset - scalable open source BI
- Best for: Engineering-led BI at scale
- Key capabilities: Dashboards, SQL Lab, role-based access, extensibility
- Pricing note: Open source; infra and ops costs apply
- Choose it if: You have platform engineering support and want a customizable BI layer
8) Jupyter Notebook - data science and analysis workflows
- Best for: Modeling, advanced analysis, prototyping metrics logic
- Key capabilities: Python/R analysis, reproducible notebooks, ML experimentation
- Pricing note: Open source; managed options exist
- Choose it if: You need predictive work or complex segmentation that BI alone cannot express
9) dbt - analytics engineering and metric consistency
- Best for: Transformations and consistent definitions in the warehouse
- Key capabilities: Version-controlled SQL transforms, testing, documentation
- Pricing note: Open source + paid cloud
- Choose it if: KPI definitions keep drifting across teams and you need governed transformations
10) Segment - customer data platform (CDP)
- Best for: Routing event data to multiple destinations with governance
- Key capabilities: Event collection, schema controls, destination routing
- Pricing note: Tiered pricing; costs grow with volume
- Choose it if: You have multiple downstream tools and need consistent event delivery
If your shortlist is specifically for product behavior, also review our breakdown of product analytics tools and how to avoid duplicative stacks. And if you are trying to connect events to revenue outcomes, this guide to event analytics is the most practical starting point.
How to Choose Analytics Software Tools - A Repeatable Buyer Rubric for SaaS Teams
Instead of debating brands, score categories and candidates against the same rubric. The goal is to minimize time-to-value while keeping definitions stable as you scale.
The 5-factor scoring rubric (0 to 5 each)
- Time-to-value: Can you get first reliable insight in 1 to 7 days? Or does it require weeks of modeling and stakeholder alignment?
- Skills required: Can a PM or marketer self-serve, or do you need SQL, data engineering, or ML skills?
- Governance and consistency: Does it prevent metric drift (definitions, permissions, audit trails)?
- Deployment fit: Cloud-only vs self-hosted, data residency needs, SSO, role-based access.
- Data volume economics: How do costs scale with events, users, seats, or queries?
A practical way to apply it in one meeting
- Step 1: Write 3 decisions you must make in the next 30 days (example: “Fix onboarding drop-off on step 3”, “Find which channel produces activated accounts”, “Detect churn risk earlier”).
- Step 2: Map each decision to the analytics type (descriptive, diagnostic, predictive, prescriptive).
- Step 3: Pick the minimum tool category that answers it. For onboarding drop-off, that is usually product event tracking with funnels, not a warehouse project.
- Step 4: Score 2 to 3 candidates per category using the rubric and choose the highest total that meets your constraints.
When we tested this rubric on stacks that had grown organically, the biggest “hidden cost” wasn’t licensing, it was definition drift: teams were reporting activation differently across BI, web analytics, and CRM exports. A rubric forces you to ask early whether the tool helps enforce consistent metrics or just visualizes inconsistent ones.
What to buy first and what to skip (for most B2B SaaS teams)
- Buy first: Product event tracking + funnels (diagnostic), then a lightweight dashboard layer for stakeholder visibility.
- Add next: Warehouse transforms (dbt) once you have multiple systems and consistent definitions matter more than speed.
- Skip for now: Predictive modeling tooling if you cannot yet define churn, activation, and “aha moments” consistently.
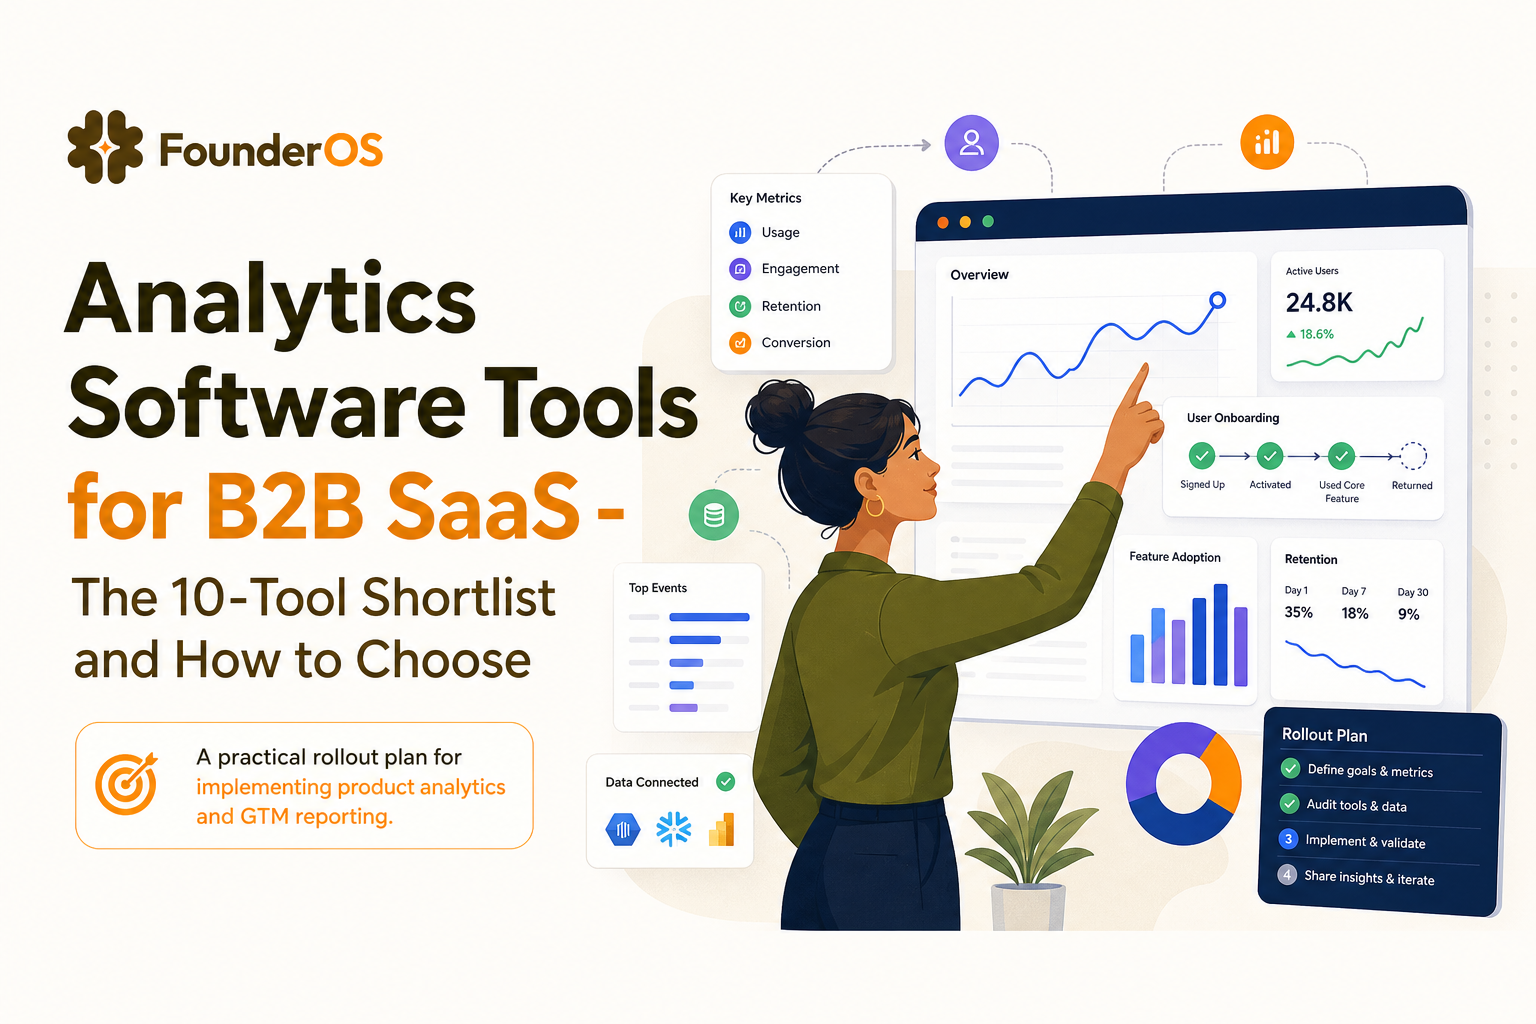
Where Founder OS Fits in Your Analytics Stack - Implementation Plan and Next Steps
If your priority is understanding the full user journey from signup to activation and tying that to GTM reporting, Founder OS fits as the product analytics layer that captures user behavior quickly and turns it into funnels and segments you can act on.
A simple rollout plan (days, not quarters)
- Install and validate event capture: Start by confirming that core actions (page views, clicks, form submits, and key feature interactions) are being captured and visible in a live stream. In our experience, the fastest wins come from validating 5 to 10 “decision events” first, not trying to instrument everything.
- Define one activation funnel: Build a funnel from signup to your first meaningful value event, then identify the highest-drop step and review sessions/users behind it.
- Create behavioral segments: Build segments such as “new activators”, “power users”, and “disengaged users” based on event sequences and recency so they update automatically.
- Operationalize insights: Route segments into onboarding experiences and internal alerts, then measure impact on activation and feature adoption over time.
What success looks like after 2 to 4 weeks
- One agreed activation definition with a visible funnel and weekly trend.
- Two to three segments that update automatically and are used in onboarding or lifecycle workflows.
- A short list of drop-off reasons tied to specific steps, screens, or actions, not vague “users didn’t get value”.
We initially assumed teams needed a full BI layer before they could act, but the data showed the opposite: once you can see drop-offs and replay the journey at the user level, the first set of activation fixes often ships before a warehouse model is even finalized. If you are still comparing options, our checklist for best analytics software can help you pressure-test tradeoffs, and this framework for user engagement metrics helps you pick KPIs that match your onboarding and retention goals.
| Need | Tool category | What you get | Buy when |
|---|---|---|---|
| Channel and website performance | Web analytics | Traffic sources, landing conversion, basic events | Marketing spend or SEO is meaningful |
| Activation and feature adoption | Product analytics | Funnels, paths, cohorts, user-level drill-down | You need to find and fix drop-offs fast |
| Company-wide KPI reporting | BI dashboards | Governed metrics, cross-system reporting | Multiple teams need consistent definitions |
| Consistent transformations and definitions | Analytics engineering | Versioned models, tests, documentation | Metric drift is causing decision conflict |
| Churn prediction and scoring | Data science | Models, forecasts, propensity scores | You have stable labels and enough history |
FAQ about analytics software tools for B2B SaaS
How many analytics software tools does a B2B SaaS team actually need?
Most teams can start with 2 to 3: one web analytics tool for acquisition, one product analytics tool for activation and retention, and optionally a lightweight BI layer for stakeholder reporting. Add warehouse modeling and data science only when cross-system definitions and predictive use cases become unavoidable.
What should we instrument first for product analytics?
Start with an activation funnel: signup, onboarding steps, and the first “value” action (your core feature use). Then add events that explain drop-offs: errors, empty states, pricing/paywall views, and key feature interactions.
How do we avoid conflicting KPI definitions across tools?
Write a one-page metric spec for each KPI (name, formula, event sources, inclusion rules, time window) and ensure the same definition is used in dashboards and reports. As you scale, consider an analytics engineering layer to enforce consistent transformations.
When is it worth adding predictive analytics?
Add predictive tooling when you have stable historical labels (for example, a clear churn definition) and enough volume to train and monitor models. If your activation and retention definitions are still changing, predictive work often produces brittle outputs.
If your next priority is faster activation insights from product behavior, Founder OS can be the analytics layer that gets you from install to funnels, segments, and GTM reporting quickly. Start free or book a demo to map your first activation funnel and identify the highest-impact drop-off to fix.

Read Next
View all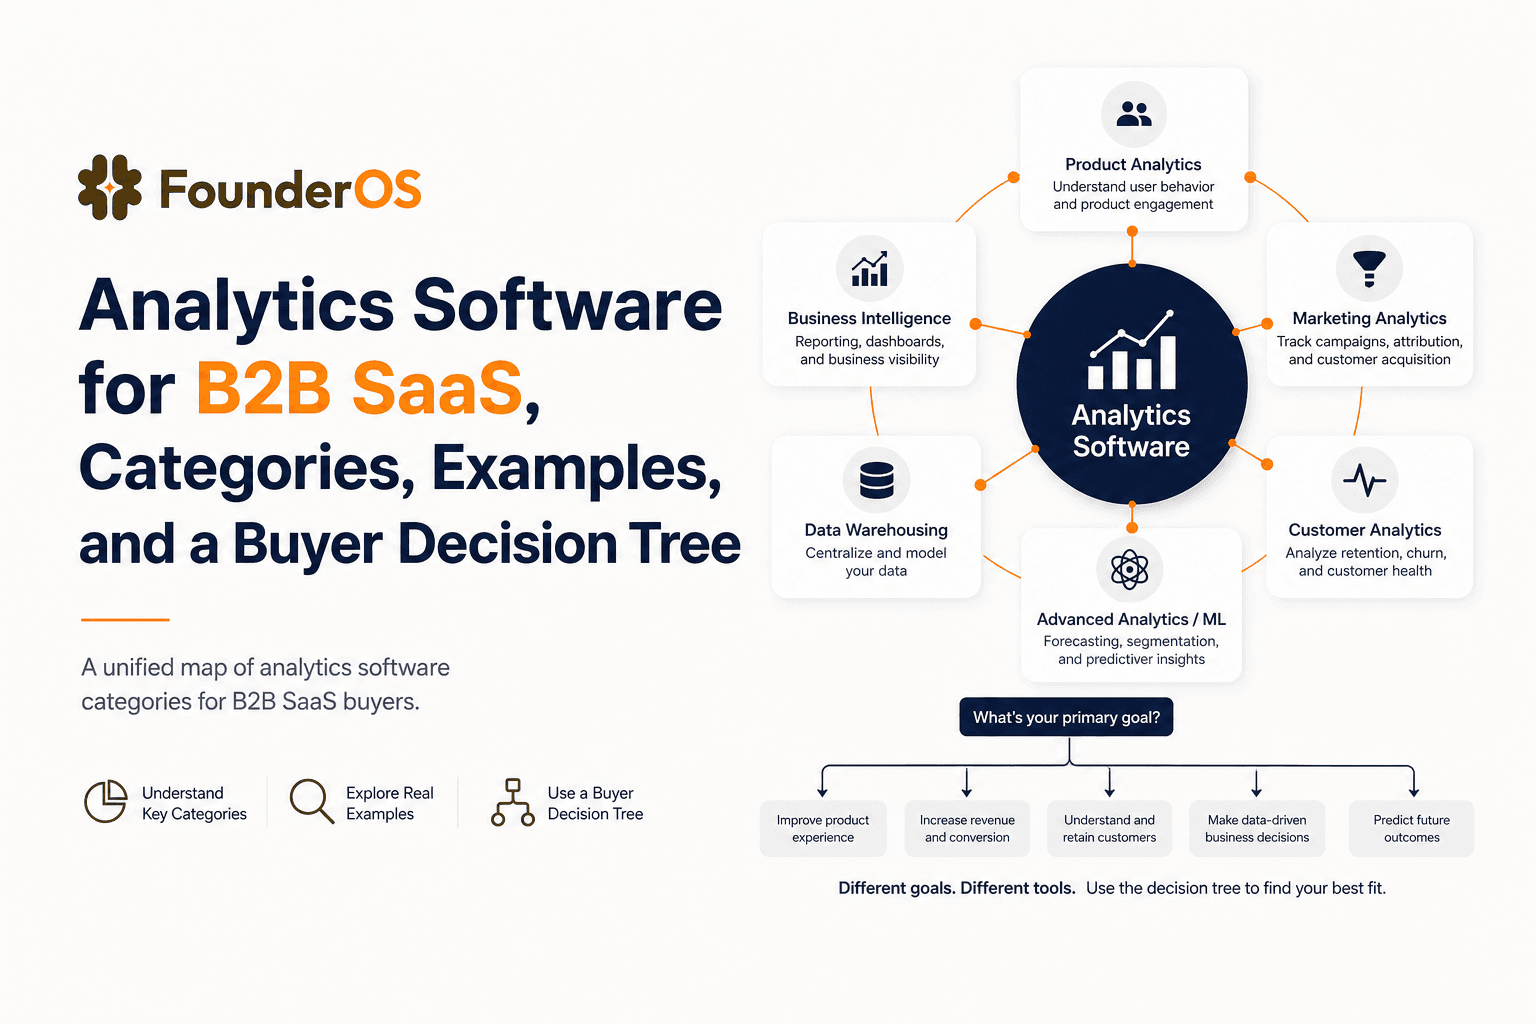
Analytics Software for B2B SaaS, Categories, Examples, and a Buyer Decision Tree
Choose analytics software for B2B SaaS with a clear category map, 10-minute decision tree, real workflows, and a practical buyer checklist.
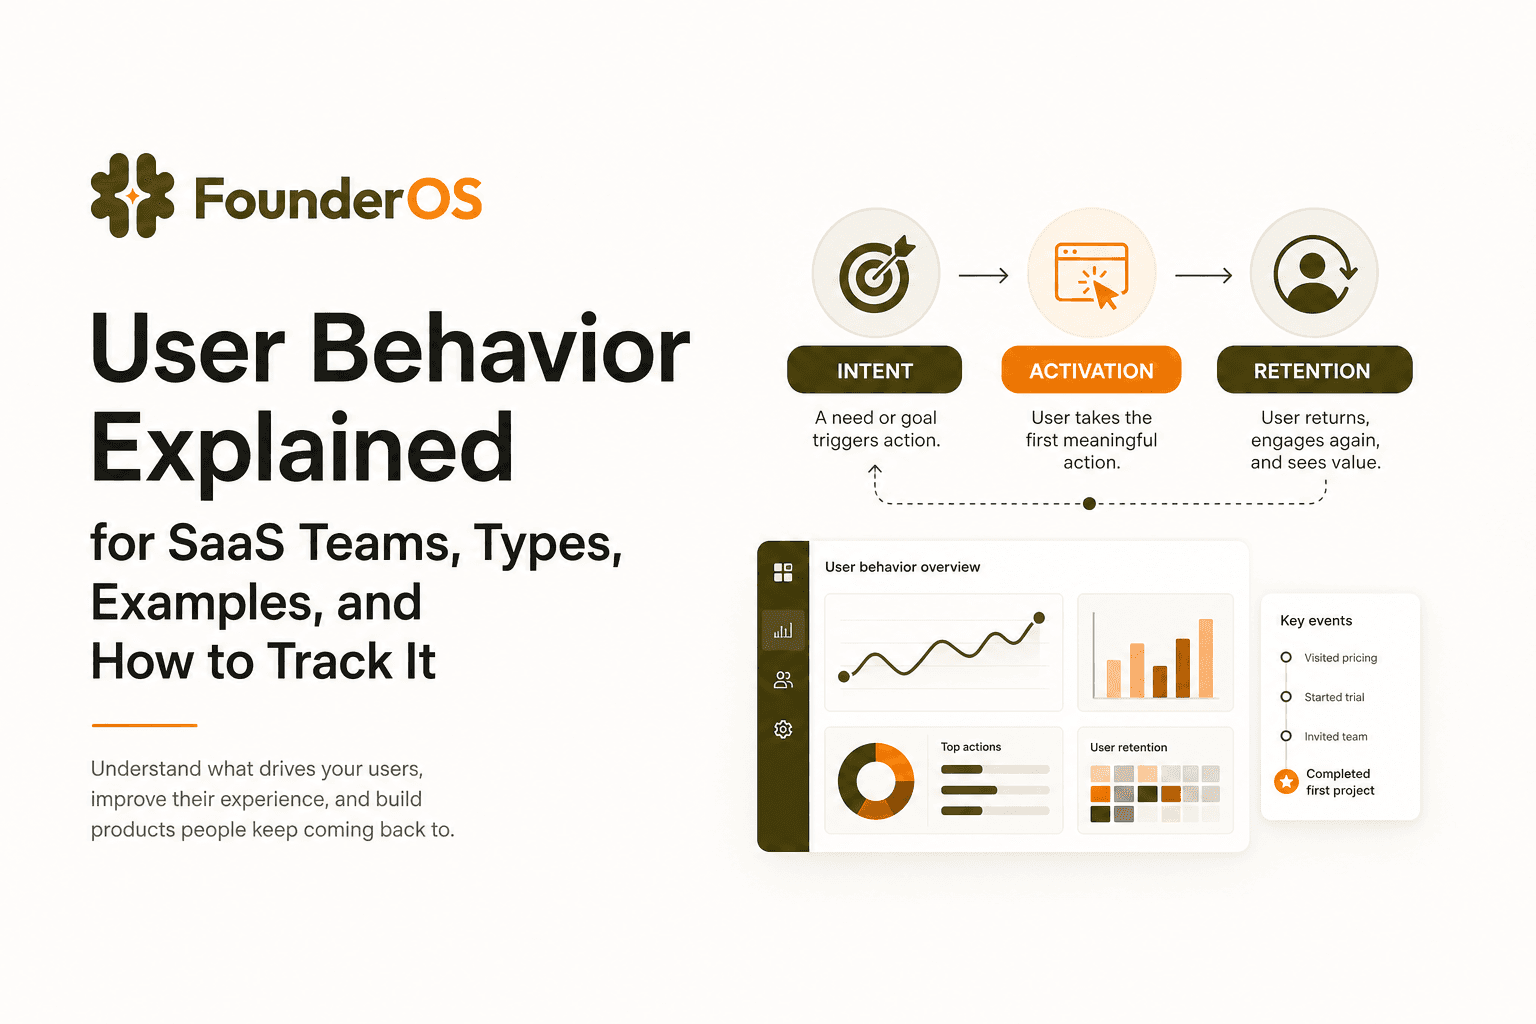
User Behavior Explained for SaaS Teams, Types, Examples, and How to Track It
Learn what user behavior means in SaaS, the key types, and a practical event tracking playbook to turn user behavior into product decisions.
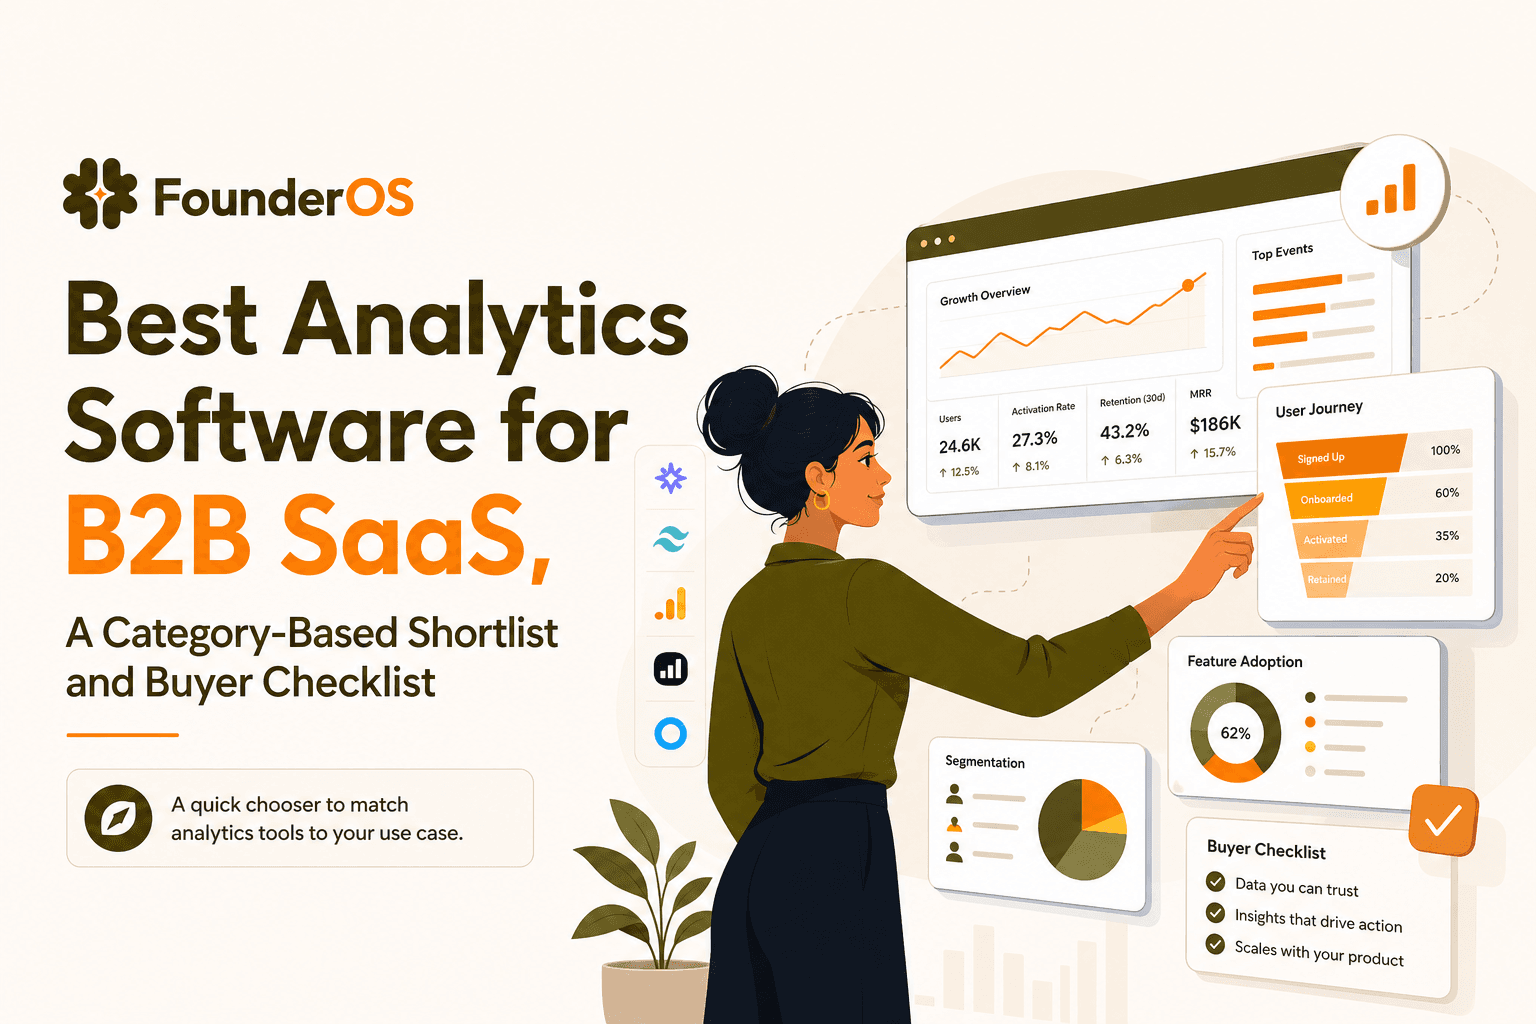
Best Analytics Software for B2B SaaS, A Category-Based Shortlist and Buyer Checklist
Find the best analytics software for B2B SaaS with a 1-minute chooser, category shortlists, GA4 parity checklist, and a 14-day rollout plan.