
Behavior Analytics for SaaS Teams, What It Is and Why It Matters
Behavior analytics is the practice of turning product events into patterns that explain what users do, where they stall, and what action to take next. For SaaS teams, that means reading clicks, sessions, feature use, and drop-offs as signals, not noise.
- Behavior analytics helps SaaS teams move from raw events to clear product decisions.
- The most useful signals come from repeated actions, not one-off clicks.
- Start with a small event set, one success metric, and one segment you want to understand.
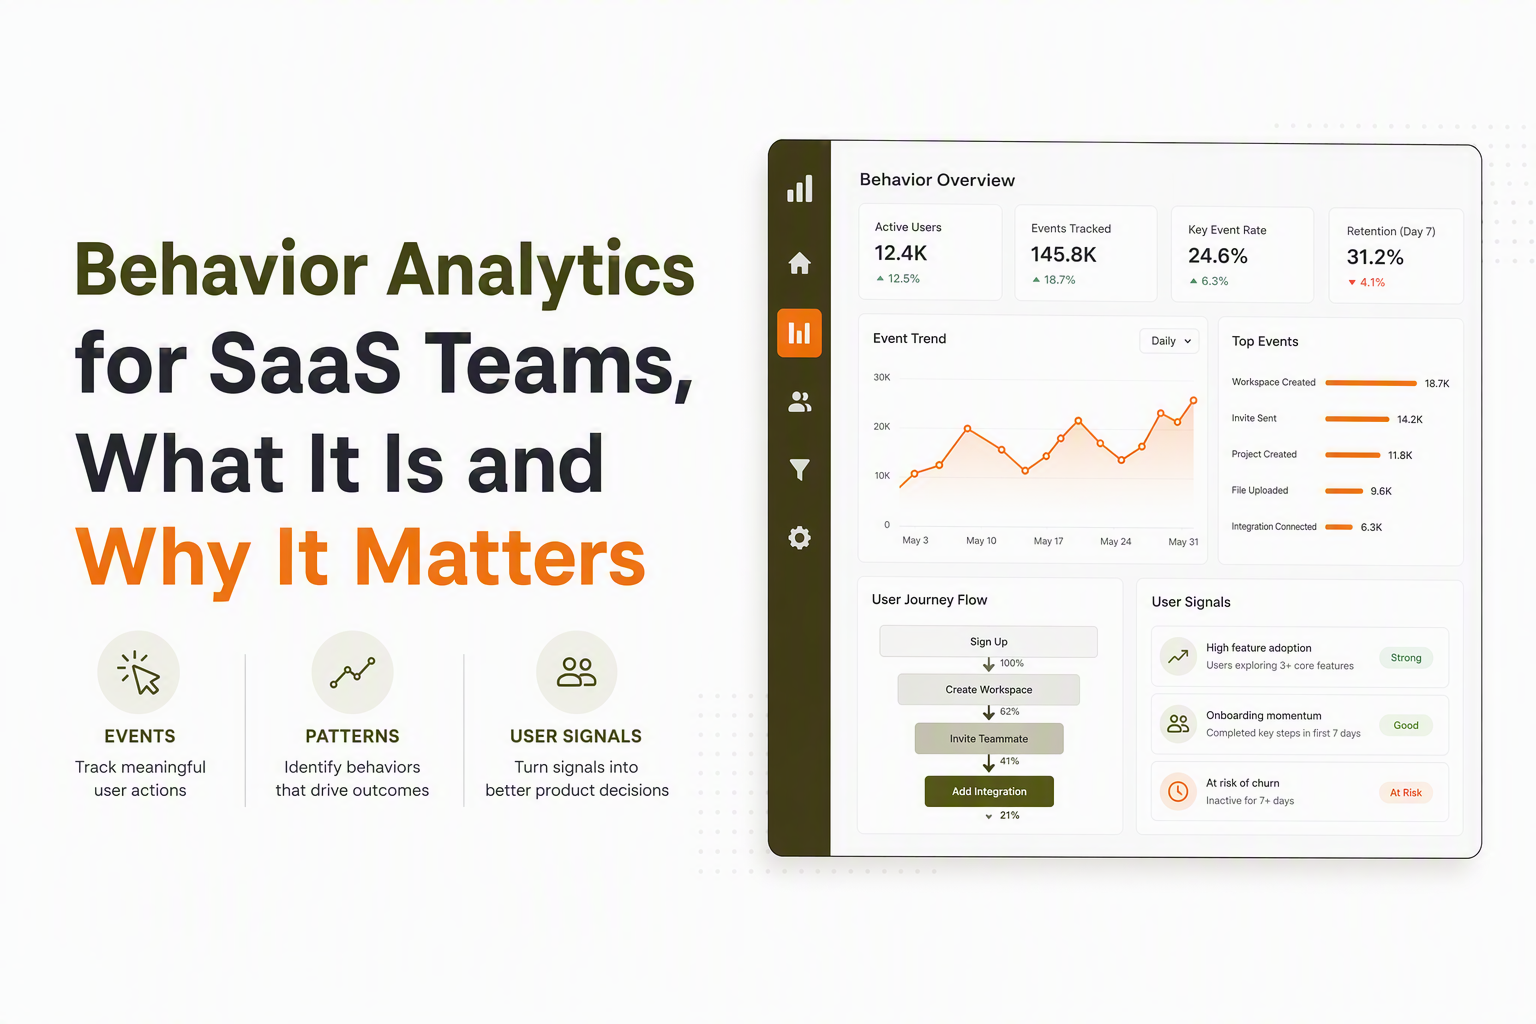
What behavior analytics means in SaaS, and what it is not
Behavior analytics in SaaS means studying how users interact with your product so you can spot patterns, not just record activity. It is not academic behavior analysis, and it is not only a cybersecurity term for detecting threats.
Use the product context
In a product team, the goal is practical: understand which actions lead to activation, which ones predict retention, and which ones signal hesitation. If you want the supporting pieces, user behaviour analysis, analytics events tracking, and digital product analytics show how teams define events before they try to interpret them.
Separate signal from noise
A page view is data, but repeated visits to the same setup step can be a signal. A single feature click is interesting, but repeated use across several accounts is a pattern. Behavior analytics starts when you ask what changed, what repeats, and what that means for the next decision.
Behavior analytics is most useful when you combine event tracking with segmentation to map real user journeys, not just aggregate totals. In practice, you group users by what they do (for example, “completed onboarding” vs “stalled on step 2”) and then compare downstream engagement, conversion, and retention between those cohorts. That’s different from simply counting signups or page views, because the point is to explain why one group progresses and another doesn’t.
How behavior analytics turns events into patterns and anomalies
Behavior analytics works by collecting events, grouping them into baselines, and comparing what is normal with what is unusual. The simplest loop is capture, segment, compare, then act.
Start with events that matter
An event is any meaningful action, such as sign up, invite teammate, connect integration, or reach first value. A baseline is the normal rate for that action over a time window. Once you have both, you can see whether usage is rising, flattening, or breaking at a specific step.
Look for change, not volume
High volume does not always mean progress. A spike in visits can hide a low completion rate, and a drop in one step can matter more than a larger metric elsewhere. Behavior analytics becomes useful when you compare the right cohorts, such as new users versus returning users, or self-serve signups versus sales-assisted accounts.
To make those cohorts reliable, be clear about where behavioral data comes from and how it is joined. SaaS teams often blend product events (in-app), website behavior (pricing, docs, signup), and sometimes CRM/billing/support context when they need revenue or retention insight. Also separate user properties (traits or state like plan, role, seat count, lifecycle stage) from event properties (context like feature_name, integration_type, step_name), and keep stable identifiers like user_id and account_id so one person doesn’t show up as multiple “users” across devices or sessions.
Use anomalies as prompts
An anomaly is simply a pattern that moves away from the baseline enough to deserve attention. A sudden drop in activation events, a repeated exit on one screen, or a segment that stops returning after day 3 can all point to the same root problem: the product is asking for too much effort too early.
The SaaS use cases that matter most, activation, conversion paths, and high-intent signals
Behavior analytics matters most when it helps teams improve activation, find where users lose momentum, and spot high-intent signals early.
Activation
Activation is where behavior analytics pays off fastest because the product can show which first actions predict success. Look for the shortest path to value, then measure how many users complete it within the first session, first day, or first week. If users create an account but never reach the core action, the problem is usually not traffic quality, it is onboarding friction.
Conversion paths
Conversion paths are useful when you want to see where users stop progressing. A step-by-step view can show that the biggest loss happens before the final action, not at the end. That is often where a small fix, like better guidance or fewer required steps, creates the biggest lift.
High-intent signals
High-intent signals are behaviors that suggest a user is moving toward adoption or expansion. Examples include repeated logins, inviting teammates, revisiting pricing or setup pages, and completing multiple core actions in one session. In our work with SaaS teams, those signals are often more useful than firmographic traits because they reflect what the user is actually doing.
Here is what this can look like in a real SaaS workflow: you build a funnel from signup → connect integration → complete first core action, then notice a sharp drop at “connect integration” for one cohort (for example, a specific integration_type or acquisition source). Next, you review sessions or event sequences for those users, spot repeated failures or retries, and ship a targeted fix like clearer copy, a shorter form, or an in-app prompt at the moment they hesitate. Finally, you validate the change by comparing conversion and early retention for the affected cohort before vs after the fix (or via an experiment), instead of assuming the overall average tells the story.
How to start with the right data, metrics, and a simple first framework
Behavior analytics is easiest to start when you choose a small set of events, one success metric, and one audience to study first.
Pick one journey
Start with one journey that matters to growth, such as signup to first value or trial to activated account. Define the start, the finish, and the one or two actions that should happen in between. If the journey is too broad, the data becomes hard to read and harder to act on.
Choose one metric of success
Pick a metric that reflects progress in the product, such as activation rate, feature adoption, or completion of a core setup step. If you cannot explain why the metric matters in one sentence, it is probably too vague for a first framework.
Review the data quality checklist
Before you trust the analysis, do a quick rollout check: confirm your goal and critical path (Signup → Setup → First Value → Invite → Repeat), write a small tracking plan for the journey, and ensure every key event includes the identifiers and properties you need to segment later (at minimum user_id, account_id, plan, and source). Then QA by firing events yourself to verify naming consistency, duplicates, cross-platform consistency (web/app/mobile if relevant), and timestamp accuracy. Those basics are what make funnels, cohorts, and lead scoring trustworthy.
Founder teams often move faster when they use a simple rule: one journey, one metric, one segment, one review cadence. That keeps behavior analytics focused on decisions instead of endless exploration.
Frequently asked questions
If you want to turn behavior signals into product and GTM decisions, Founder OS brings Product Tracking, User Profile Tracking & User Segmentation, GTM Report, and Product Onboarding Tool into one workflow so your team can act on behavior analytics faster.
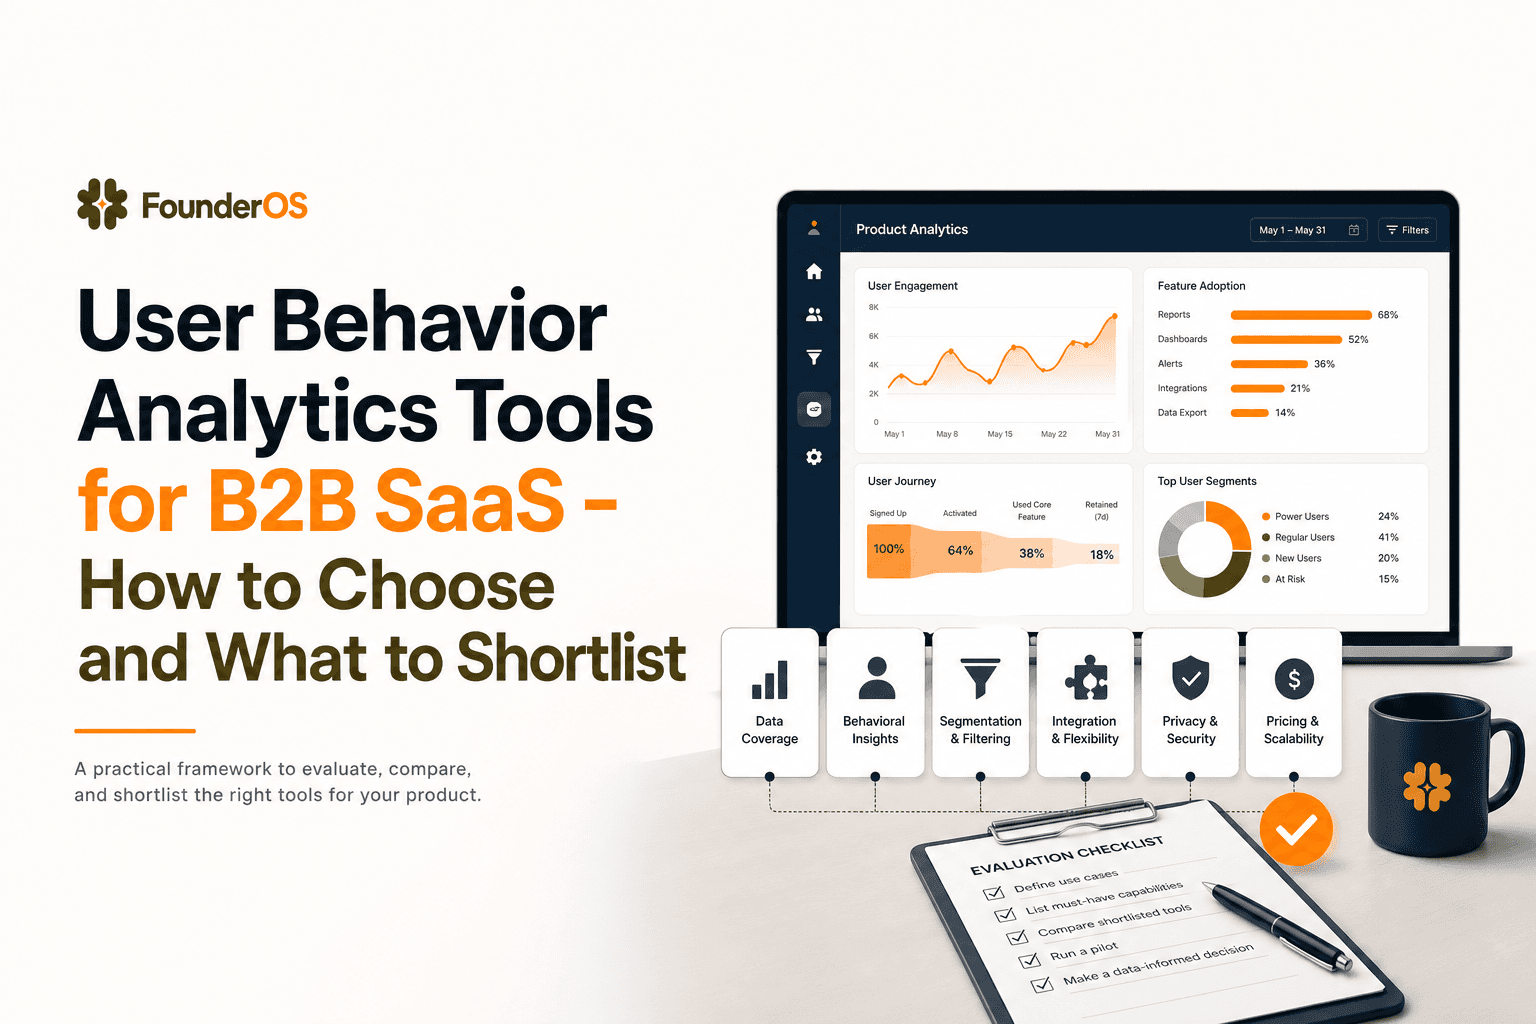
User Behavior Analytics Tools for B2B SaaS - How to Choose and What to Shortlist
Learn how to shortlist user behavior analytics tools for B2B SaaS using criteria tied to activation, funnels, and revenue outcomes.

Analytics Events Tracking for B2B SaaS, A KPI-First Framework
Analytics events tracking for B2B SaaS: map KPIs to events, design clean schemas, pick the right implementation, and build a copy-ready event library.

Conversion Funnels for B2B SaaS, the Setup and Tool Checklist That Prevents Bad Decisions
Build decision-grade conversion funnels for B2B SaaS: event steps, instrumentation rules, segmentation defaults, and a tool checklist.