
How To Optimize Conversion Funnel Performance by Fixing the Biggest Leak First
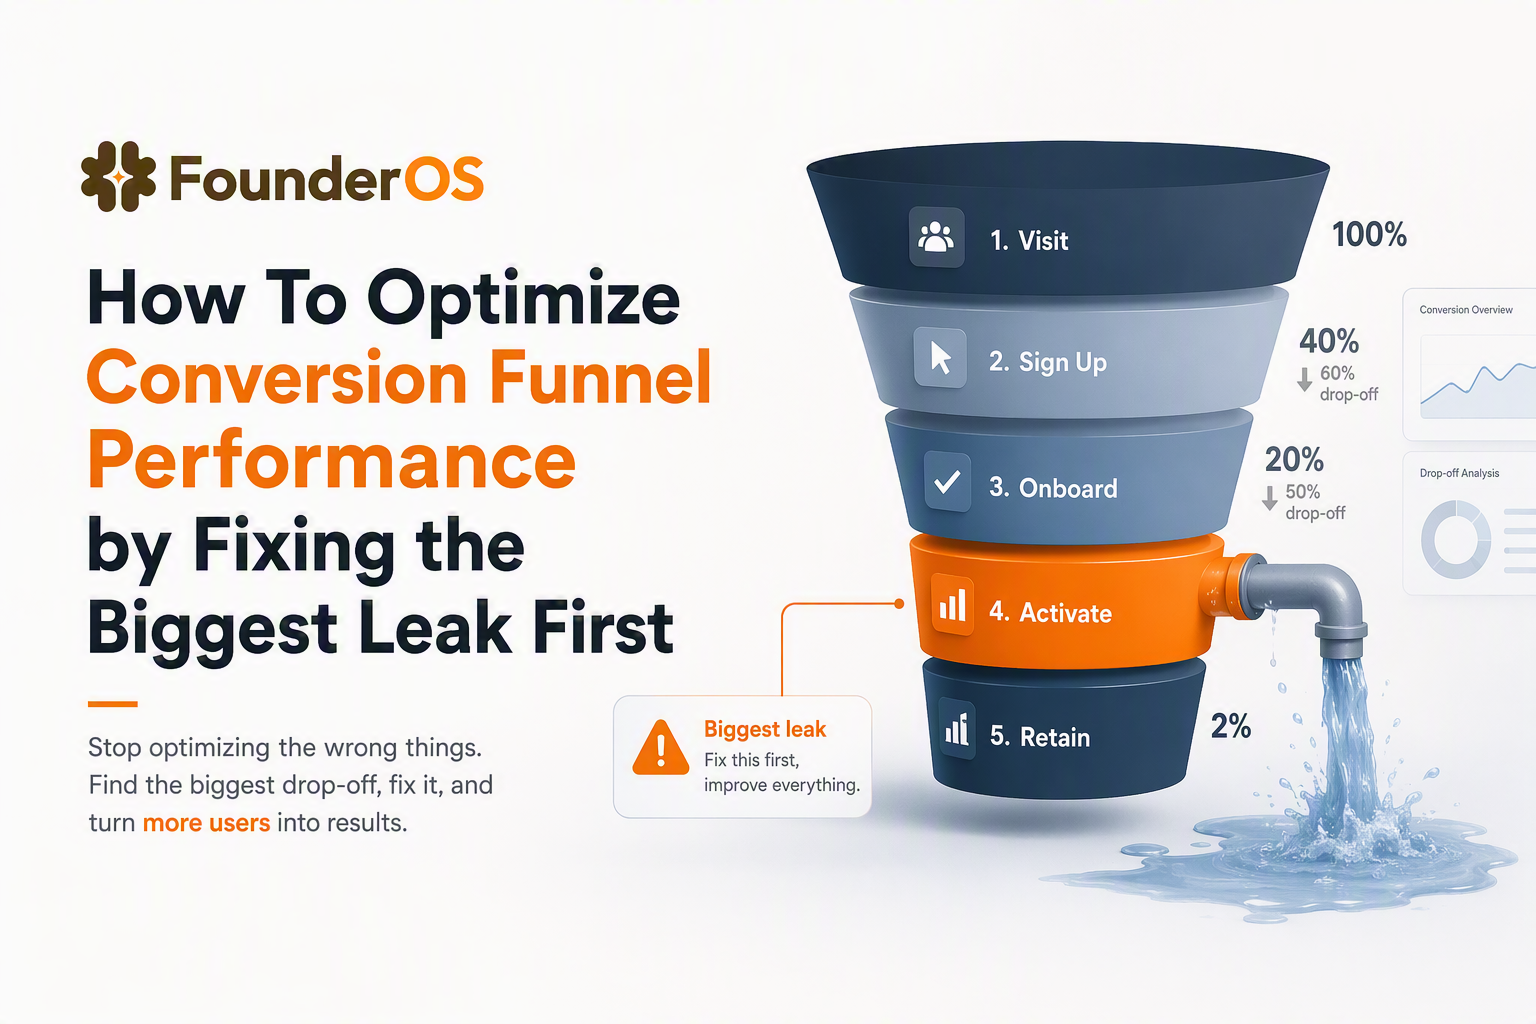
Optimize conversion funnel performance by identifying the single step that is limiting downstream activations and fixing that step before touching anything else. The fastest teams do this by mapping the few steps that matter, checking whether each step is actually weak versus realistic benchmarks, and then prioritizing fixes based on impact you can model in dollars.
- Measure step-to-step conversion (not just end conversion) so the biggest leak is visible and attributable.
- Use benchmark ranges as a sanity check, then prioritize leaks with a scorecard that combines severity, volume, and effort.
- Prove lift with simple funnel math before and after the change so you can tie optimization work to revenue impact.
Map the stages you actually need to measure
Optimize conversion funnel work starts with a short, SaaS-specific map of only the user actions that create momentum, because measuring everything usually hides the real constraint. A practical map should let you answer one question per step: “If we fix this step, do we reliably get more activated users, or are we just moving clicks around?”
Use a “minimum viable journey” map, not a full customer journey map
For most B2B SaaS products with a free trial or freemium motion, the minimum viable journey typically looks like this:
- Visit → Signup started → Signup completed
- Email verified (if required)
- First session started
- Activation event completed (your “aha” behavior)
- Second key action (often the first repeat value moment)
Keep each step behavioral and observable. “Understood value” is not a step, but “created first project” or “connected data source” can be.
Separate overall conversion from step conversion
Overall conversion (e.g., visit → activated) is useful for executive reporting but it is a blunt instrument for improvement work. Step conversion isolates where momentum breaks:
- Step conversion = users who complete step N+1 / users who reached step N
- Drop-off = 1 - step conversion
In practice, step conversion is what you optimize; overall conversion improves as a downstream effect.
Define each step with an event rule you can defend
Each step should be tied to a single event (or a small rule like “event A OR event B”), with a time window that matches how users behave. For example, if “Activation” is defined as “created first workspace,” decide whether you count it within the first session, first day, or first week. Time windows matter because they change what is actually a product issue versus a lifecycle issue.
Use benchmarks to tell if your funnel is truly weak
Benchmarks should be used as guardrails to avoid fixing the wrong thing, because a “bad” conversion rate is sometimes normal for your acquisition mix or device split. The goal is not to chase an industry average; the goal is to confirm which step is underperforming enough that improvement work is justified.
Benchmark ranges you can use as a sanity check
Because benchmark data varies heavily by product category and traffic quality, treat the ranges below as a starting point for investigation, not a target you must hit:
- Visit → signup started: high intent pages often outperform broad content landers; expect wide variance.
- Signup started → signup completed: tends to be more stable within a product; major drops usually point to friction (fields, errors, trust gaps).
- Signup completed → first session: sensitive to email verification, SSO options, and immediate redirect behavior.
- First session → activation event: typically the biggest spread, driven by onboarding clarity, product complexity, and time to value.
If you want hard numbers, use your own historical baselines as the first benchmark. Compare the last 28 days to the prior 28 days, then compare by channel and device. That keeps the comparison honest.
Adjust expectations by channel, device, and traffic quality
A signup form completion rate that looks “low” overall can be perfectly fine if half your traffic is mobile and coming from low intent sources. A quick way to normalize is to always review step conversion across three cuts:
- Channel grouping: paid search, organic search, direct, partners, outbound.
- Device: desktop vs mobile (and in some products, in-app webviews).
- New vs returning: returning visitors often convert at a meaningfully higher rate.
What surprised our team was how often a “site-wide” conversion problem turned out to be a single channel cohort with broken message match. Fixing that cohort improved overall numbers without touching the rest of the experience.
Use “constraint tests” to avoid false positives
Before labeling a step as weak, run one of these quick checks:
- Stability check: does the step conversion hold week to week, or is it noisy from low volume?
- Instrumentation check: are you missing events due to ad blockers, single-page app routing, or misfired tracking?
- Eligibility check: are all users supposed to reach this step, or does product logic filter them out?
If a step looks weak but fails one of these checks, fix measurement before you optimize.
Rank leaks by severity, volume, and effort
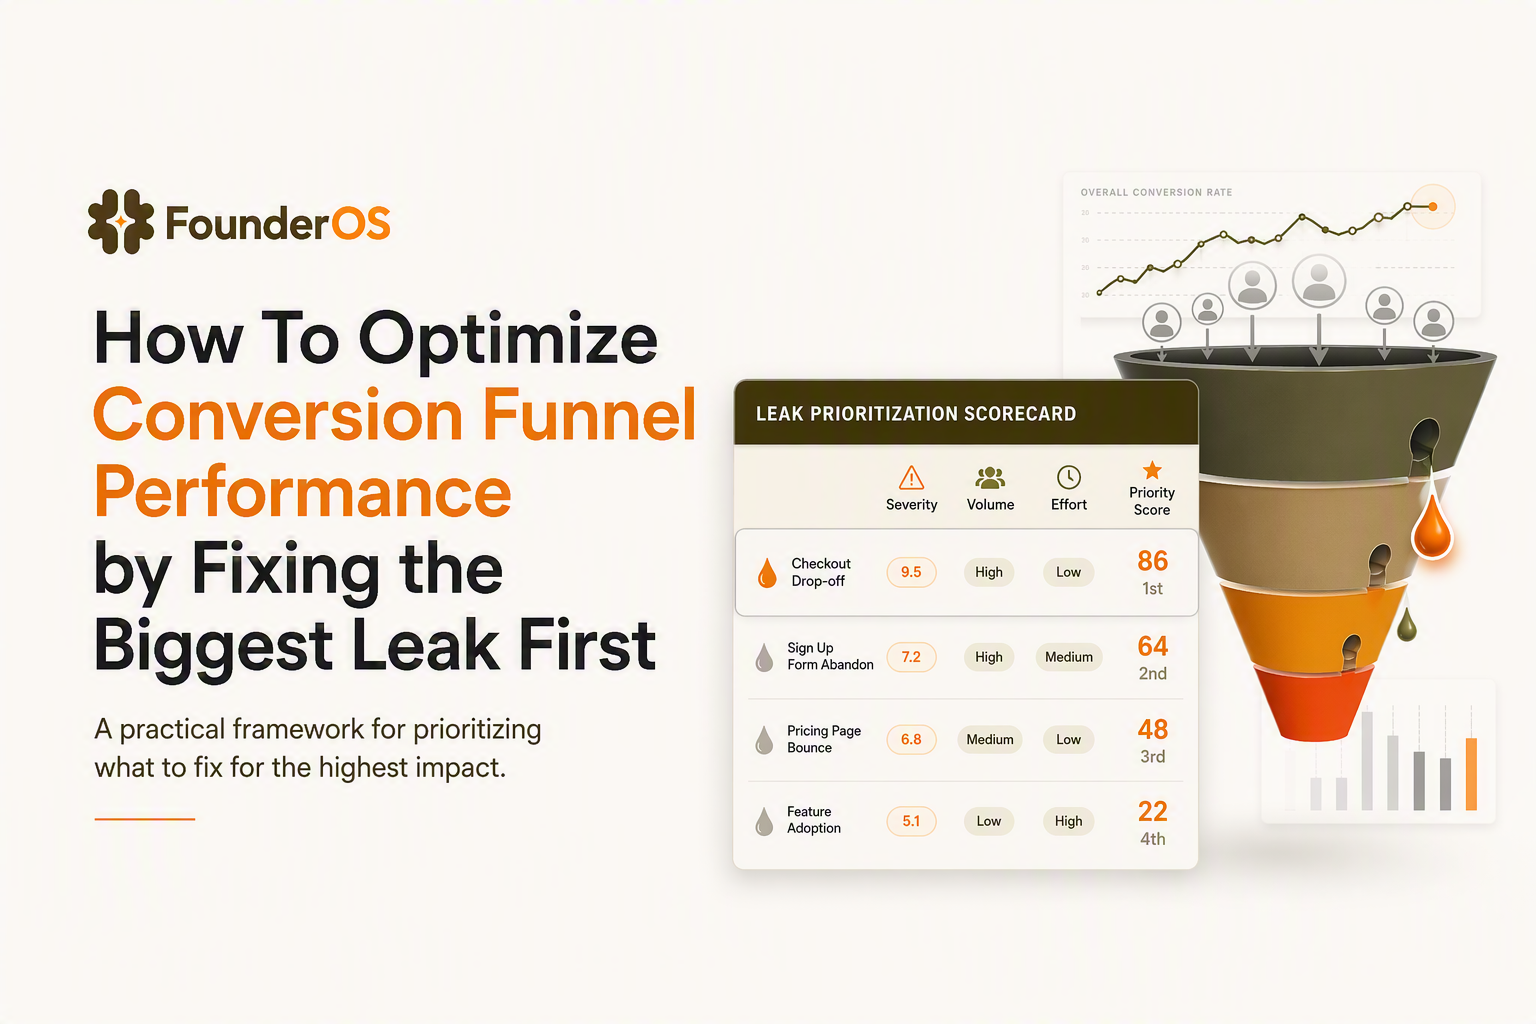
Optimize conversion funnel priorities become obvious when every leak gets a score that combines how bad the drop-off is, how many users it affects, and how hard it is to change. This prevents teams from spending weeks polishing a page that only a small fraction of users ever see.
A leak scorecard you can run in 15 minutes
Create a simple table and score each candidate step from 1 to 5 on three dimensions:
- Severity: how large is the drop-off relative to your own baseline or to your strongest cohort?
- Volume: how many users reach the step per week?
- Effort: engineering + design + review + risk (higher effort should reduce priority).
Then compute:
- Leak Priority Score = (Severity × Volume) / Effort
How to score severity without inventing a benchmark
Severity works best when it is anchored to what you already know you can achieve. Two practical anchors:
- Best cohort anchor: compare the step conversion of your “best” cohort (often branded search or returning users) to the overall. The gap is the opportunity.
- Historical anchor: if the same step used to convert better, the difference is likely fixable.
After running a few dozen audits, the pattern was clear: the “best cohort anchor” is usually more actionable than industry averages because it points to a message match or UX issue rather than a fundamental product complexity issue.
Effort should include operational drag, not just coding time
Effort is where prioritization often breaks. Include:
- Time to design and ship
- Risk of breaking onboarding or billing flows
- Time to get statistically useful read (if you plan to test)
- Dependency on pricing, legal, or security review (common in enterprise-facing SaaS)
Walk through one end-to-end funnel math example
Optimize conversion funnel decisions get easier when you can model how a step improvement translates into activated users and revenue, even with rough assumptions. You do not need perfect LTV math to pick the right leak; you need directional clarity about which step dominates the outcome.
Start with step counts, not percentages
Assume a weekly pipeline like this:
- 10,000 visits
- 900 signup starts (9.0%)
- 600 signup completions (66.7% of starts)
- 420 first sessions (70.0% of signups)
- 105 activations (25.0% of first sessions)
Overall visit → activation is 1.05%, but the largest absolute loss after signup is first session → activation: 315 users per week reach the product but do not hit the activation event.
Model two different fixes and compare impact
Fix A: Improve signup completion from 66.7% to 75.0% (an 8.3 point lift). New activations:
- Signup starts: 900
- Signup completions: 675
- First sessions (70%): 472.5
- Activations (25%): 118.1
That is about +13 activations/week.
Fix B: Improve first session → activation from 25.0% to 32.0% (a 7 point lift). New activations:
- First sessions: 420
- Activations: 134.4
That is about +29 activations/week, more than 2x Fix A, without any acquisition change.
Translate activation lift into revenue with a simple, defensible model
Pick one monetization proxy you can defend internally, such as “percentage of activated users who become paying within 30 days” and “average first-month revenue.” If 12% of activated users convert to paid in 30 days and first-month revenue averages $120, then Fix B yields:
- 29 extra activations/week × 12% = 3.48 extra new customers/week
- 3.48 × $120 = $417.60 extra first-month revenue/week
This math will be imperfect, but it creates a consistent decision rule. We initially assumed signup completion was the main bottleneck in one product because the page looked dated, but the model showed activation was the constraint by a wide margin, and the results followed the constraint, not the aesthetics.
Fix landing pages, CTAs, and forms only after the biggest leak is clear
Landing pages and forms are worth optimizing only after you can show they sit on the constrained step, because otherwise you risk local improvements that do not move activation. Once you have a confirmed leak, page-level work becomes straightforward: remove friction that blocks the next committed action.
Use a “next committed action” checklist
For the page that sits immediately before the leaking step, audit it with this checklist:
- Single primary action: one dominant CTA aligned to the next step you are measuring.
- Message match: headline and first screen repeat the promise of the ad, email, or referral source.
- Objection coverage: address the top 2 objections with proof elements (security page, pricing clarity, integration logos, short demo clip).
- Friction removal: remove non-essential fields, reduce password rules friction, offer SSO if relevant.
- Error and recovery: make validation messages specific; preserve entered data on failure.
Prioritize form changes by “field value”
Instead of removing fields blindly, label each field as one of three types:
- Required for account creation (email, password, workspace name)
- Required for product experience (team size might change in-app setup)
- Only for sales qualification (phone number, budget)
Fields that are only for qualification should be deferred until after users have experienced value, unless your business model truly requires pre-qualification.
Write CTAs to reduce decision cost
In B2B SaaS, CTA copy often performs better when it describes the immediate outcome rather than the generic action. “Create workspace” can outperform “Get started” when that is the real step you need users to take next.
Track behavior by segment before you launch any A/B test
Segmentation prevents wasted experiments by showing which users are actually leaking and why, so you can target fixes instead of averaging everyone together. If you only look at aggregate conversion, you can ship a “winning” test that helps one cohort and hurts another, then wonder why retention did not improve.
Segment by what users did, not what they said
Start with behavioral segments tied to the journey steps:
- Fast activators: activation within first session or first day
- Slow activators: activation in days 2 to 7
- Stalled: reached the product but never hit activation
- Bounced signups: completed signup but never started a session
Then compare what each segment does immediately before drop-off. This is where tools and reporting matter: you need event-level visibility and the ability to drill into real user paths. If you want a practical framework for defining what to track, analytics events tracking done KPI-first reduces rework when your funnel definition changes.
Choose tests that change a mechanism, not just a layout
Before you run an experiment, write down the mechanism in one sentence: “This change should increase activation because it reduces time spent searching for the first action.” If you cannot state a mechanism, you are likely doing cosmetic CRO.
One body mention of Founder OS as an implementation option
Teams that need to instrument this quickly often use a single platform to capture events, tie them to user profiles, and build segments that update as users act; Founder OS is one option that combines product tracking, user segmentation, and clear step drop-off views so you can see whether a change actually moved the constrained step.
Use an audit checklist to turn insights into weekly tests
A weekly workflow is the difference between one-time reporting and sustained optimize conversion funnel gains, because most meaningful improvements come from a sequence of small fixes validated over time. Treat your funnel like an operational metric: review, diagnose, ship, verify, and document.
A reusable weekly worksheet
- 1) Pick one constrained step: the step with highest Leak Priority Score this week.
- 2) Pull three cuts: channel, device, new vs returning.
- 3) Identify the dominant failure mode: errors, timeouts, confusion, missing guidance, trust gaps.
- 4) Draft one hypothesis + one mechanism: what changes, and why it should increase the next step completion.
- 5) Define success: step conversion lift, guardrails (support tickets, cancellation, latency), and timeframe.
- 6) Ship smallest viable change: reduce scope to what can be verified within your traffic constraints.
- 7) Verify with pre-post math: compare to prior period and to an unaffected cohort when possible.
Documentation that prevents repeating the same experiment
Keep a simple log with: date shipped, segment targeted, step impacted, expected mechanism, and observed lift. Over time you will build your own internal benchmarks that outperform generic “best practices.” For teams that want a deeper diagnostic structure, these playbooks help: funnel analysis and conversion funnel analysis.
| Artifact | What it contains | Why it matters |
|---|---|---|
| Funnel map | 5 to 7 behavioral steps with event definitions and time windows | Prevents debate about what “counts” and makes step conversion comparable over time |
| Leak scorecard | Severity, Volume, Effort scores and Priority Score | Keeps the team focused on the biggest constraint, not the loudest opinion |
| Experiment log | Hypothesis, mechanism, segments, pre-post results, guardrails | Builds institutional memory and improves your ability to forecast impact |
FAQ
If you want to operationalize this optimize conversion funnel workflow with clean event capture, user-level drilldowns, and behavioral segments that update automatically, Founder OS can help you instrument the journey, monitor step drop-offs, and verify lift after each weekly change. Start free or book a demo to see whether it fits your activation and growth workflow.

How To Build a Cohort Retention Chart From Raw SaaS Event Data
Learn how to build a cohort retention chart from raw SaaS events, validate the data, interpret drop-offs, and turn retention insights into product actions.
Product Adoption Tools for B2B SaaS, The 5-Step Toolkit and 30-60-90 Day Rollout Plan
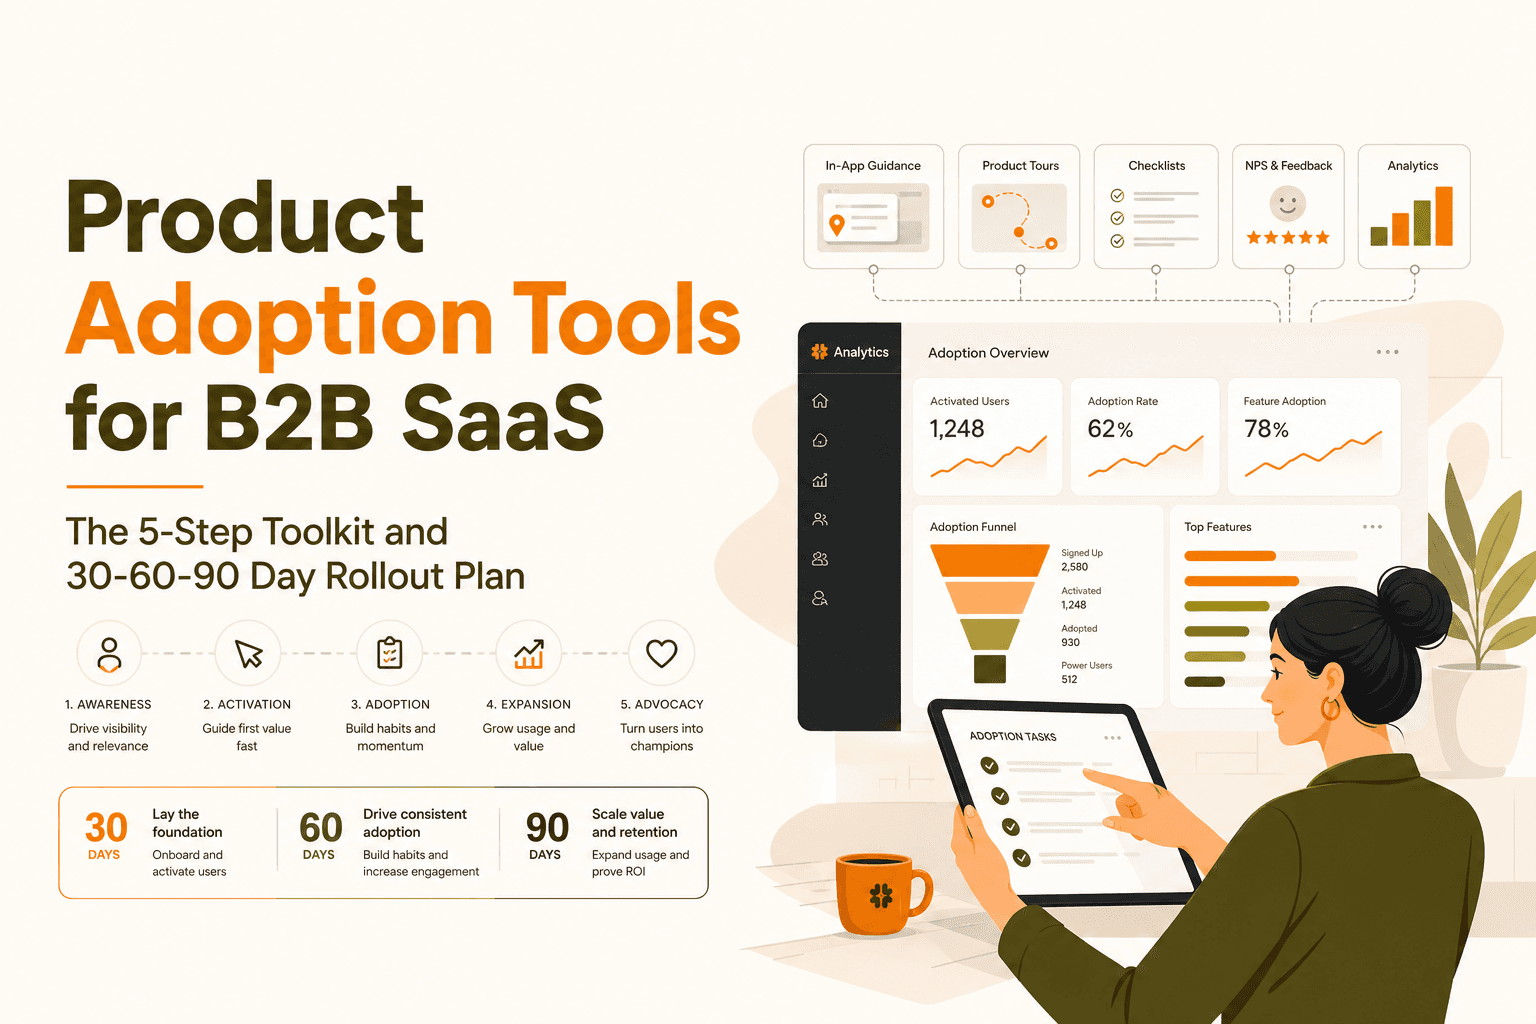
A decision-ready guide to product adoption tools for B2B SaaS, plus a practical 30-60-90 day rollout plan tied to activation and retention.
Onboarding Plan for B2B SaaS, A Simple Activation-First Framework
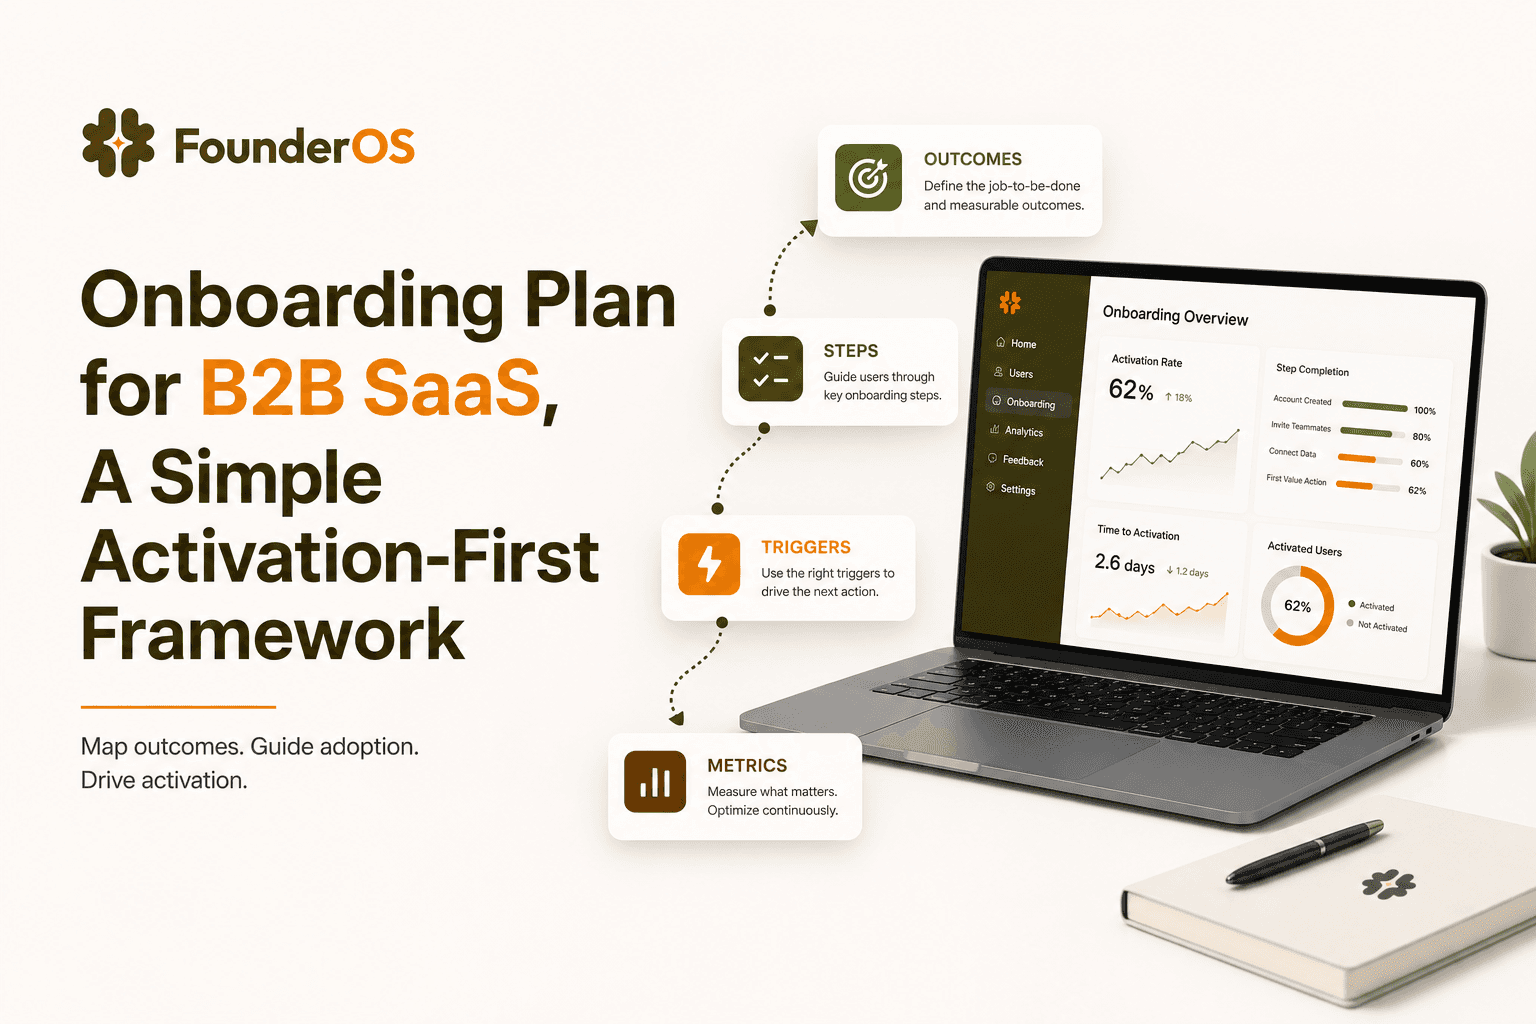
Learn a simple onboarding plan framework to reach the first aha moment faster with no-code in-app flows, triggers, and measurement.