
Activation metrics that actually predict B2B SaaS revenue
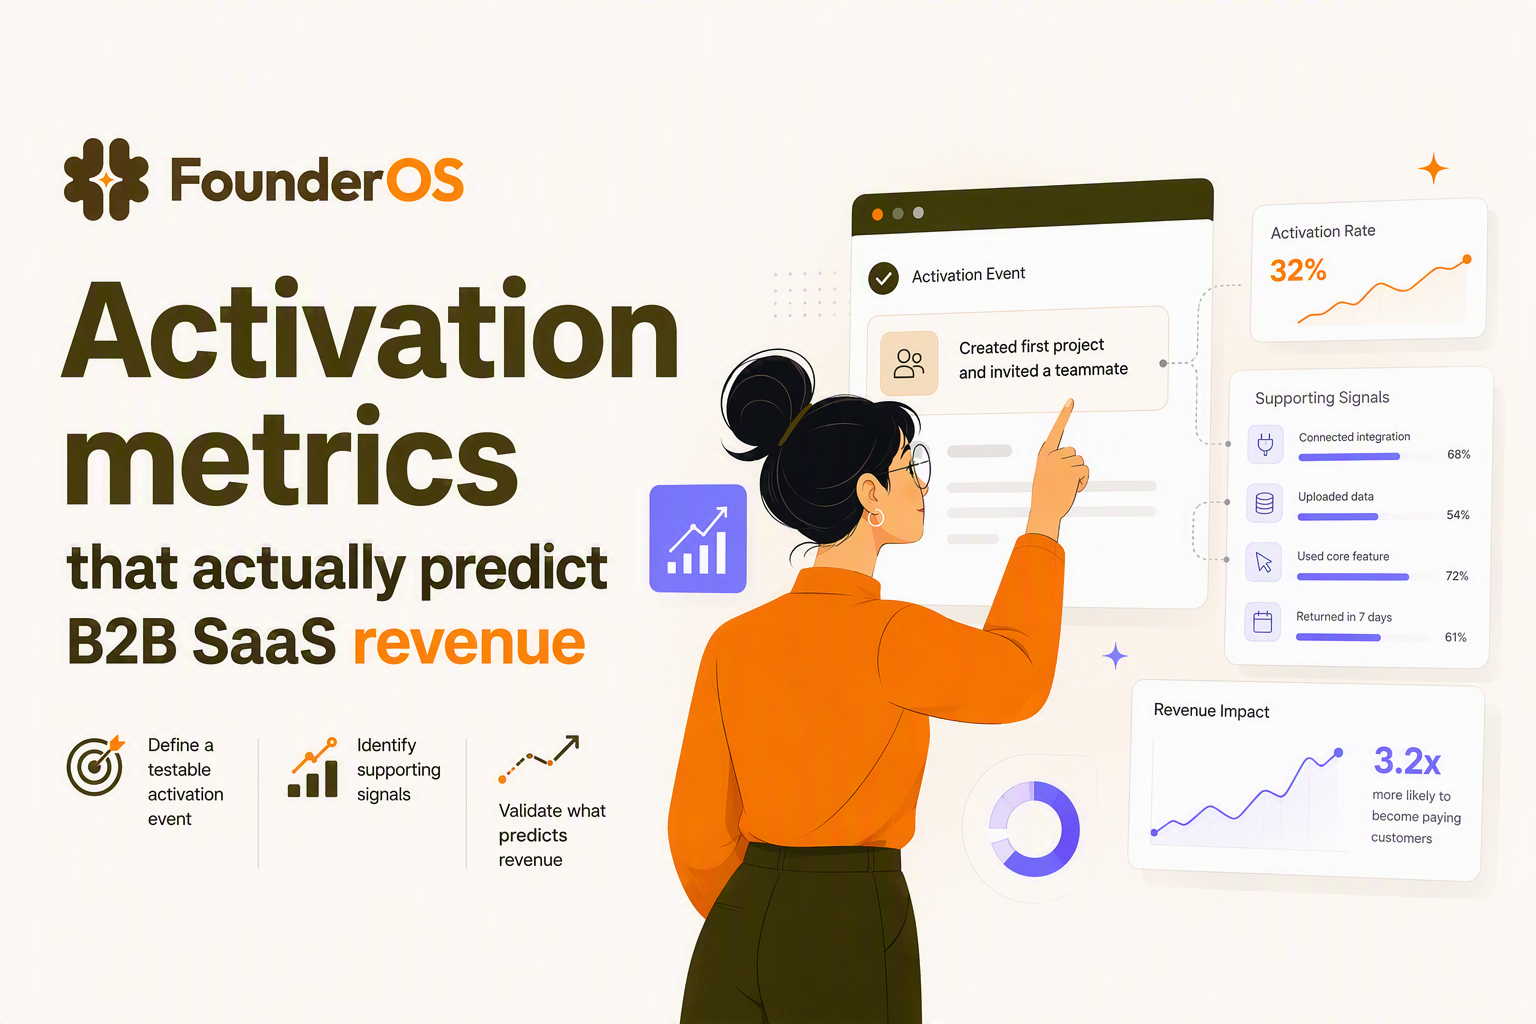
Activation metrics are the specific, behavior-based measurements that prove a new user has reached meaningful value in your product, and they are the fastest way to forecast retention and revenue without waiting months for churn data.
- Define activation as a testable user behavior with one primary activation event plus 2 to 4 quality signals.
- Use activation metrics across rate, speed, and depth, then diagnose drop-offs with a single activation funnel.
- Improve activation by fixing one bottleneck at a time and validating impact with cohort comparisons.
Activation metrics only work when your activation definition is testable
Activation metrics become misleading when “activated” is vague, because teams can move numbers without moving user value.
Define a single primary value moment, then add quality checks
A reliable activation definition has two layers:
- Primary activation event (binary): the one behavior you treat as activated.
- Supporting activation signals (quality): 2 to 4 behaviors that confirm the activation was real and repeatable.
Value-moment checklist for choosing the primary event
- User-controlled: the user intentionally triggers it, not an automatic system action.
- Value-linked: it produces an output the user came for (export, report, first workflow run, teammate collaboration).
- Repeatable: users who do it once are likely to do it again within 7 to 14 days.
- Fast-path eligible: a motivated user can reach it in one session.
- Instrumentable: the event can be logged with a clear name and properties.
Examples you can copy (primary event plus signals)
| Category | Primary activation event | Supporting signals (2 to 4) |
|---|---|---|
| Reporting / analytics | Dashboard created and viewed | Data source connected, at least 3 events received, segment applied |
| Collaboration | Teammate invited and active | 2+ messages/posts, file shared, notifications enabled |
| Workflow automation | First automation run succeeds | Trigger configured, action connected, second run within 7 days |
Activation is often not one click. In many B2B products, it’s either (1) a bundle of 3 to 5 setup + usage events completed inside a window (e.g., “connected data source” + “created first report” + “shared/exported”), or (2) a threshold of repeat actions (e.g., “ran the core workflow 3 times” or “analyzed 5 items”) that proves the user can reliably reproduce value. If you stick with a single primary event, make the threshold explicit (minimum count, or “completed within X days”) so your activation metric can’t be gamed by partial or accidental actions.
The activation metrics that predict growth fit into rate, speed, and depth
Activation metrics are most actionable when they cover how many users activate, how quickly they get value, and how solid that activation is.
Rate metrics (did they activate?)
- Activation rate: percent of new users who complete the primary activation event inside a defined window (commonly 1, 3, 7, or 14 days depending on product complexity). Learn the formula and pitfalls in activation rate.
- Activation by cohort: activation rate split by acquisition channel, persona, plan, or firmographic segment (for B2B, company size is often decisive).
- Activation-to-paid rate (if applicable): percent of activated accounts that convert to paid, which helps you confirm activation is truly value-bearing.
Speed metrics (how fast did they get value?)
- Time to first value (TTV): time from signup to primary activation event. Use the framework in time to value.
- Time between key steps: median time from signup to “setup completed,” then from setup to primary value moment. This pinpoints whether your bottleneck is onboarding or product experience.
Depth metrics (was the activation meaningful?)
- Activation quality score: a simple points-based score from your supporting signals (for example, +1 for each supporting event completed in the window).
- Early feature adoption: percent of activators who use the core feature again within 7 days.
- Team expansion signal (B2B): number of distinct users active in the same account within 14 days, if collaboration is part of value.
When you pressure-test activation definitions against downstream outcomes, speed usually matters because it reflects friction and intent. A practical way to use this insight is to compare retention for users who activate fast versus those who activate late (within the same window): if “late activators” look much closer to non-activators than to fast activators, your real activation definition likely needs either a tighter window or a stronger depth/quality threshold. That’s how you avoid celebrating higher activation rate while quietly enrolling users who never reach durable value.
Diagnose activation with one funnel and one drop-off playbook
Activation metrics become actionable when you map them to a single activation funnel that shows where momentum breaks.
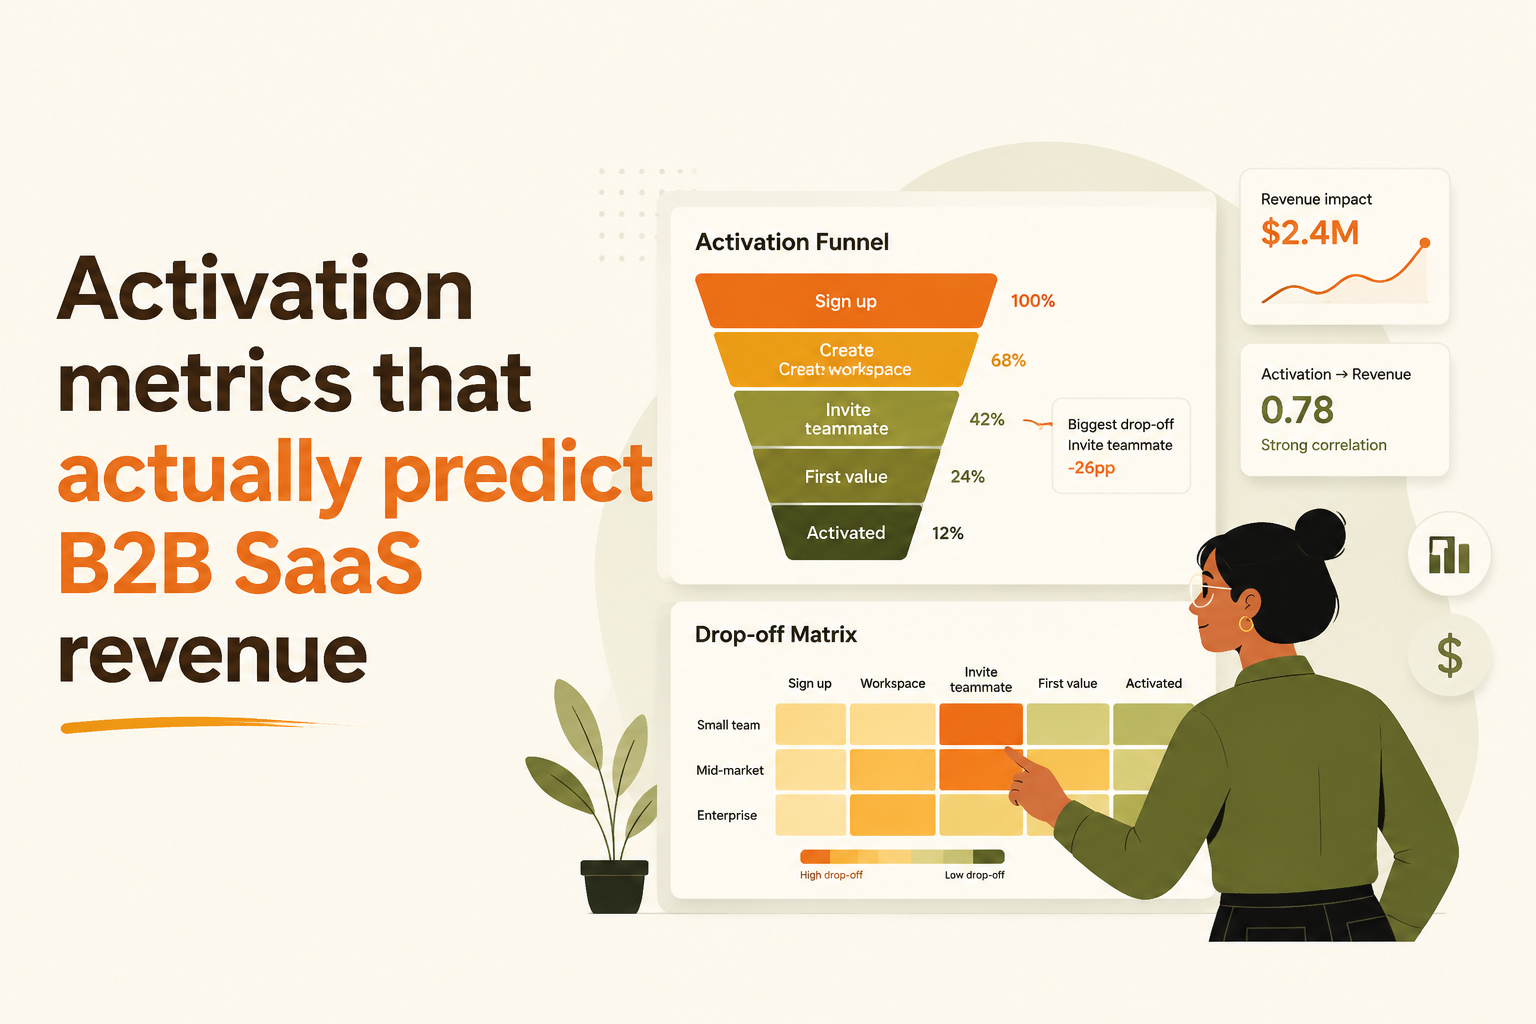
Step 1: Build the activation funnel in 5 events
Keep the funnel short enough to act on weekly. A common pattern for B2B SaaS:
- Signup created
- Workspace or account created
- Setup completed (connected data, created first object, imported list, etc.)
- Primary activation event (value moment)
- Return event (comes back or repeats core action within 7 days)
Step 2: Use a drop-off matrix to decide what to fix first
For each step-to-step drop-off, choose the fix based on what users are missing:
| Drop-off pattern | Likely cause | Best fix | What to measure next |
|---|---|---|---|
| Signup to workspace creation | Low intent or confusing first screen | Clarify promise, reduce fields | Activation rate by channel |
| Workspace to setup completed | Setup friction or unclear instructions | Shorten setup, prefill defaults, guided steps | Median time to setup completion |
| Setup completed to value moment | User cannot see the “so what” | Show example output, templates, sample data | TTV to primary activation event |
| Value moment to return | Value is not durable or not habitual | Follow-up nudges, reminders, habit loops | 7-day repeat usage among activators |
Step 3: Segment the funnel by intent, not just demographics
Two users can have the same title and company size but different intent. Segment by behaviors like “visited pricing,” “invited teammate,” “imported data,” or “created first project,” then compare funnels side by side. This is where clean analytics events tracking pays off, because unclear event naming or missing properties makes segmentation impossible.
Improve activation metrics with a 4-step activation loop you can run every two weeks
Activation metrics improve fastest when you iterate through a repeatable loop: instrument, reduce friction, guide, then validate with cohorts.
1) Instrument the minimum events and properties
Track only what you need to answer “who activated, how, and why not.” Minimum set:
- Core events: each funnel step plus the primary activation event and return event.
- Essential properties: plan, acquisition source, persona proxy (role/use case), and any configuration that changes time-to-value (integration type, template used).
2) Reduce friction on the critical path
Make the path to the value moment shorter by removing steps, delaying non-essential choices, and adding sensible defaults. A practical rule: anything that does not change the first output should be optional until after activation.
3) Guide users based on what they have not done yet
Guidance should be conditional and event-driven: show the next best action only when the previous step is complete, and skip users who already finished. Many teams implement this by tying in-app prompts to the exact point of drop-off, which is why pairing user onboarding flow changes with measurement is crucial.
4) Validate with cohort comparisons, not “before and after” snapshots
Compare cohorts exposed to a change versus those who were not, and always check both speed and quality. If activation rate rises but return behavior falls, you likely made activation easier to “click through” without increasing value.
To pick an activation metric that actually predicts retention, run a lightweight correlation test before you optimize anything. Start with 5 to 10 candidate definitions (single event, multi-event bundle, or a repeat-count threshold), pick one activation window that matches your lifecycle (often 14 or 30 days for B2B), and then compare a fixed-horizon retention rate (for example, 90-day retention) for activated users/accounts versus baseline. The definition that shows the clearest retention lift with enough sample size is the one worth operationalizing—everything else is a vanity activation metric that can move without changing revenue outcomes.
| Metric | What it answers | How to use it weekly |
|---|---|---|
| Activation rate (windowed) | Are more users reaching value? | Monitor overall and by channel, then pick the worst cohort |
| Median time to value moment | Is the path getting faster? | Track by segment, focus on the longest median cohort |
| Activation quality score | Is activation meaningful? | Watch for “hollow” gains where rate rises but quality drops |
| 7-day repeat usage among activators | Does value stick? | Use as a guardrail metric for onboarding experiments |
FAQ
If you want to operationalize activation metrics quickly, Founder OS can help you capture user behavior, build funnels and segments, and tie onboarding prompts to real drop-offs so you can improve activation with measurable iterations instead of guesswork.

Onboarding Flow Examples You Can Copy, A Pattern Library Plus Measurement Checklist
Copy these onboarding flow examples with a pattern taxonomy, sequencing playbook, and measurement checklist to improve time-to-value and activation.
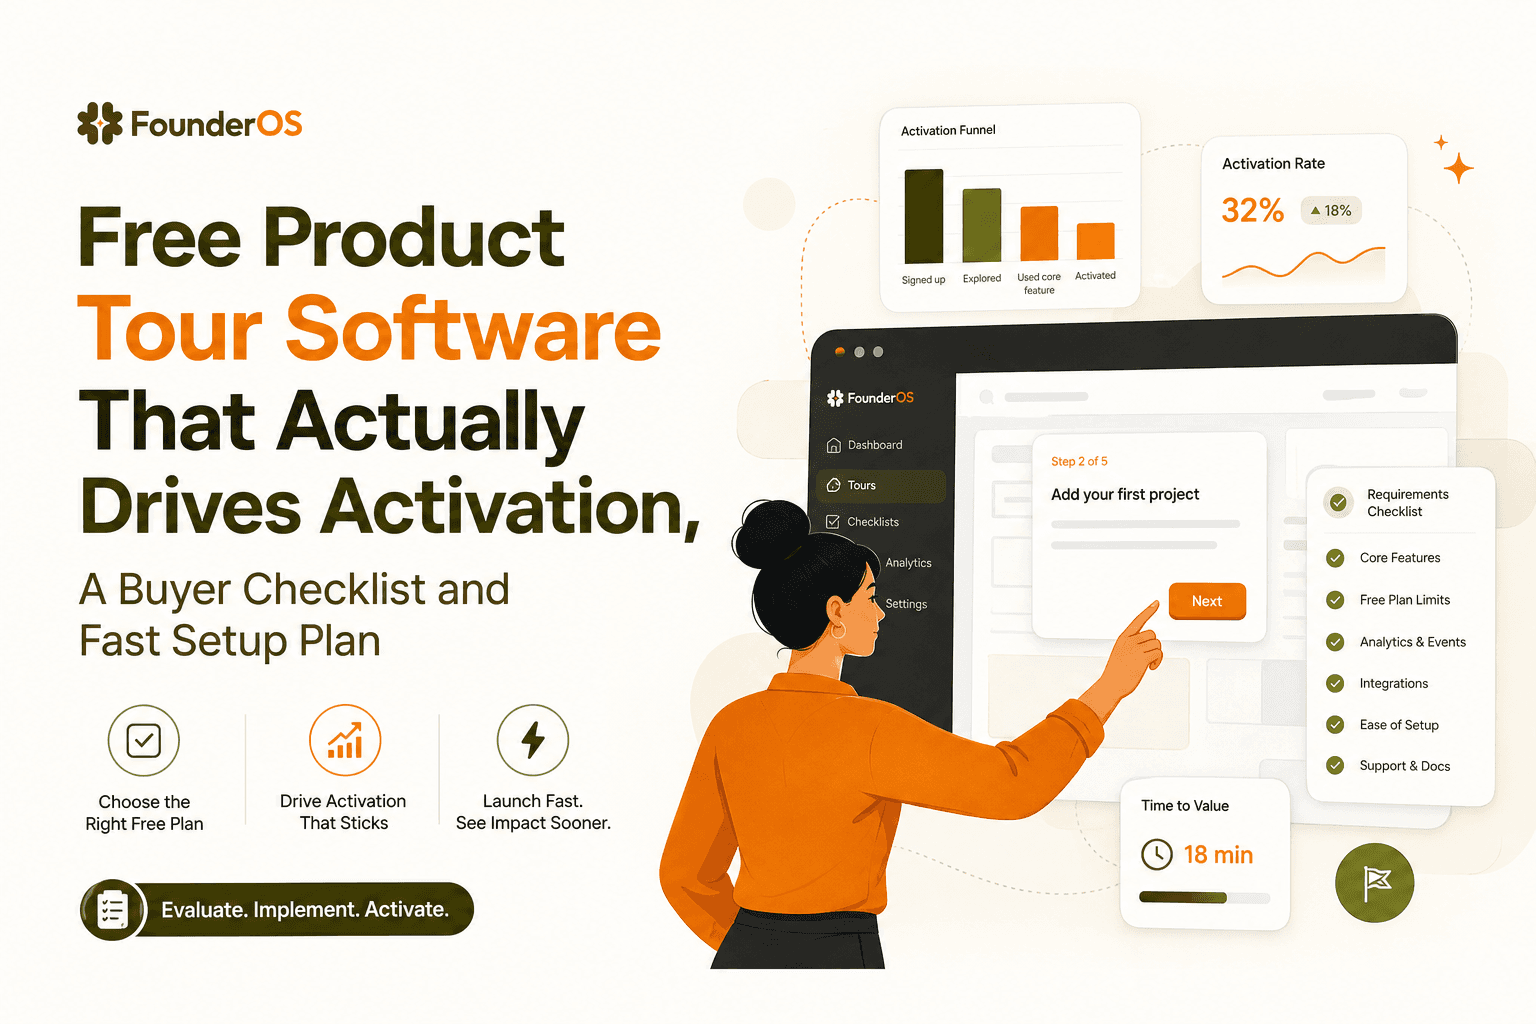
Free Product Tour Software That Actually Drives Activation, A Buyer Checklist and Fast Setup Plan
Choose free product tour software that boosts activation. Use this checklist to avoid free-plan traps and launch a measurable tour in 60 minutes.
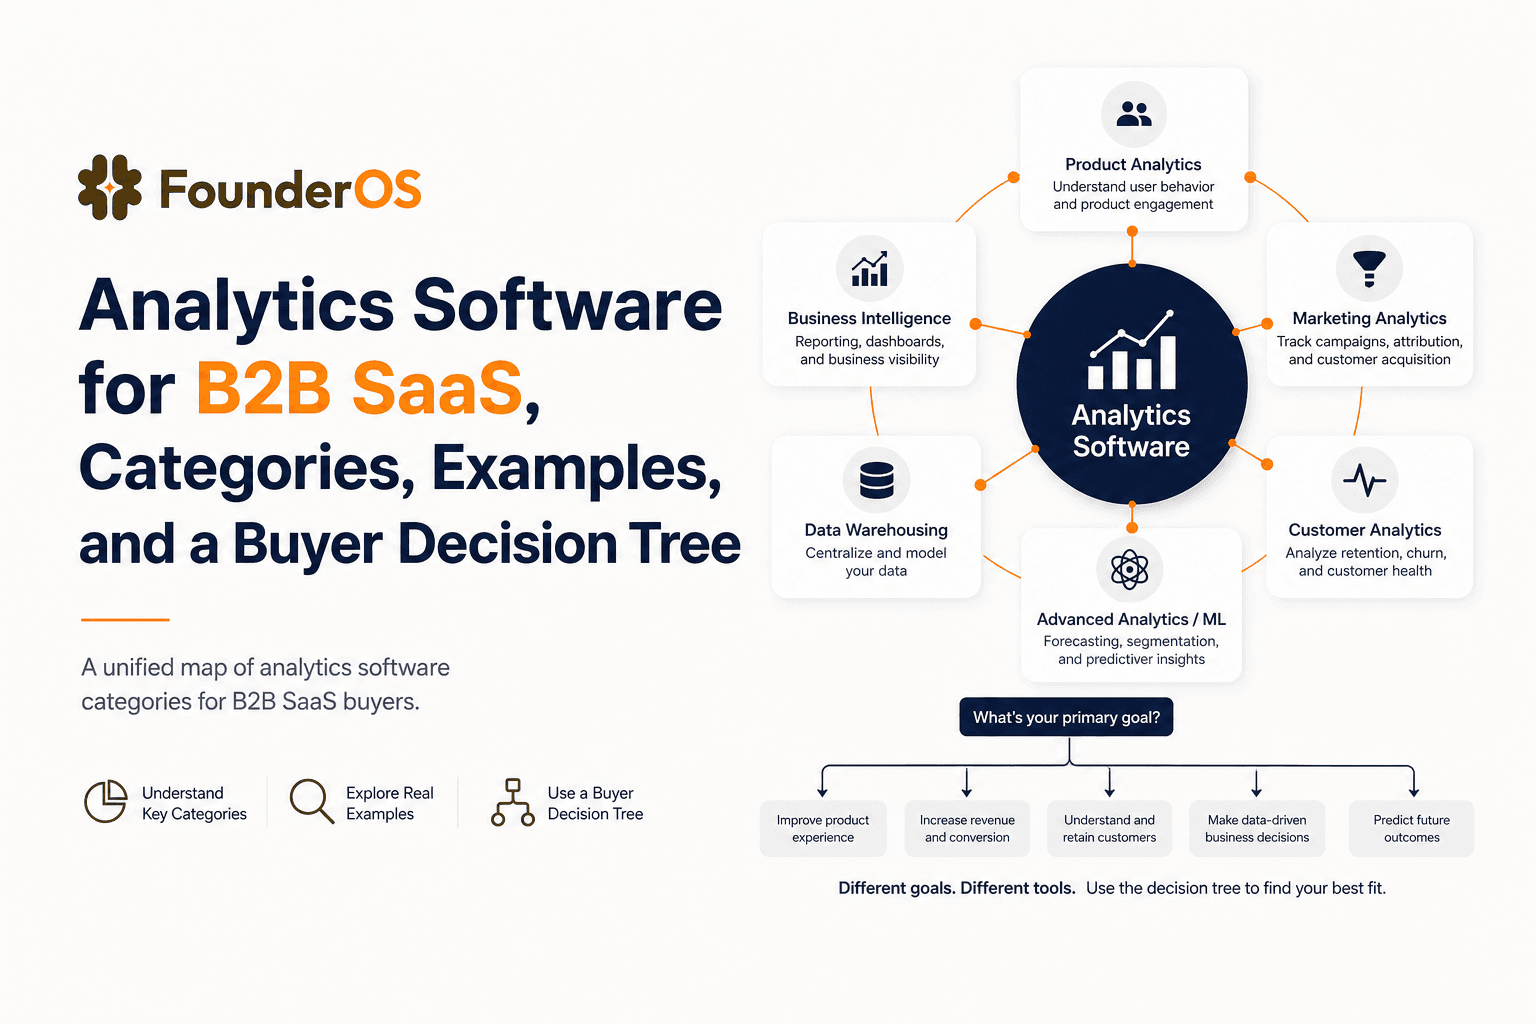
Analytics Software for B2B SaaS, Categories, Examples, and a Buyer Decision Tree
Choose analytics software for B2B SaaS with a clear category map, 10-minute decision tree, real workflows, and a practical buyer checklist.