
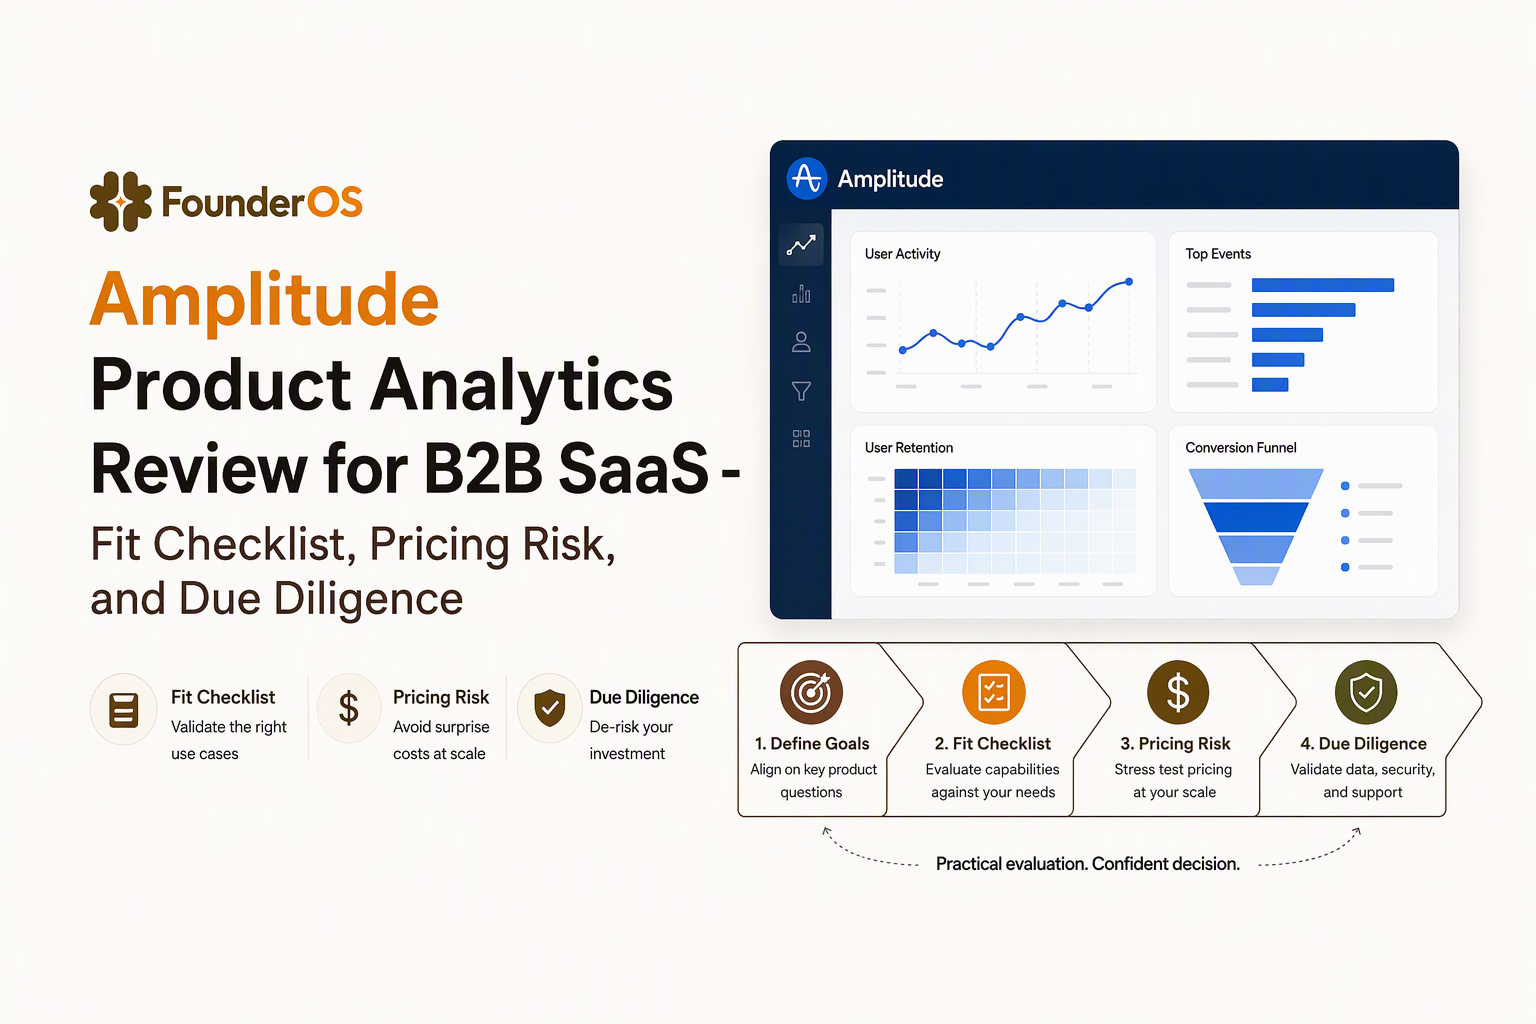
Amplitude Product Analytics Review for B2B SaaS - Fit Checklist, Pricing Risk, and Due Diligence
Amplitude product analytics review for B2B SaaS: 30-minute fit checklist, pricing risk tests, vendor due diligence, and BI stack guidance.

Amplitude product analytics is a widely used product analytics platform for event-based tracking, funnels, retention, and behavioral analysis, and this review gives B2B SaaS teams a practical way to validate fit, pricing risk, and vendor safety before committing.
- Use a 30-minute checklist to verify instrumentation readiness, governance needs, and operational workflow fit before you trial.
- Pricing risk is usually driven by event volume and monthly tracked users, so model your economics from real event counts, not assumptions.
- Due diligence should include security/compliance evidence plus a hands-on trial that proves identity resolution, permissions, and data quality.
What Amplitude Product Analytics is best at and where teams get surprised
Amplitude product analytics tends to be a strong fit when you need consistent event instrumentation, reliable funnel and retention analysis, and governance that scales beyond a single PM or founder.
Best-fit scenarios (use cases and team maturity)
- Multi-step activation and adoption: You need to understand a journey like Signup → Invite teammate → Connect integration → First value action, and you want to slice it by plan, channel, role, and lifecycle stage.
- Multiple personas and workspaces: B2B SaaS often needs both user-level and account/workspace-level reporting; the fit improves when your team can clearly define identity rules.
- Cross-functional analytics operations: If PM, Growth, CS, and Marketing all need access with different permissions, governance and standardized definitions become more valuable.
Common surprises (failure modes to watch for)
- Instrumentation drag: Event naming, property hygiene, and identity stitching can take longer than expected. If the product team cannot commit to an event dictionary and review cadence, analysis quality degrades fast.
- Pricing shock tied to usage: Costs can scale with tracked users and event volume. The surprise is rarely the sticker price; it is the gap between assumed and actual event counts.
- Governance becomes work: Permissions, data taxonomy, and metric definitions reduce chaos, but they also add process. In our experience working with B2B SaaS teams, the biggest “tool disappointment” happens when nobody owns the measurement plan after implementation.
- Account-level questions require deliberate modeling: If your core KPI is at the account level (workspaces, organizations), you need to ensure your analytics setup supports that view, not only individual users.
A quick self-assessment to avoid wasted trials
Before you start a trial of amplitude product analytics, verify these four prerequisites in one working session:
- North Star journey: Write one activation funnel with 4 to 6 steps and the exact events that represent each step.
- Identity rules: Decide how you will merge anonymous and logged-in activity, and how you represent account/workspace membership.
- Event budget: Estimate daily events per active user for your core flows (page views, clicks, key actions) so you can model growth.
- Owner and cadence: Assign an analytics owner and a weekly review routine for event QA and dashboard integrity.
Evaluate fit in 30 minutes using a buyer checklist
A 30-minute buyer checklist for amplitude product analytics should validate economics, data quality, governance, and day-to-day workflow, not just whether dashboards look good.
Step 1: Instrumentation and data quality checks (10 minutes)
Open your product, perform a core workflow, and confirm you can answer “did the user do X” from raw events. If you cannot, no amount of UI polish will help.
- Event schema sanity: Do event names follow a consistent verb-object pattern (for example, Created Project, Invited Teammate)?
- Property usefulness: For the same event, do you capture properties you will actually filter by (plan, role, source, workspace_id)?
- Duplicates and noise: Are high-volume events (page views, auto-clicks) swamping meaningful events?
- Join keys: Can you reliably tie events to both a user and an account/workspace where needed?
If your team is still deciding what to track, start with a KPI-first plan and then map events to the funnel. A practical starting point is analytics events tracking.
Step 2: Economics and pricing risk checks (10 minutes)
Pricing risk is manageable when you model tracked users and event volume from real usage rather than forecasts.
- Define “tracked user”: Align internally on whether you will count anonymous users, logged-in users, and internal staff activity, then test your platform settings to exclude what should not be counted.
- Event volume model: Calculate a rough events-per-user-per-day for your key flows. Multiply by your active users and add expected growth. The goal is not precision; it is avoiding a 10x surprise.
- High-volume event strategy: Decide what to sample, what to drop, and what to aggregate elsewhere (for example, raw clickstream).
What surprised our team was how often cost issues trace back to “free” auto-capture that no one audits in week one. Running a 60-minute event audit early is usually cheaper than rewriting reports later.
Step 3: Governance and permissions checks (5 minutes)
- Role-based access: Can you prevent accidental metric edits while still allowing self-serve exploration?
- Workspace and project structure: Can you separate production vs staging data and restrict sensitive environments?
- Metric definitions: Can you lock definitions for activation, retained, and qualified accounts so teams do not reinvent them?
Step 4: Operational workflow checks (5 minutes)
- From insight to action: How fast can you go from “drop-off at step 3” to “which users did this happen to” and then to a remediation?
- Core analyses: Verify you can build funnel analysis, a retention view (see cohort retention curve), and actionable audiences (see user segmentation) without exporting CSVs as the default.
Is Amplitude legitimate, secure, and a safe long-term vendor
Amplitude product analytics is easiest to greenlight when procurement and security can verify compliance evidence and your team can prove data correctness in a controlled trial.
Verification checklist to reduce vendor risk
- Company identity and support: Confirm legal entity details, support SLAs, and escalation paths that match your risk tolerance.
- Security documentation: Request current security and privacy documentation and confirm it matches how you will use the product (regions, subprocessors, data retention).
- Compliance evidence: Ask for relevant compliance reports and attestations your organization requires (your security team should specify what is acceptable).
- Data processing terms: Review DPA terms, breach notification, data deletion, and whether you can export your data in a usable form.
Trial validation steps (the part most teams skip)
- Identity resolution test: Create one test user, use the product anonymously, then log in and verify events unify the way you expect.
- Permission test: Create two roles (analyst vs viewer) and confirm viewers cannot accidentally alter definitions.
- Event QA: Pick 10 key events and validate they fire exactly once per action, with required properties populated.
- Time-to-insight: Measure how long it takes to answer a real question like “Where do trial users fail to reach first value?” using only the tool and your existing team, not a special analytics sprint.
Governance red flags that block scale later
- Undefined internal policy: No decision on what constitutes PII and what should be hashed or excluded.
- No single source for metric definitions: “Activation” means something different in every dashboard.
- Over-collection: Capturing every click by default without a retention policy makes both cost and compliance harder.
Amplitude vs BI tools like Tableau, when to use each and when to use both
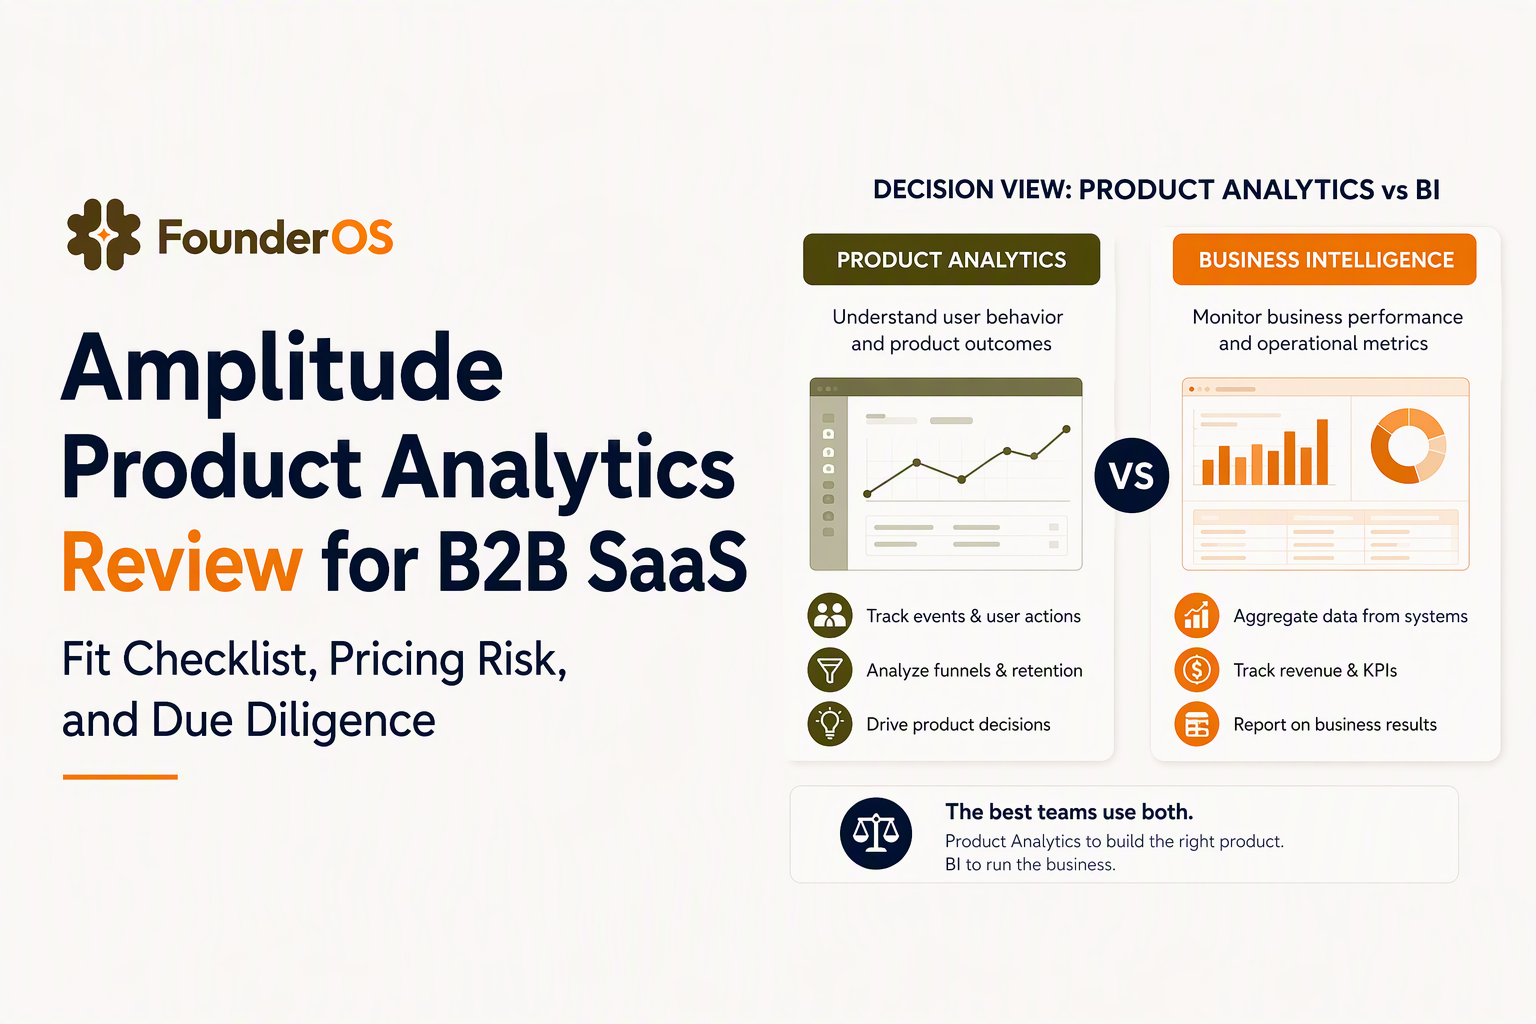
Amplitude product analytics answers behavioral product questions from event streams, while BI tools like Tableau typically answer business questions from modeled tables, so the right setup depends on who asks what and how your data is shaped.
Use product analytics for behavioral questions (event-first)
- Examples: “Which onboarding step causes the most drop-off?” “Do users who adopt Feature A retain longer?” “What sequences predict conversion?”
- Data shape: High-volume event logs tied to users and accounts, analyzed as funnels, paths, and cohorts.
Use BI for finance and operational reporting (model-first)
- Examples: “What is ARR by segment?” “How do refunds impact net revenue retention?” “What is pipeline by source and close date?”
- Data shape: Curated tables with consistent grain and definitions, often built in a warehouse.
Use both when you need closed-loop reporting
A common pattern is product analytics for discovery and diagnosing behavior, plus BI for governed revenue reporting. After running audits across stacks, the pattern was clear: teams move faster when “why did users drop off” lives in product analytics, and “what did that do to revenue” lives in BI with consistent accounting rules.
| Decision point | Product analytics (event-first) | BI (model-first) | Use both when |
|---|---|---|---|
| Primary questions | Behavior, activation, retention | Revenue, finance, ops KPIs | You need behavior tied to revenue outcomes |
| Typical users | PM, Growth, Lifecycle, CS | RevOps, Finance, Exec reporting | Cross-functional KPI alignment is required |
| Data structure | Events + user/account identities | Modeled tables, warehouse | You want exploration plus governed reporting |
| Common pitfall | Too many noisy events inflate cost | Slow iteration for product questions | Definitions drift without shared metric owners |
FAQ
How many times should we mention Amplitude Product Analytics in our evaluation doc?
Use “amplitude product analytics” where it clarifies scope, but focus your document on your event taxonomy, identity rules, and pricing model assumptions. The tool name matters less than the measurement plan you will maintain.
What is the fastest way to estimate pricing risk?
Instrument 1 to 2 core user journeys, then compute events per active user per day from real traffic for at least a few days. Multiply by your projected active users and validate how tracked users are counted (including anonymous and internal users).
What should we verify in a security review?
Request the security and privacy documentation your org requires, confirm data retention and deletion paths, and test permissions in the product. Also confirm you can export your raw or transformed data in a usable format to reduce lock-in risk.
Is it ever better to start with a lighter alternative?
Yes. If your biggest risk is slow instrumentation and you mainly need clear funnels, real-time segments, and activation diagnostics, a smaller stack can get you to “first insight” faster. You can graduate to a heavier platform after your event dictionary and workflows are stable.
If you want solid funnels, segmentation, and GTM visibility without enterprise overhead, Founder OS is a founder-friendly path to implement event tracking, user profiles, and activation reporting quickly. Start free or book a demo to validate your tracking plan in a week, then decide whether amplitude product analytics is the right long-term system for your scale.
Read Next
View all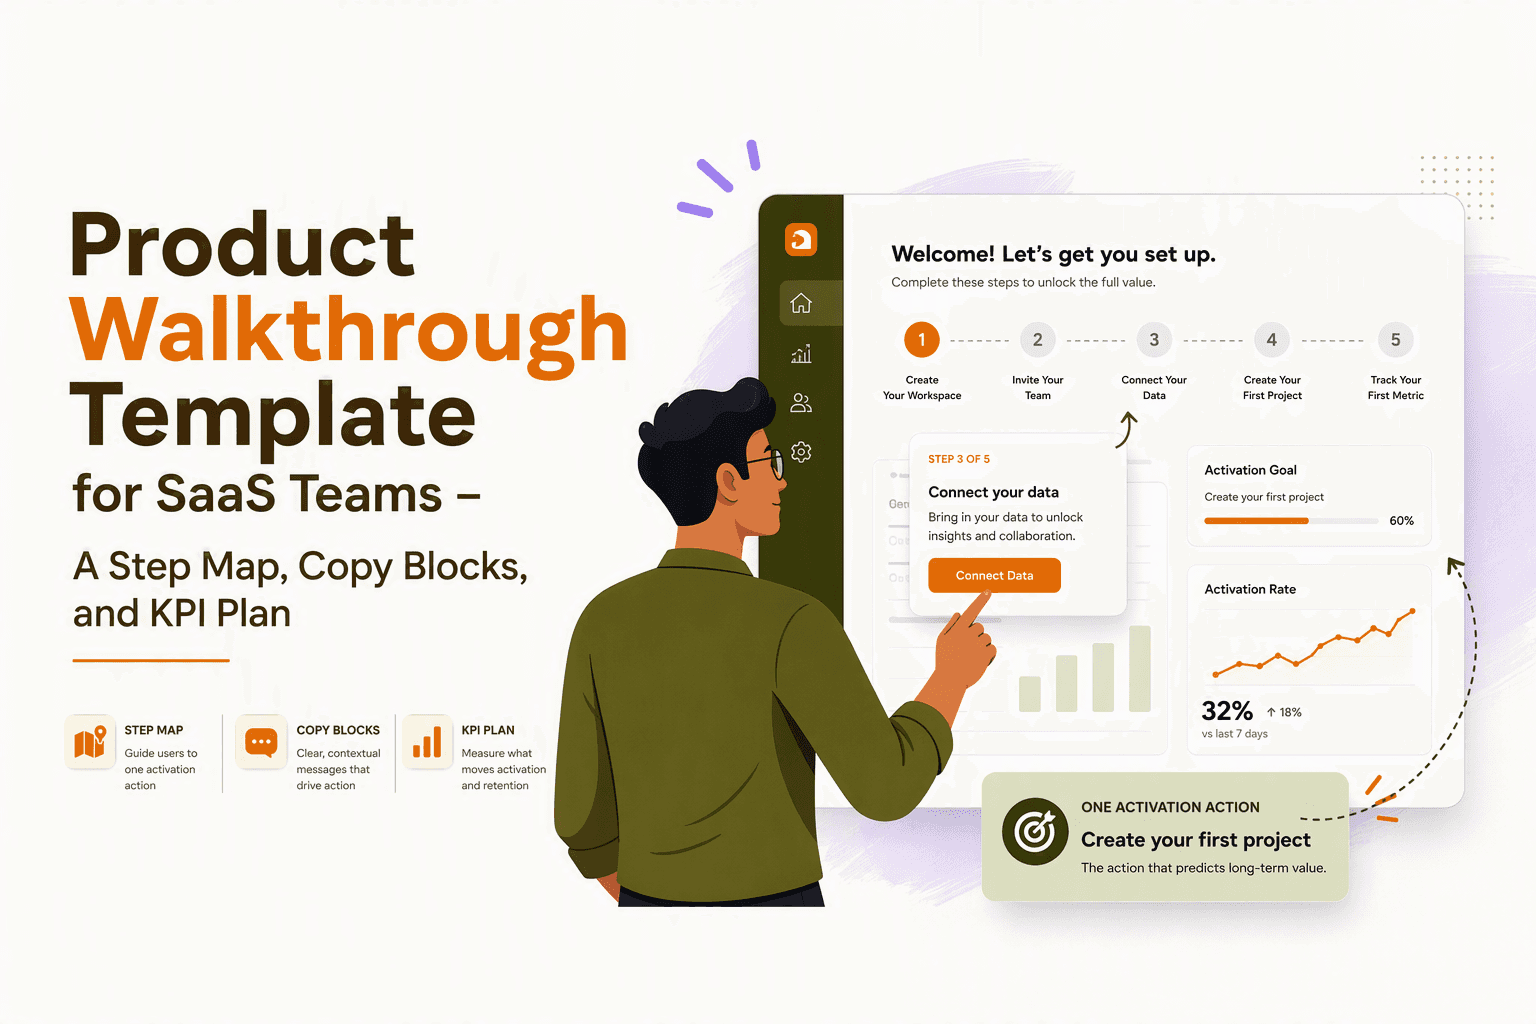
Product Walkthrough Template for SaaS Teams - A Step Map, Copy Blocks, and KPI Plan
Use this product walkthrough template: step map, copy blocks, QA checklist, triggers, and KPI schema to improve activation in one sprint.
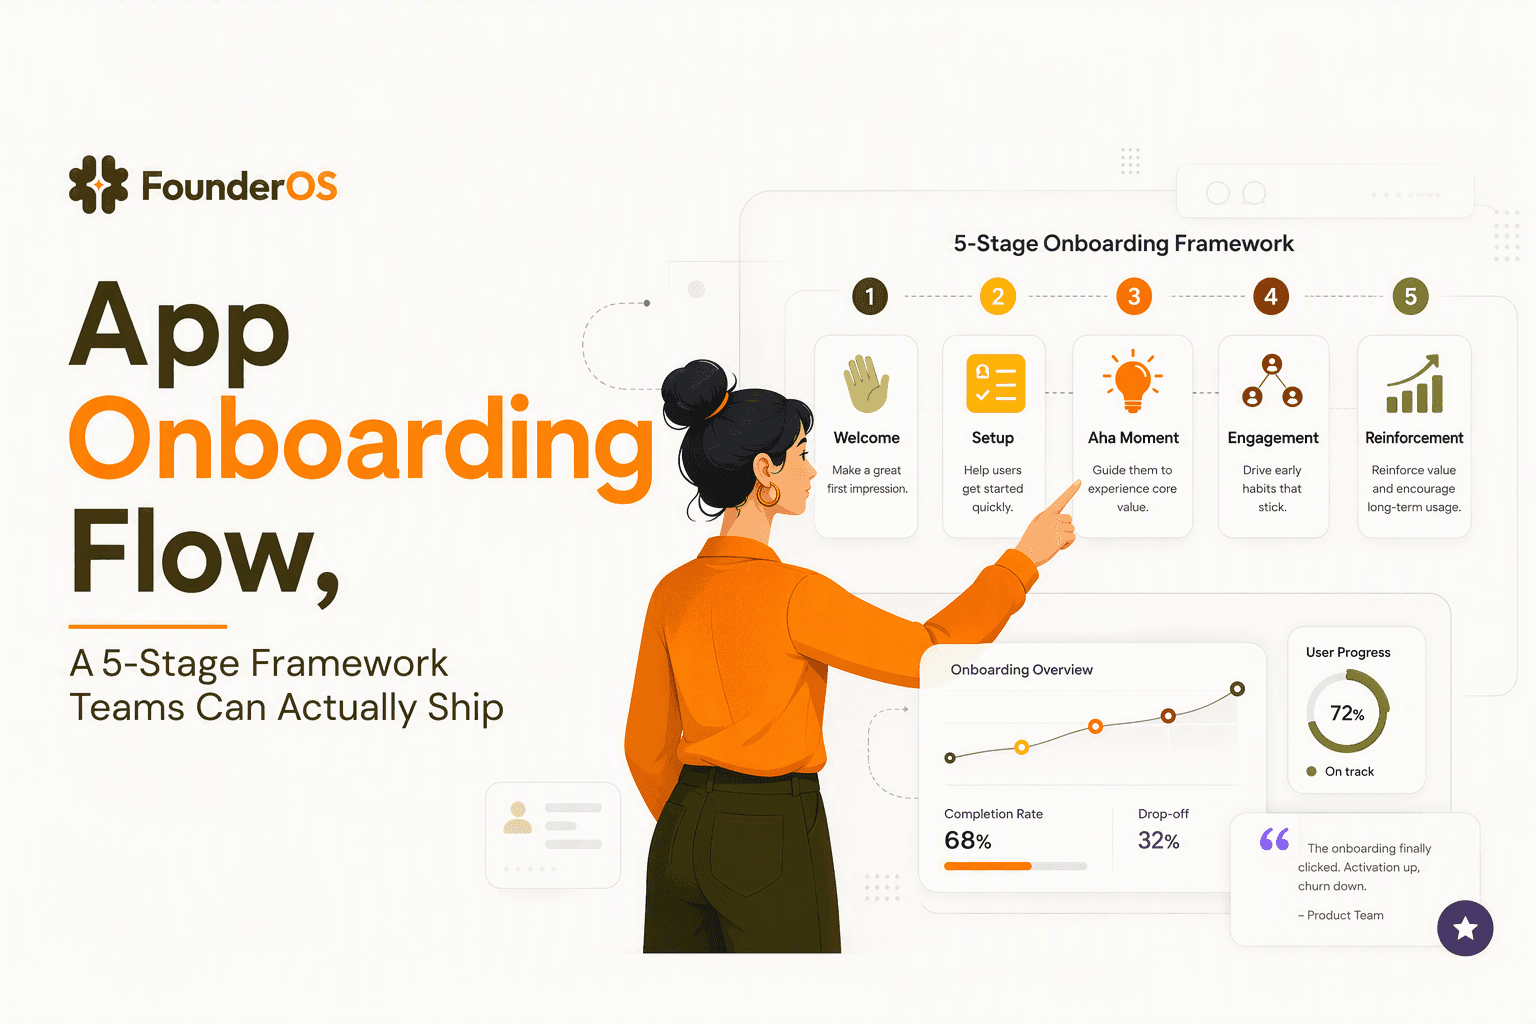
App Onboarding Flow, A 5-Stage Framework Teams Can Actually Ship
Build an app onboarding flow teams can ship: a practical 5-stage framework, key screens, platform tweaks, and what to measure to improve activation.
Sales Funnel Optimization Explained and How To Find Your Biggest Leak First
Learn sales funnel optimization with simple diagnostics, formulas, and a reusable worksheet to fix the biggest leak before buying more traffic.