
Sales Funnel Optimization Explained and How To Find Your Biggest Leak First
Sales funnel optimization is the practical process of finding the single biggest conversion leak in your customer journey, fixing it first, then measuring the revenue impact before you spend more on traffic or new campaigns.
- Map your journey to one clear funnel model, then measure drop-off by step so you can compare like with like.
- Prioritize fixes by expected revenue impact, not by opinions, using a simple “biggest leak first” diagnostic.
- Use a reusable worksheet to turn insights into owners, next actions, and a measurement plan you can repeat monthly.
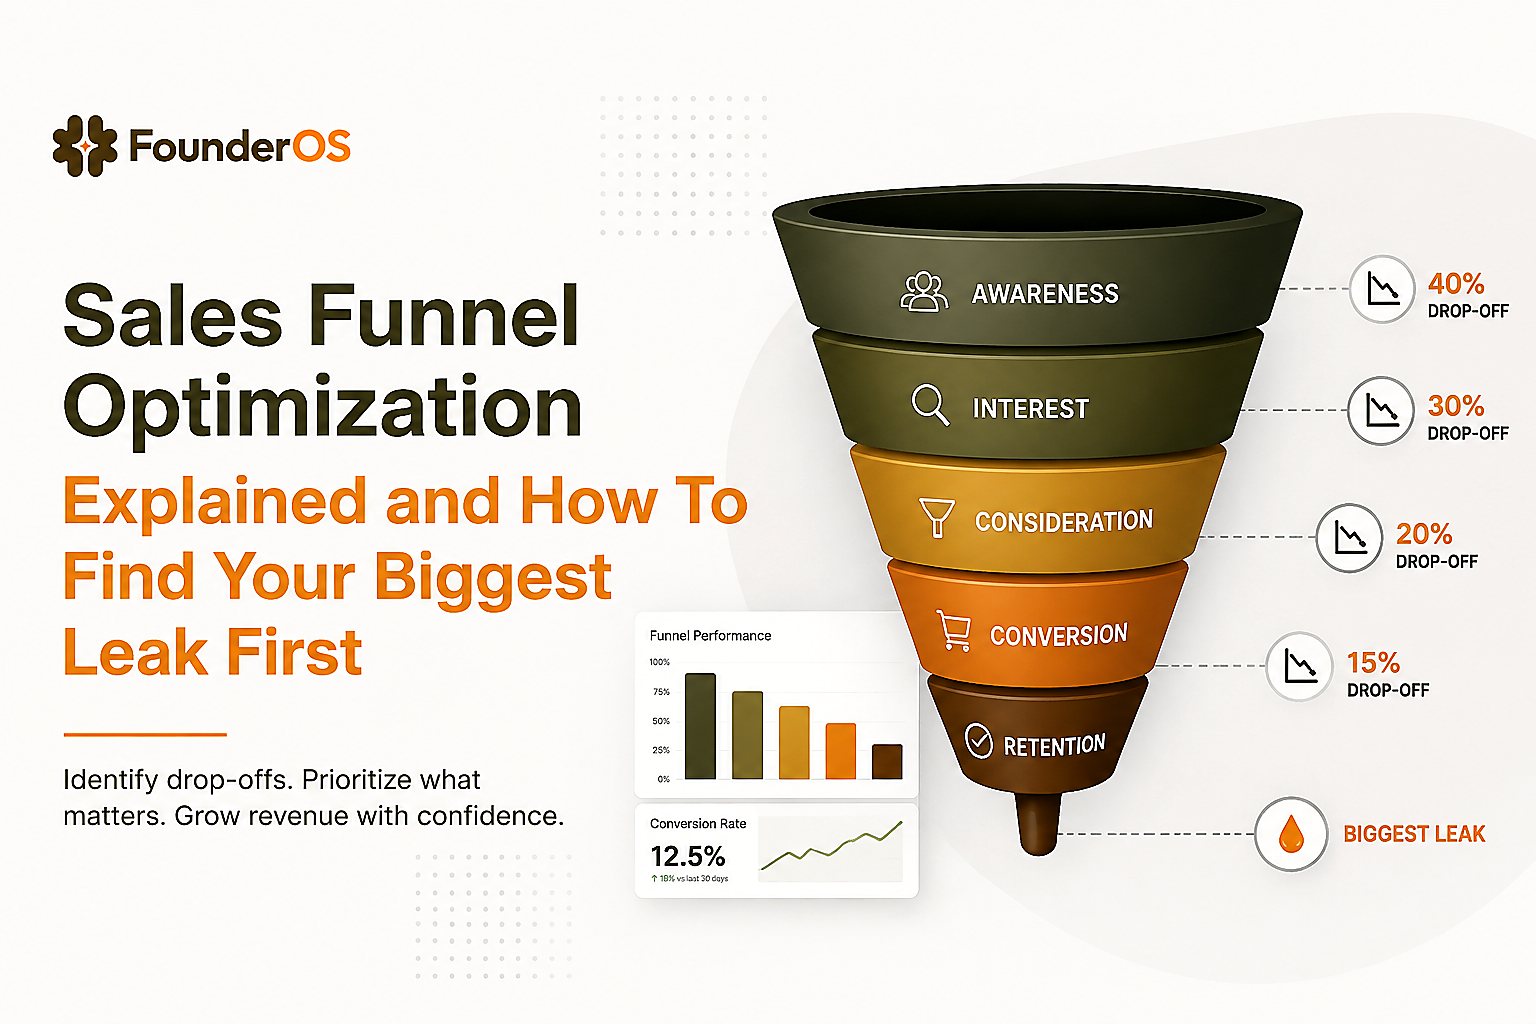
What Sales Funnel Optimization Means, and How Common Funnel Models Map
Sales funnel optimization works best when everyone agrees on the same stages and the same “conversion event” that moves a person forward.
Definition in one sentence
Sales funnel optimization is improving the % of people who progress from one defined stage to the next by removing friction, clarifying value, and aligning offers and follow-up with intent.
Why different funnel models cause measurement chaos
Most teams think they have a funnel, but they actually have three: marketing’s version, sales’ version, and product’s version. The result is arguments like “lead quality is down” versus “the demo page is fine” because each team is looking at a different set of steps.
How the 4-stage, 5-stage, and 6-stage models map to the same journey
All common models describe the same reality: people learn you exist, evaluate whether you fit, then commit. The differences are just how finely you split the middle.
- 4-stage model: Awareness → Interest → Decision → Action. Good for small teams that need speed and clarity.
- 5-stage model: Awareness → Consideration → Intent → Purchase → Retention. Adds “intent” as a measurable pre-purchase step (for example, pricing view or demo request).
- 6-stage model: Awareness → Engagement → Consideration → Conversion → Activation → Expansion. Separates the sale from the first value moment, which matters for subscription businesses where “closed-won” is not the same as “successful customer.”
A simple mapping table you can copy into your doc
Pick the model that matches how you sell, then define one event for each stage so measurement is unambiguous.
| Reality | 4-stage label | 5-stage label | 6-stage label | Example “move-forward” event |
|---|---|---|---|---|
| They discover you | Awareness | Awareness | Awareness | First site visit or ad click |
| They show real curiosity | Interest | Consideration | Engagement | Read 2+ key pages, watch a short demo, or subscribe |
| They evaluate fit | Decision | Consideration | Consideration | View pricing, compare plans, review integrations |
| They raise a hand | Action | Intent | Conversion | Request demo, start trial, or book a call |
| They get first value | (not explicit) | Purchase | Activation | Complete setup and hit “Aha” action |
| They stay and grow | (not explicit) | Retention | Expansion | Renew, add seats, upgrade plan |
If you want a deeper measurement-first version of this mapping for subscription journeys, the framing in sales funnel optimisation is a useful companion read.
Find The Biggest Leak First With A Simple Funnel Diagnostic
The fastest path to sales funnel optimization is prioritizing the step with the highest “lost value” rather than the loudest complaint.
Step 1: Write your funnel as a list of events, not page names
Pages are a proxy; actions are the truth. Replace “Landing page” with “Started signup,” replace “Pricing page” with “Clicked plan,” and so on. This makes the funnel measurable even when UX changes.
Step 2: Calculate step-by-step conversion and drop-off
Use these two formulas for each step:
- Step conversion rate: CR(step) = Completed Step N / Entered Step N
- Step drop-off rate: Drop-off(step) = 1 - CR(step)
Do not chase benchmarks yet. Your goal is to rank steps inside your own funnel.
Step 3: Estimate the “lost value” per step
To decide what to fix first, multiply how many people you lose by what a saved conversion is worth. A simple starter approach is:
- Lost conversions at step: Lost = Entered Step N - Completed Step N
- Expected value per saved conversion: EV = Close rate from that point onward × Average revenue per customer
- Lost value: Lost Value = Lost × EV
This is imperfect, but it forces the right conversation: the biggest percentage drop is not always the biggest business leak.
Step 4: Add a “fixability score” so you do not pick impossible work
Rank each step 1 to 5 on two criteria, then multiply:
- Effort: 1 (tiny copy tweak) to 5 (requires product rebuild, legal, procurement)
- Confidence: 1 (guessing) to 5 (clear evidence from recordings, surveys, support tickets)
Priority score = Lost Value × (Confidence / Effort). Start with the highest score.
After running a few audits, the pattern was clear: teams waste weeks optimizing the first step they can see (often ads or the homepage) while the real leak sits later, where fewer people look but more revenue is decided.
Common “biggest leak” patterns to look for
- High drop from pricing view to demo request: unclear packaging, missing trust proof, or pricing surprise.
- High drop from signup start to completion: too many fields, email verification timing, weak error handling.
- High drop from trial start to first value: onboarding friction, unclear next step, or wrong expectation set by marketing.
If you want a structured approach to inspecting these steps and connecting them to fixes, funnel analysis lays out a diagnostic flow you can reuse.
Measure Performance With Conversion Rates, ROI, and One Worked Example
Sales funnel optimization only “counts” when you can translate a conversion lift into dollars and compare it to the cost of the fix.
The three metrics that keep optimization honest
- Stage conversion rate: tells you where friction lives.
- Incremental conversions: tells you how much change you created versus baseline.
- ROI of the change: tells you whether the work was worth doing compared to other options.
Plain formulas (no dashboards required)
- Incremental conversions: (New CR - Old CR) × Entrants to step
- Incremental revenue: Incremental conversions × Revenue per conversion
- ROI: (Incremental revenue - Cost of change) / Cost of change
Worked example using realistic, round numbers
Assume a monthly flow like this:
- 10,000 visitors
- 600 start signup (6.0% of visitors)
- 300 complete signup (50% of starters)
- 90 hit first value action in the product (30% of signups)
- 18 become paying customers (20% of activated users)
Now assume you discover the biggest leak is “complete signup → first value,” and you run an onboarding change that lifts that step from 30% to 36% (a 6 point lift). The math:
- Incremental activated users: (0.36 - 0.30) × 300 = 18
- Incremental customers: 18 × 0.20 = 3.6, round to 3 to 4 customers
To translate into revenue, you need one agreed revenue unit. Use average first-year value if you have it; if not, use average first payment as a conservative proxy. If average first-year value is $2,400:
- Incremental revenue: 3.6 × $2,400 = $8,640
If the change took $1,500 in design and engineering time, then:
- ROI: ($8,640 - $1,500) / $1,500 = 4.76 (476%)
What surprised our team was how often the best ROI fix is not the “highest traffic” page; it is the step right before a strong intent signal, where a small lift converts directly into pipeline.
For a tactical walkthrough of building and interpreting these step views, conversion funnel analysis can help you go from chart to action items faster.
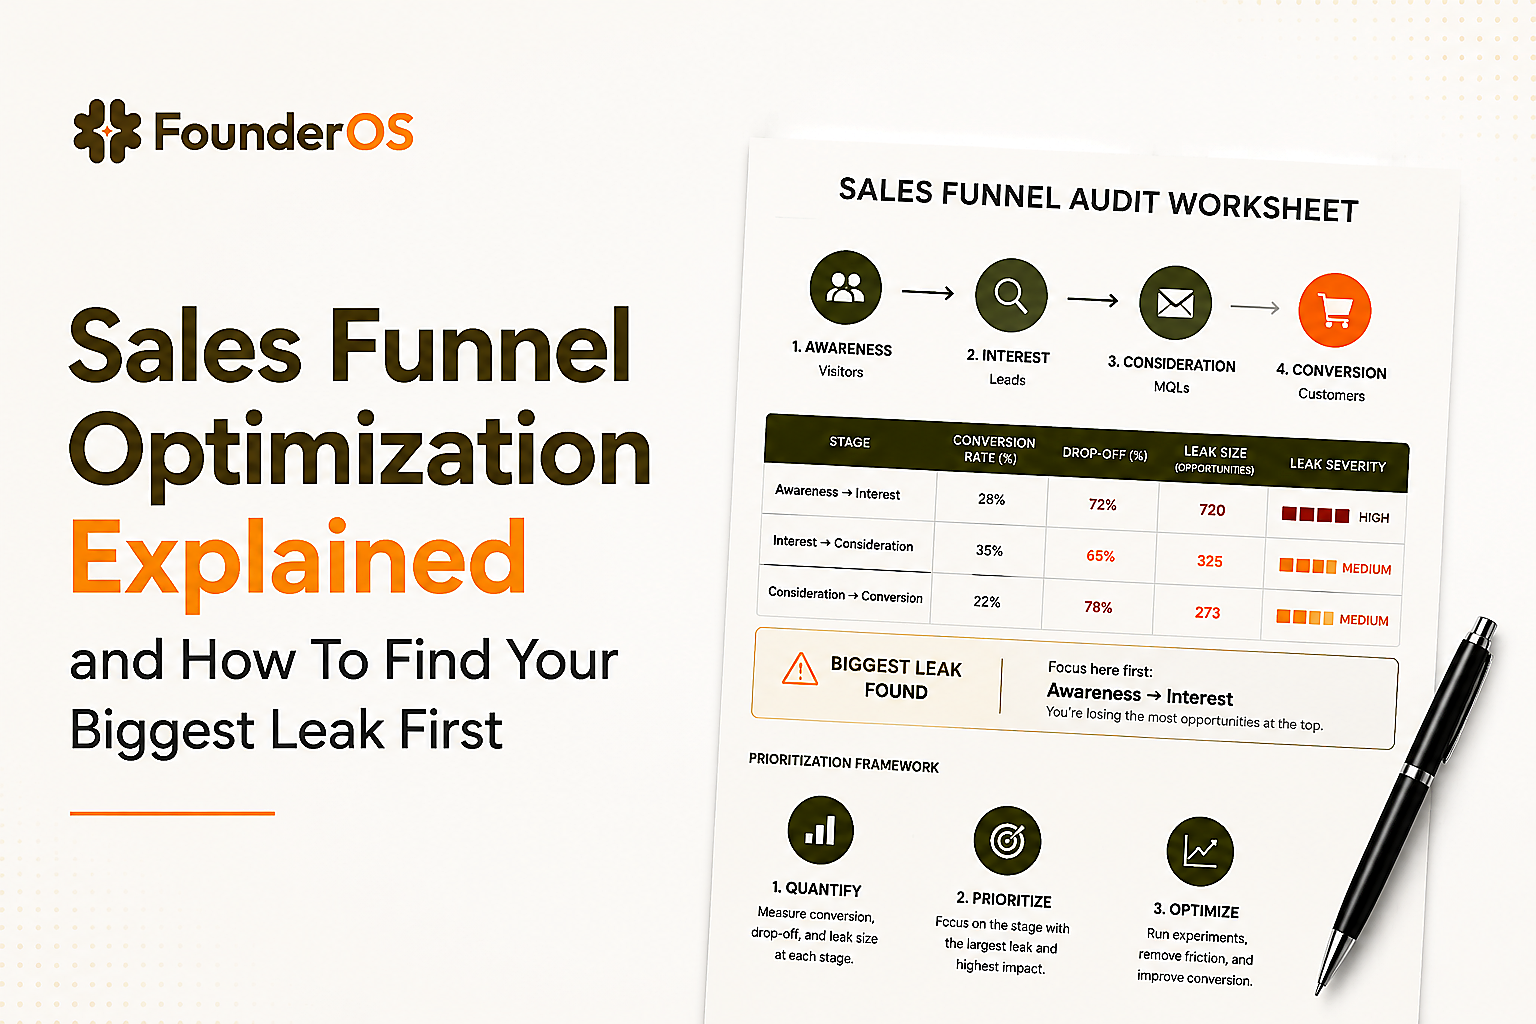
Use The 10-3-1 Rule To Back Into A Revenue Goal
The 10-3-1 rule is a quick way to translate a revenue target into required top-of-funnel volume when you do not yet have mature benchmarks.
What the 10-3-1 rule means in practice
- 10 leads to generate 3 qualified opportunities
- 3 opportunities to close 1 customer
In other words, it assumes roughly 10% lead-to-customer, with a qualification step in between. The exact ratios vary by motion (self-serve vs. sales-led), but the value of the rule is speed: it gives you a starting model you can replace with your own actual rates as you measure.
When the rule still helps and when it misleads
- Helpful when: you need rough pipeline math for planning, you are early, and you will revisit monthly.
- Misleading when: you have multiple segments with very different close rates, or “leads” include low-intent newsletter signups mixed with demo requests.
Translate a revenue goal into pipeline requirements
Start with a revenue goal, then work backward:
- Customers needed = Revenue target / Average revenue per customer
- Opportunities needed = Customers needed × 3
- Leads needed = Opportunities needed × 10
Example: If you want $120,000 in new annual revenue and your average first-year value is $6,000, you need 20 customers. Using 10-3-1, that suggests about 60 opportunities and 600 leads. Then your sales funnel optimization work is simply improving the real ratios so you need fewer leads for the same outcome.
Upgrade the rule with one small improvement
Instead of “leads,” track at least two lead types:
- High-intent: demo requests, trial starts, pricing-to-contact clicks.
- Low-intent: content signups, webinar registrations.
This keeps you from overestimating pipeline from activity that does not convert.
If your qualification process is inconsistent, a defined lead scoring system is a practical next step because it turns “intent” into a measurable threshold.
Match Offers To Each Stage Without Overcomplicating The Funnel
Offer-to-stage matching is the simplest way to reduce friction because it aligns what you ask for with what the buyer is ready to do.
A three-stage offer map you can apply to any model
You do not need 12 stages and 40 assets. You need one strong offer per stage and one clear next action.
- Discover: promise and proof. Goal: earn attention and trust.
- Evaluate: clarity and comparison. Goal: help them self-qualify.
- Commit: risk reversal and momentum. Goal: make the next step feel safe and obvious.
Checklist of what “good” looks like at each stage
- Discover stage checklist:
- One-sentence positioning that states who it is for and what outcome it creates
- One proof element: customer logos, quantified outcome, or clear demo clip
- A low-commitment CTA: subscribe, watch, read, or interactive tool
- Evaluate stage checklist:
- Pricing and packaging answers the “which plan is me?” question
- Objection handling is visible: security, implementation time, integrations
- CTA offers the right depth: demo, trial, or calculator
- Commit stage checklist:
- Form friction is justified and minimized (only ask what you will use)
- Confirmation page tells them exactly what happens next and when
- Follow-up matches intent: fast response for high-intent actions
Where teams accidentally create drop-off
- High-friction CTA too early: asking for a demo on a page meant for discovery.
- Low-commitment CTA too late: offering “subscribe” on pricing where buyers are ready to talk.
- Mixed messages: ad promises one outcome, landing page sells another.
In our experience working with early-stage subscription teams, the biggest lift often comes from reducing “decision fatigue” on the evaluation step: fewer options, clearer next step, and proof placed next to the claim it supports.
Turn The Audit Into A Reusable Sales Funnel Optimization Worksheet
A reusable worksheet makes sales funnel optimization repeatable because it turns analysis into owners, deadlines, and measurement plans.
The worksheet template (copy and fill)
Paste this into a doc or spreadsheet and fill it for each funnel step.
| Step | Entry event | Success event | Entered | Completed | CR | Main friction hypothesis | Evidence | Proposed fix | Owner | Cost | Success metric and time window |
|---|---|---|---|---|---|---|---|---|---|---|---|
| Signup | Click “Start free” | Account created | Session recordings + error logs | Reduce fields, improve errors | CR lift over 14 days | ||||||
| Activation | First login | First value action | Onboarding completion rate | Guided checklist and tips | Activation lift over 30 days |
Rules that keep the worksheet from becoming busywork
- One step, one metric: avoid “success = everything good.” Pick the one event that matters.
- One hypothesis per row: if you have three hypotheses, make three rows and test separately.
- Write the evidence type: qualitative (recordings, surveys) or quantitative (drop-off, time-to-complete).
- Define the time window: 14 days for landing page/form changes, 30+ days for onboarding and retention changes.
Where activation fits into the worksheet
For subscription products, the most expensive leak is often after the “conversion” because paid acquisition and sales effort are already spent. A clear activation definition and measurement plan is the guardrail that stops you from optimizing the wrong thing; if you need a starter definition and pitfalls to avoid, activation rate is a helpful reference.
Choose Tools By Job To Be Done, Not By Vendor Claims
Tool selection for sales funnel optimization should follow the job you need done, because each tool category answers a different question.
A simple tool-to-problem map
- Analytics (events and funnels): Where do people drop off, and which cohorts behave differently?
- CRM: Which accounts are in pipeline, and what is the next action?
- Email and automation: What follow-up happens after a behavior (trial start, pricing view, abandonment)?
- A/B testing: Which variant produces a measurable lift without guessing?
- Heatmaps and session recordings: What friction do users experience moment-to-moment?
Criteria to evaluate tools without getting distracted
- Time to first insight: can you see real user behavior quickly enough to act this week?
- Clarity of definitions: can you define funnel steps as events, not just URLs?
- Cohort comparison: can you compare segments (by channel, plan, persona, or behavior) side-by-side?
- Drill-down: can you go from a drop-off chart to the exact sessions or profiles that dropped?
- Governance: can you keep metrics consistent as your team grows?
A practical “minimum stack” for a small team
- One source of truth for pipeline (CRM)
- One analytics tool that can do event-based funnels
- One experiment workflow (even if it is lightweight)
We initially assumed more tools would create better answers, but data showed the opposite: the biggest lifts came after we reduced conflicting definitions and forced every team to use the same step events and success metrics.
| If your problem is... | Start with this tool type | Because you need to answer... |
|---|---|---|
| Unknown drop-off location | Event analytics + funnels | Which step loses the most value? |
| Low demo-to-close rate | CRM + call notes | Which objections and segments stall? |
| Trial users do not reach value | Onboarding + behavioral tracking | Which first actions predict retention? |
| People abandon forms | Session recordings + form analytics | Where do they hesitate or error out? |
FAQ
If you use the worksheet above and want event-level visibility into where users drop off plus segmentation to compare cohorts, Founder OS can support the same sales funnel optimization audit with product tracking, user profiles, and a GTM report so you can move from leak to fix with less guesswork.

PostHog vs Mixpanel Pricing Reality, Setup Risk, and the Decision Checklist
posthog vs mixpanel compared on true cost, setup risk, identity, and rollout. Use a pricing worksheet and 7-day trial checklist to decide fast.
Customer Onboarding Process Explained for B2B SaaS Teams
Learn the customer onboarding process from signup to first value, plus a simple framework to reduce friction and improve activation.

Interactive Walkthroughs Explained, A Step-By-Step Guide for SaaS Teams
Learn what an interactive walkthrough is, where it works best, and how to build one step by step without engineering help.