
Sales Funnel Optimisation for B2B SaaS, a Measurement-First Playbook
A measurement-first guide to sales funnel optimisation for B2B SaaS: event tracking, leak diagnosis, experiments, and product-led lead scoring.
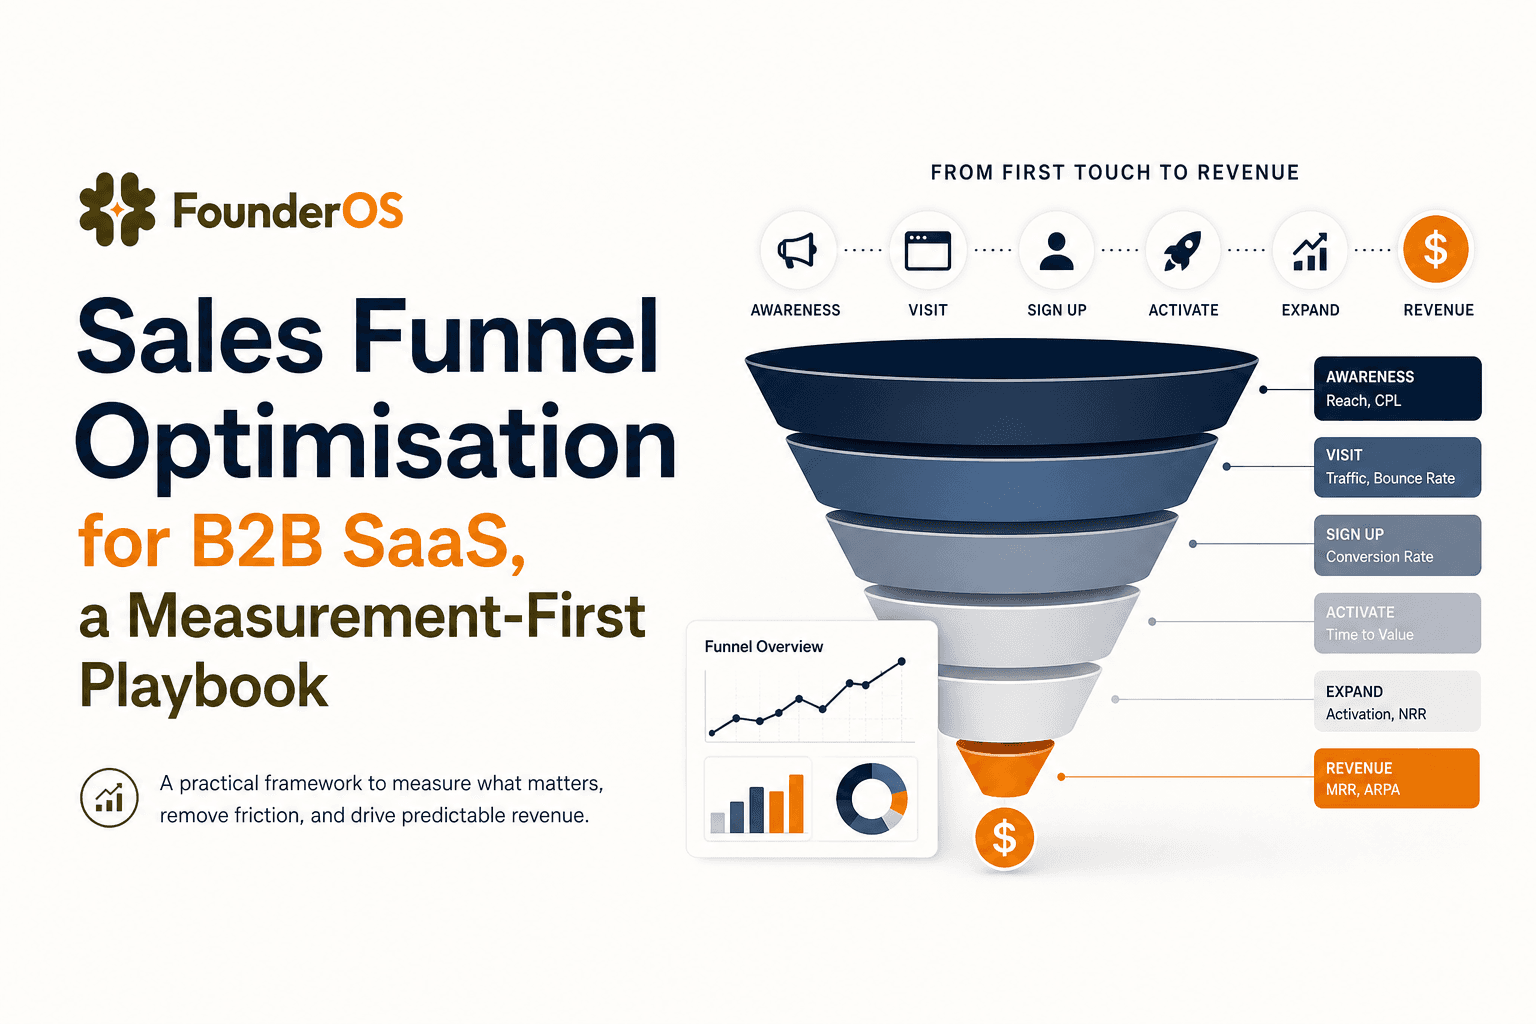
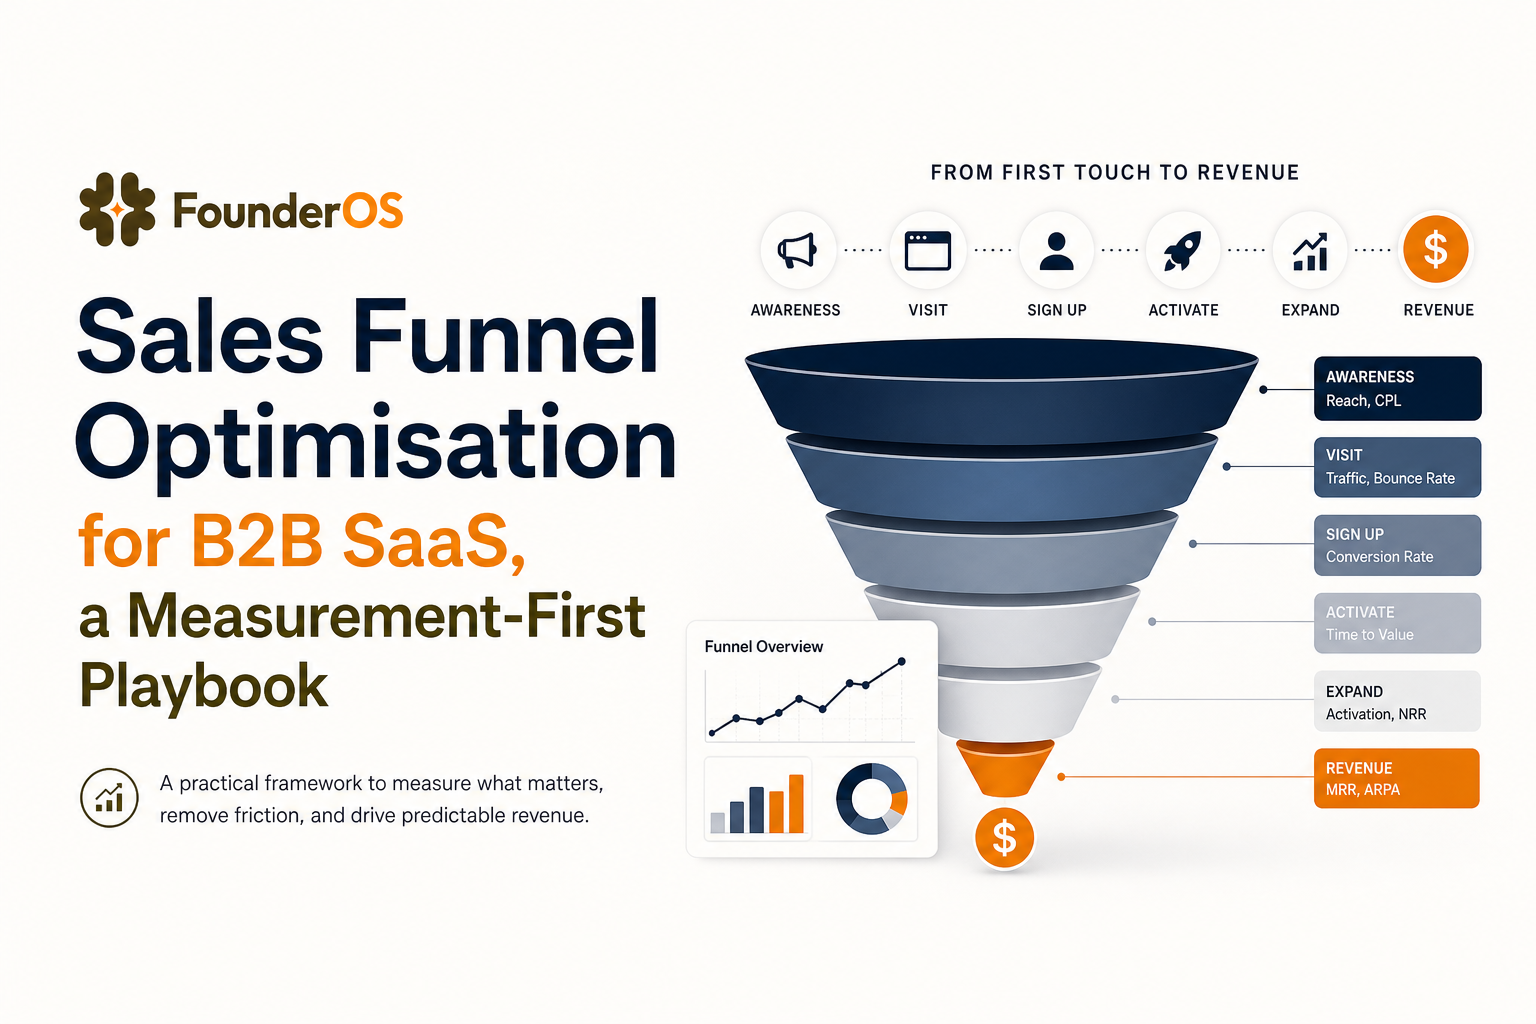
Sales funnel optimisation in B2B SaaS is rarely blocked by “more leads” and more often blocked by unclear definitions, messy tracking, and teams optimizing different numbers. The fix is a measurement-first system that connects acquisition, sales activity, and product usage events all the way to revenue so you can diagnose where momentum breaks, prioritize the right changes, and prove impact with clean experiments.
- Define a SaaS funnel using lifecycle stages and conversion events, not just CRM stages, so every team optimizes the same outcomes.
- Instrument identity, events, and attribution so you can trace revenue back to specific behaviors and channels.
- Run a weekly cadence: segmented leak diagnosis, impact-based prioritization, experiment validation, and product-signal lead scoring.
Define the funnel you’ll actually optimize, not the one in your CRM
Most CRM pipelines are good at describing sales process, but weak at describing buyer and user progress. For sales funnel optimisation, you need a single funnel definition that includes both go-to-market and product activation, because in B2B SaaS the fastest path to revenue usually runs through “did they experience value?” not “did we send a follow-up?”
Step 1: Use lifecycle stages that match how SaaS converts
Start with lifecycle stages that are observable and measurable. A practical default looks like this:
- First touch (ad click, content view, outbound reply)
- Lead created (form submit, inbound email, meeting booked)
- Qualified (meets ICP and intent threshold)
- Evaluation started (trial created or sandbox access)
- Activated (reaches a value milestone in product)
- Commercial intent (pricing view, upgrade click, security review initiated)
- Closed won (contract signed)
Step 2: Define 1 conversion event per stage (with a strict rule)
For each stage, pick exactly one conversion event that is (1) timestamped, (2) attributable to a user or account, and (3) hard to “game.” Examples:
- Evaluation started =
trial_created(not “trial page viewed”) - Activated =
core_action_completed(your product’s “aha” moment) - Commercial intent =
pricing_viewed+contact_sales_clicked(either can count, but define it)
When we audited funnels for early-stage B2B SaaS teams, the most common failure was counting “activation” as login, which inflated conversion rates but did not correlate with retention or pipeline quality.
Step 3: Add two guardrail metrics so optimization doesn’t backfire
Every stage conversion should have guardrails to prevent vanity wins:
- Quality guardrail: e.g., % activated accounts that reach week-2 retention
- Efficiency guardrail: e.g., sales touches per opportunity or time-to-first-value
If you want a deeper diagnostic structure for stage-by-stage drop-offs, see this guide on funnel analysis.
Instrument the funnel with event tracking, identity resolution, and clean attribution
Sales funnel optimisation fails when you cannot connect three things: (1) who the person is, (2) what they did in the product, and (3) how they arrived. The instrumentation goal is not “track everything,” it’s “track the minimum set that lets you explain revenue changes.”
The minimum viable event spec (what to track)
Use a spec that ties product behavior to evaluation and revenue outcomes:
- Acquisition:
landing_page_view,form_submitted,demo_booked - Evaluation:
trial_created,invite_sent,integration_connected - Activation:
core_action_completed,onboarding_step_completed - Commercial intent:
pricing_viewed,upgrade_clicked,security_page_viewed - Revenue:
opportunity_created,closed_won,plan_upgraded
Identity resolution checklist (person, account, and roles)
In B2B, the same account has multiple users and multiple devices. Your tracking must support:
- Anonymous to known merge: map pre-signup browsing to post-signup usage
- User to account mapping: every event should have
user_idandaccount_id - Role context: store
role(admin, evaluator, champion) when possible - Source of truth rules: define whether CRM or product DB owns company name, plan, and ARR
Attribution that is “clean enough” for decision-making
For most SaaS teams, start with:
- First-touch for understanding channel discovery
- Last non-direct touch for conversion credit
- Self-reported attribution (one optional signup question) to sanity-check tracking
Then add a rule: attribution is only considered valid if the visitor has a stable identifier (cookie + eventual user merge) and UTM parameters are present. This prevents “Direct” from becoming a junk drawer.
Tooling note (keep it practical)
You can implement this with a product analytics stack that supports event tracking, user profiles, and funnel views. Founder OS, for example, is designed to capture click, page view, and feature interaction events quickly and tie them to user profiles so you can build conversion steps and cohorts without waiting on a data team. The important part is not the tool choice, it’s enforcing the spec above and keeping naming consistent.
Diagnose leaks with segmented funnels and drop-off forensics
Once tracking is in place, the fastest wins in sales funnel optimisation come from finding one high-friction step that impacts a large volume of accounts. The mistake is looking at a single blended funnel; it hides the “why.” You need segmented funnels and a forensics workflow that takes you from aggregate drop-off to specific sessions and behaviors.
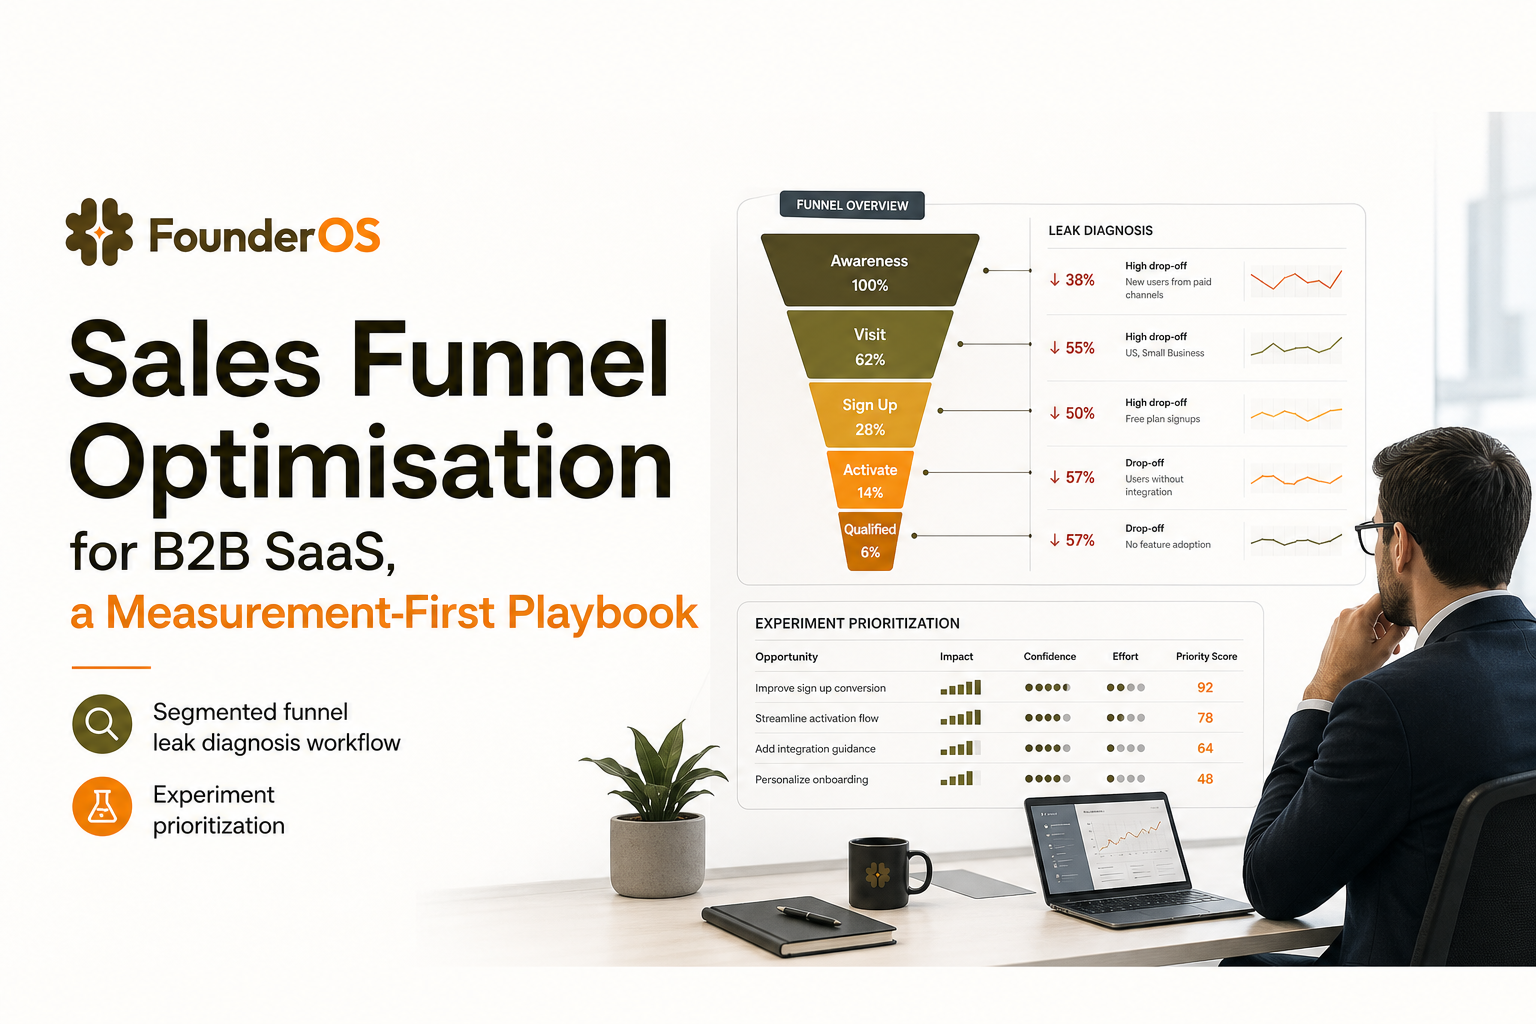
A 4-part leak diagnosis workflow
- Locate the biggest absolute loss: step with highest number of accounts dropping, not just highest percentage.
- Segment by intent and fit: ICP vs non-ICP, inbound vs outbound, small vs mid-market, role (admin vs user).
- Inspect behaviors around the drop: events immediately before and after the step.
- Classify the failure mode: confusion, missing capability, trust/security concern, performance, or handoff delay.
Segment ideas that usually reveal the real problem
- Time-based: accounts that hit activation within 24 hours vs 7 days
- Depth of evaluation: invited teammates vs solo evaluators
- Integration readiness: connected integration vs not connected
- Sales involvement: had a meeting before activation vs after activation
What surprised our team was how often “pricing page views” correlated with activation failures: users checked price because they were unsure the product would work for their use case, not because they were ready to buy.
Drop-off forensics checklist (turn charts into fixes)
For the worst-performing segment, review 10 to 20 real journeys and document:
- Last 3 events before drop-off
- Whether they completed an onboarding step
- Error events (API failures, permission denied, validation errors)
- Time between key steps (signup to first core action)
- Any “trust” signals viewed (security, docs, pricing)
If you want a template-driven approach, this walkthrough on conversion funnel analysis pairs well with the workflow above.
Prioritize and run experiments that move revenue, not vanity conversion rates
After diagnosis, teams often jump to random changes: new email sequences, redesigned pages, extra prompts in onboarding. Sales funnel optimisation becomes effective when every change is prioritized by expected revenue impact and validated with an experiment design that prevents false positives.
An impact model you can use in a spreadsheet
Score each proposed fix on four inputs (1 to 5):
- Reach: how many accounts hit the step per week
- Magnitude: expected lift in the stage conversion rate
- Downstream value: likelihood the lift increases activated-to-won (not just clicks)
- Effort: engineering + design + GTM time
Priority score = (Reach × Magnitude × Downstream value) ÷ Effort. This simple model forces the “so what” conversation: will this change increase qualified pipeline or just improve a local metric?
Define success metrics with guardrails (example)
Example experiment: improve activation by simplifying an integration step.
- Primary metric: activation rate within 72 hours of trial start
- Secondary: % accounts that invite a teammate within 7 days
- Guardrails: trial-to-opportunity rate, support tickets per 100 trials, and median time-to-value
For a deeper framework on reducing time to value, align your activation definition with the first moment users can independently achieve a meaningful outcome.
Experiment design rules that prevent misleading wins
- Prefer holdouts when sales is involved: randomize accounts into “new process” vs “status quo” to avoid selection bias.
- Run long enough for buying cycles: if your median sales cycle is 30 days, do not declare victory in 7.
- Use cohort reporting: compare accounts that started evaluation in the same week.
- Pre-register what “success” means: write it down before launching.
The compounding system, lead scoring from product signals to sales actions
Once your funnel is measurable, the biggest compounding lever is turning product behavior into timely sales actions. This is where sales funnel optimisation stops being a one-off project and becomes an operating system: product-qualified signals route the right accounts to the right motion.
Build a product-qualified lead model (PQL) in 3 layers
- Fit: firmographics (industry, size), persona, and tech stack
- Intent: pricing views, security page views, repeated visits, “contact sales” clicks
- Usage: activation milestone, feature depth, teammate invites, frequency
After running 20+ scoring audits, the pattern was clear: usage thresholds outperform email engagement for predicting sales readiness in trial-based SaaS, but only when the “usage” is tied to the core value action rather than generic activity like logins.
A concrete scoring example (points, caps, decay, routing)
Here’s a simple model you can implement without a data team:
- Activation milestone completed: +30 (cap once)
- Invited teammate: +15 (cap 2 times)
- Used key feature on 3 different days: +20
- Viewed pricing: +10 (decay after 14 days)
- Viewed security/compliance page: +10 (decay after 30 days)
- No activity for 7 days: -20
Routing rule: if score ≥ 50 and fit is “ICP,” create an SDR task within 5 minutes; if score ≥ 70, assign AE and trigger a tailored sequence. A structured template for this is in our lead scoring system guide.
Make scoring explainable to sales (or it won’t be used)
Every routed lead should include a short “why now” payload: the last 3 high-signal events, the activation milestone reached, and the account’s cohort (for example, “started trial this week”). This reduces the common failure where sales ignores scores because they feel arbitrary.
Operationalize weekly funnel optimisation reporting for GTM teams
Sales funnel optimisation sticks when it becomes a weekly habit, not a quarterly initiative. The goal of reporting is alignment: marketing, sales, and product should all see the same funnel, the same segments, and the same experiment outcomes.
A weekly cadence that takes 45 minutes
- 10 min: review funnel conversion by stage (this week cohort vs last week cohort)
- 10 min: review top 2 segments with biggest drop-off changes
- 15 min: review experiment readouts (primary + guardrails)
- 10 min: decide next week’s one priority fix and owner
Dashboard checklist (what must be on one screen)
- Stage conversion rates and absolute counts
- Median time between stages (especially evaluation start to activation)
- Activation-to-opportunity and activation-to-win rates
- Top acquisition sources by activated accounts (not by signups)
- One “leak” segment spotlight with a short narrative
In our experience working with founder-led teams, the fastest way to improve cross-functional trust was to standardize one weekly cohort report and forbid “screenshot analytics” in decision-making.
Alerts that prevent silent regressions
Add simple alerts for:
- Activation rate drops more than X% week-over-week for ICP accounts
- Time-to-value increases above a threshold
- High-intent events spike (pricing/security views) without a matching increase in sales follow-up
Segmentation is the backbone of these alerts. If you need a practical framework for defining segments that map to actions, use this guide on user segmentation.
| Funnel problem you observe | Most likely measurement gap | Fastest next action | Metric to validate |
|---|---|---|---|
| Signups up, revenue flat | Activation definition too weak or missing account mapping | Redefine activation as a core value event and track by account | Activated-to-won rate |
| Many trials, low opportunities | No product-signal lead scoring or routing delay | Implement PQL scoring with a 5-minute routing SLA | Trial-to-opportunity rate |
| High drop-off at one onboarding step | Missing error events and step timing | Add error tracking and inspect 10 sessions in the worst segment | Step completion and time-to-value |
| Sales says leads are low quality | Attribution and fit fields unreliable | Fix UTM capture + enforce ICP fields at lead creation | % opportunities that are ICP |
FAQ
What is the best first step in sales funnel optimisation for B2B SaaS?
Define a funnel with one conversion event per stage, then confirm you can tie every event to both a user and an account. Without that, improvements in one tool (ads, CRM, onboarding) will not reconcile with revenue outcomes.
How do I choose an activation event that predicts revenue?
Pick the first moment a user achieves a meaningful outcome without help. Validate it by checking whether accounts that hit it have materially higher retention and higher opportunity creation than those that do not.
How many segments should I use when diagnosing funnel drop-offs?
Start with 3 to 5 segments that change decision-making: ICP vs non-ICP, inbound vs outbound, role (admin vs end user), integration-connected vs not, and fast activators vs slow activators.
What metrics should I report weekly to keep teams aligned?
Stage conversion rates with counts, time between stages, activation-to-opportunity, activation-to-win, and top sources by activated accounts. Add one experiment readout and one segment spotlight to keep the meeting action-oriented.
If you want to implement this measurement-first approach without waiting on engineering sprints, Founder OS can help you capture product usage events, build user and account profiles, and run funnel views that make sales funnel optimisation decisions easier to validate. Start simple: instrument the core events, define activation, and run one weekly leak-fix experiment at a time.
Read Next
View all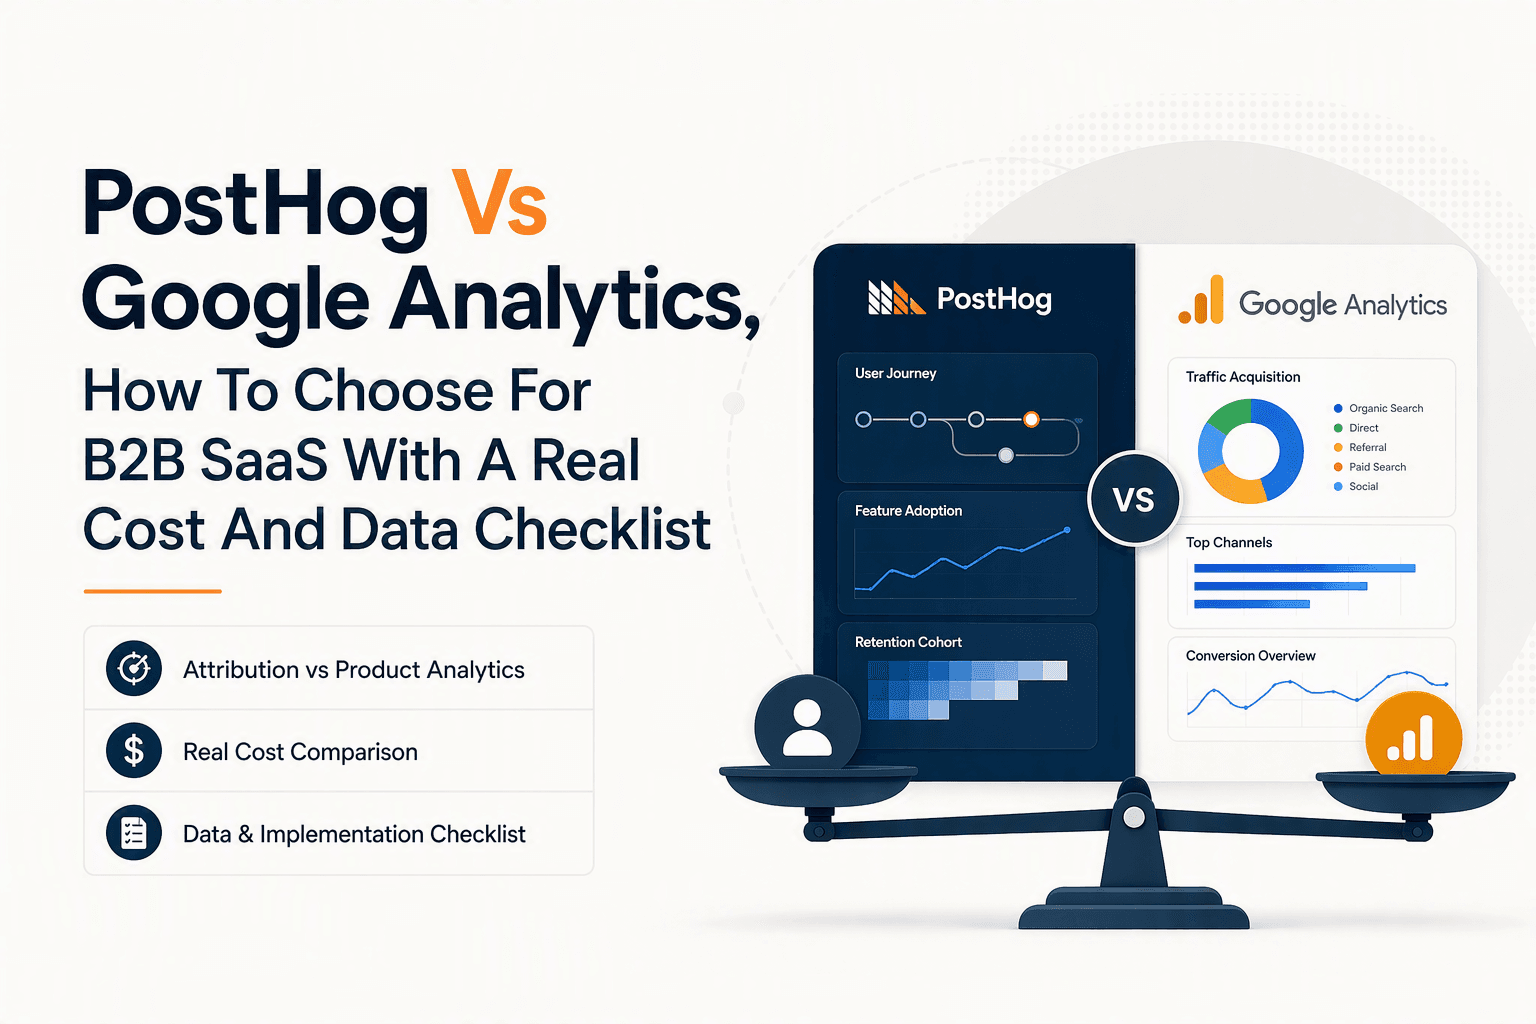
PostHog Vs Google Analytics, How To Choose For B2B SaaS With A Real Cost And Data Checklist
posthog vs google analytics for B2B SaaS: compare attribution vs product analytics, real costs at scale, data mismatches, and a 30–60 day run-both plan.
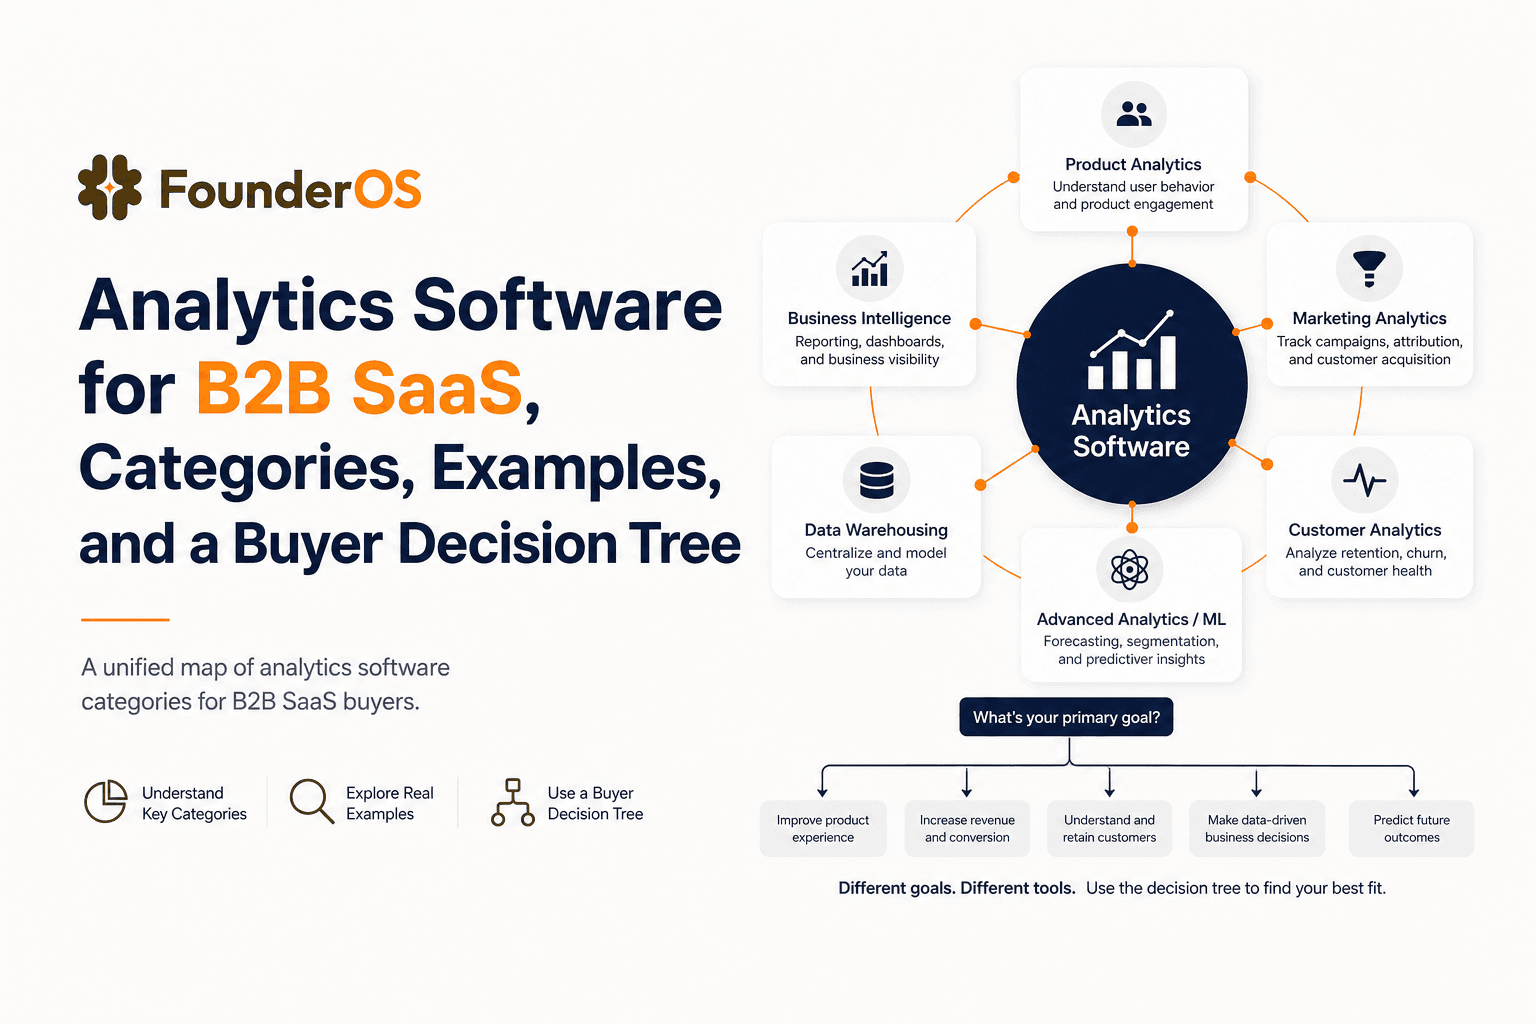
Analytics Software for B2B SaaS, Categories, Examples, and a Buyer Decision Tree
Choose analytics software for B2B SaaS with a clear category map, 10-minute decision tree, real workflows, and a practical buyer checklist.
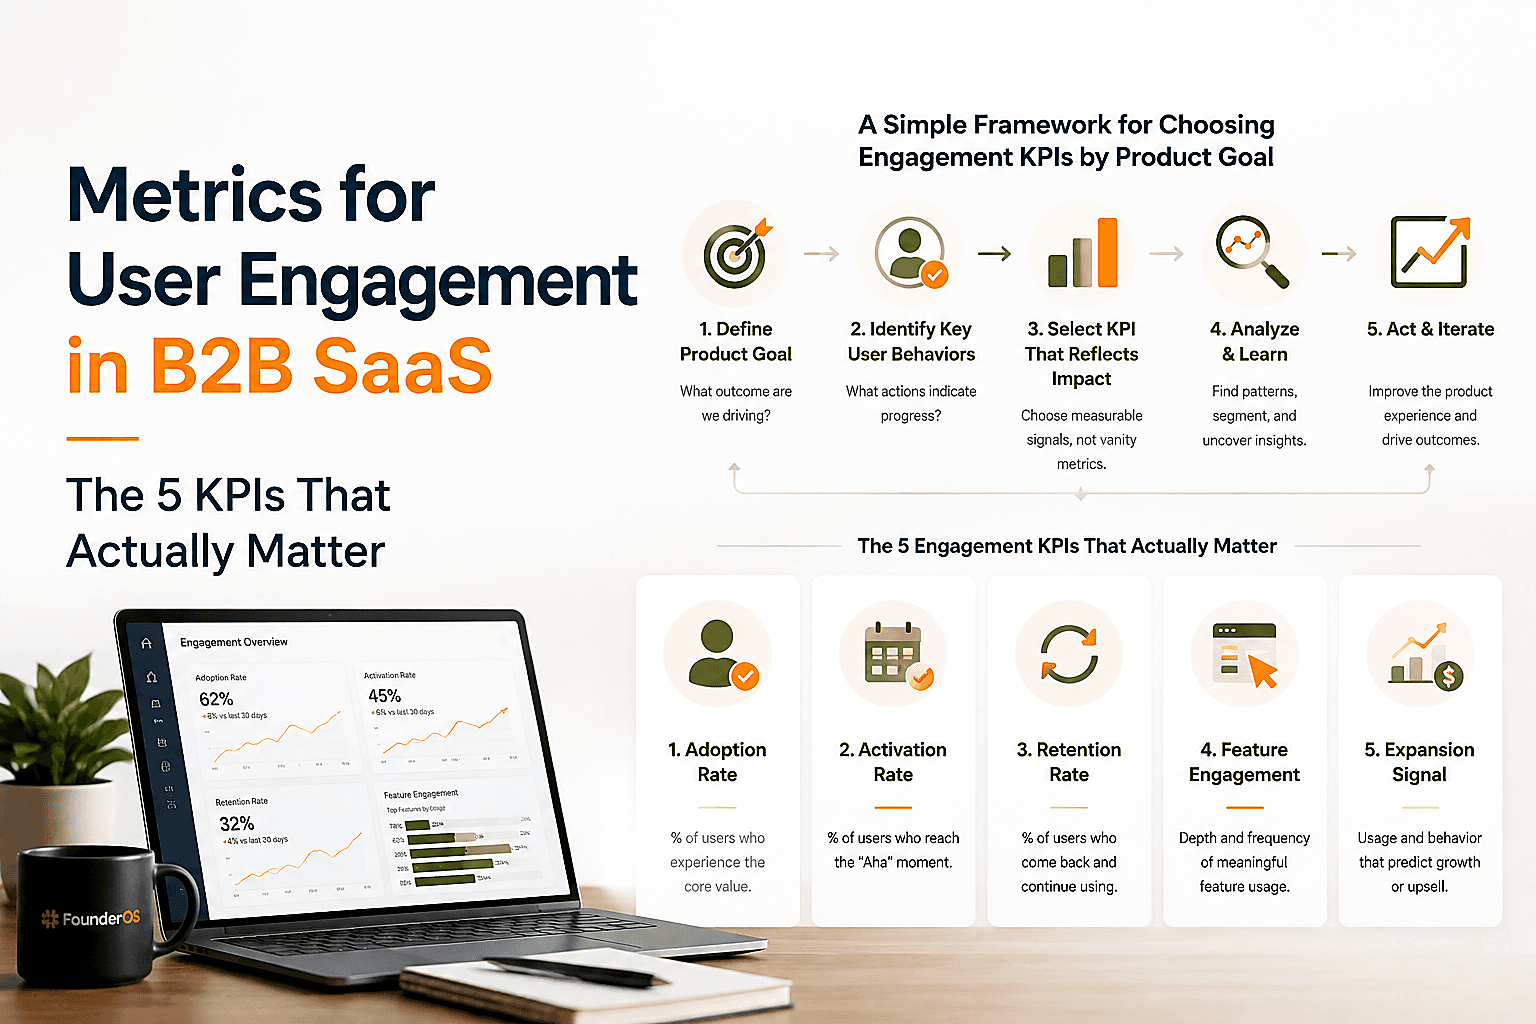
Metrics for User Engagement in B2B SaaS - The 5 KPIs That Actually Matter
Learn metrics for user engagement in B2B SaaS: the 5 KPIs, formulas, benchmarks, and a weekly review process that links engagement to retention and revenue.