
Funnel Optimization for B2B SaaS, A Measurement-First System That Prioritizes What To Fix

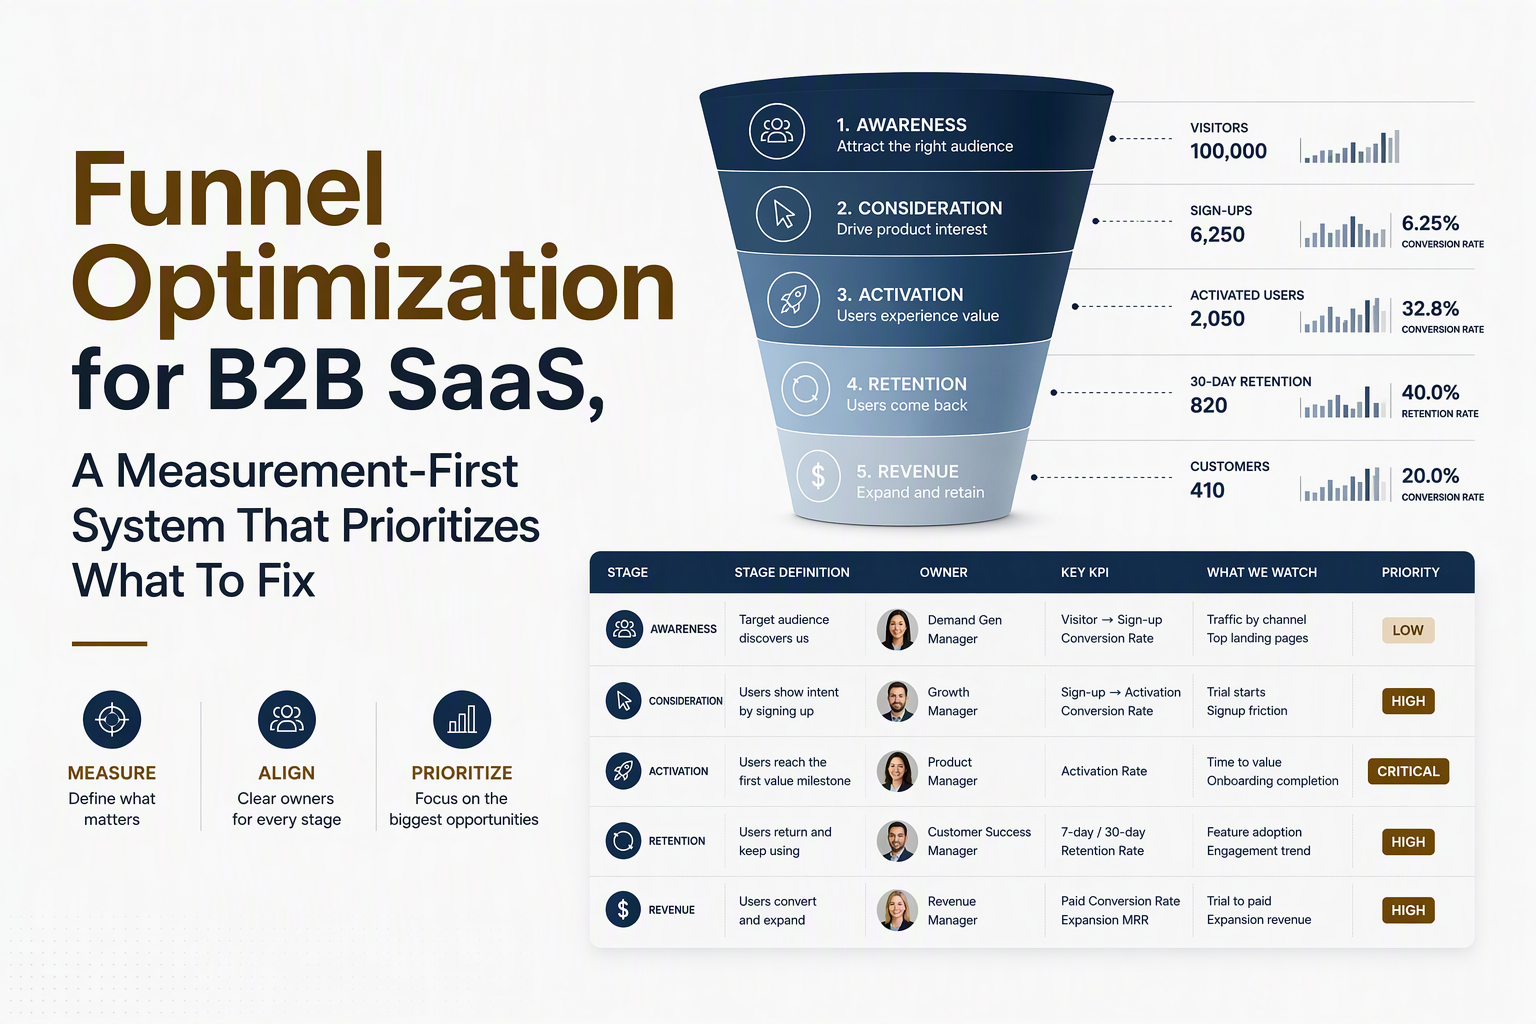
Funnel optimization for B2B SaaS works best when you treat it as a measurement system, not a collection of landing page tweaks, so every fix is tied to a specific drop-off, segment, and revenue-impact hypothesis.
- Standardize one 5-stage journey with clear owners and KPIs so everyone optimizes the same thing.
- Instrument events and validate them before you diagnose leaks, or you will “fix” tracking noise.
- Prioritize tests with expected value (impact × confidence ÷ effort) to avoid shipping low-leverage experiments.
Define the funnel you are actually optimizing
A measurable funnel is a fixed set of stages with unambiguous entry and exit events, owners, and KPIs that do not change week to week.
Use a 5-stage SaaS model that matches how buyers behave
I keep teams aligned by standardizing on five stages that map cleanly to both product usage and revenue milestones:
- Visit: first landing session (entry event: session_start or page_view).
- Signup: account created (entry: sign_up, exit: first_login).
- Activation: user reaches “Aha” (exit: activation_event, defined per product).
- Engagement: repeated core actions (exit: engaged_week, e.g., 2+ core events in 7 days).
- Revenue: trial to paid, expansion, or renewal (exit: purchase, subscription_start, invoice_paid).
Write stage definitions as event rules, not narratives
To avoid debates later, define every stage as a rule you could implement in analytics tomorrow:
- One primary conversion event per stage: activation_event beats “got value.”
- One time window where it matters: activation within 7 days of signup is different from activation “eventually.”
- One unit of analysis: user for self-serve, account for sales-led, both for mixed motions.
Assign owners and KPIs so optimization does not stall
Here is a decision-grade ownership pattern that I have seen work in small B2B SaaS teams (you can adjust titles, but keep the accountability):
- Visit to Signup: Growth or Marketing. KPI: signup rate by channel and landing page.
- Signup to Activation: Product. KPI: activation rate, time-to-activation.
- Activation to Engagement: Product and CS. KPI: engaged users in week 1 and week 4.
- Engagement to Revenue: Sales, Product, and Finance. KPI: trial-to-paid, expansion rate, churn.
This single-page definition becomes the “contract” for funnel optimization: if a test cannot be mapped to one stage KPI, it is probably a distraction.
Instrumentation that makes funnel optimization possible
Reliable funnel optimization requires an event schema, conversion definitions, and validation checks that prevent you from optimizing on broken tracking.
Start with a GA4-first event schema that is stable
Even if you use a product analytics tool, a GA4-compatible schema keeps your data portable and makes reporting easier. At minimum, implement:
- Core events: sign_up, login, activation_event, core_feature_used, subscription_start.
- Common parameters: user_id, account_id, plan, source, device_category, page_location, experiment_variant.
- Content mapping: page_type (pricing, docs, onboarding, app), not just URLs.
If your product has multiple personas, add role (admin, member) as a first-class property, because admin activation often predicts revenue better than member activity.
Configure conversions and a funnel exploration you can trust
Set each stage exit event as a conversion, then build one canonical funnel report with the same steps every week. The important part is consistency, not complexity. If you need a practical walkthrough, the fastest path is to start with analytics events tracking that is explicitly tied to KPIs, then graduate to deeper funnel analysis once your event quality is stable.
Run a tracking validation checklist before diagnosing drop-offs
This is the checklist I use before I let anyone ship a “fix the funnel” experiment:
- Uniqueness: sign_up fires once per account, not once per page refresh.
- Identity: anonymous_id correctly merges into user_id after signup.
- Ordering: activation_event cannot occur before sign_up in the same user journey.
- Coverage: events fire on web and mobile if both exist; watch for ad blockers on web.
- Backfill plan: you know what happens to historical data if you rename events.
In practice, the identity merge check catches a surprising amount of “fake churn” in early-stage SaaS, where a user appears as multiple profiles and your engagement rate looks worse than reality.
Diagnose leaks by segment, not averages
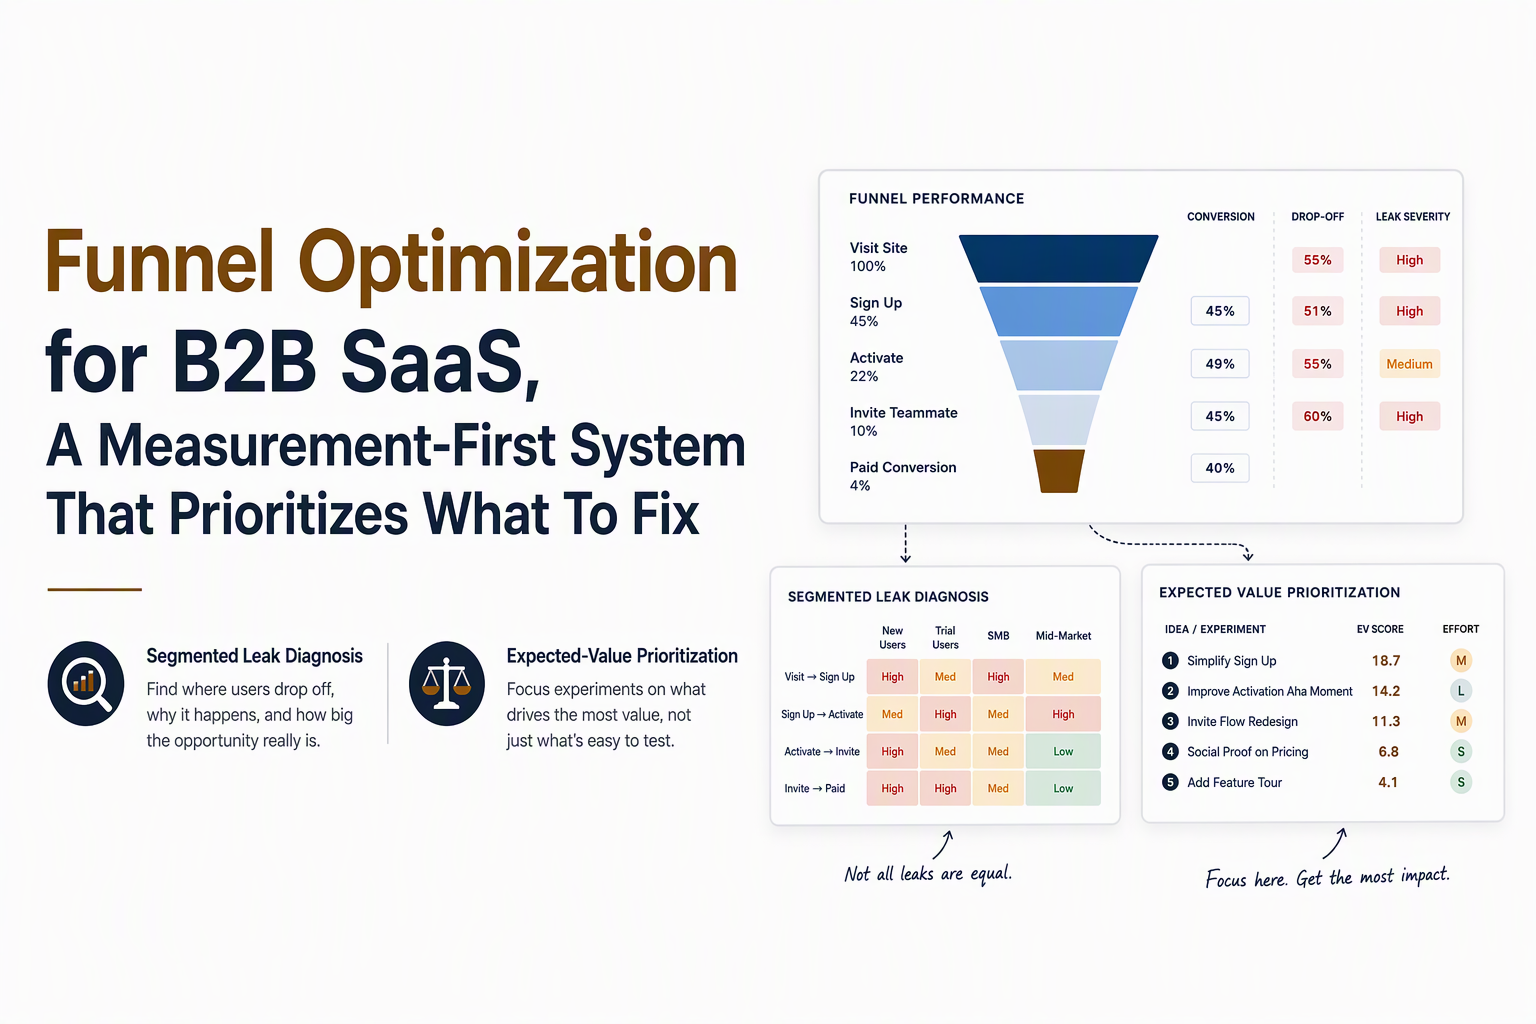
Segment-level diagnosis turns funnel optimization from guesswork into a targeted fix because the same drop-off rate can mean different problems across cohorts.
Use a minimum segmentation set that maps to action
Start with segments you can actually act on within two weeks:
- Acquisition: source and campaign, plus landing page group.
- Intent: visited pricing, started trial, requested demo.
- Fit: company size band, role, industry (only if you capture it reliably).
- Context: device category, browser, geography (for latency and compliance issues).
If you want more depth on the mechanics, conversion funnel analysis becomes significantly more actionable when every chart has a segment toggle that answers “who is this broken for?”
Classify drop-offs as friction, intent, or lead quality
A simple classification prevents you from “optimizing” the wrong thing:
- Friction problem: sharp drop-off on one device or browser; session replays show rage clicks; time-to-step spikes.
- Intent problem: low conversion but high time on page and high docs views; users are researching, not ready.
- Quality problem: one channel converts to signup but fails activation and revenue; the targeting is off.
I have repeatedly seen teams waste a sprint polishing onboarding when the real issue was lead quality from a new channel. Segmenting by source made the root cause obvious within an hour.
Drill down from aggregate to user paths responsibly
Use individual journey inspection to generate hypotheses, but confirm with counts. A safe workflow is:
- Find the worst stage drop-off by segment.
- Pull 20 to 30 user paths from that segment around the drop-off step.
- Write 2 to 3 hypotheses, each tied to one measurable change (for example, reduce time-to-activation, increase core_feature_used).
- Validate that the pattern appears across enough users to matter.
A quantitative funnel optimization strategy for prioritizing tests
A prioritization model based on expected value prevents teams from shipping low-impact experiments that look “busy” but do not move revenue.
Use expected value, not gut feel
For each proposed experiment, compute:
- Impact: expected lift in a stage conversion rate or downstream revenue.
- Reach: number of users or accounts affected per week.
- Confidence: evidence quality (tracking certainty, user research, past tests).
- Effort: engineering and design time, plus risk.
A practical scoring formula:
Score = (Impact % × Reach) × Confidence (0.1 to 1.0) ÷ Effort (1 to 5)
Worked example with transparent assumptions
Assume a self-serve SaaS with 500 signups per week. Activation is 20% within 7 days, and trial-to-paid among activated users is 25%. You are choosing between three experiments:
- Experiment A: Simplify signup form, expected +10% relative signup completion (confidence 0.5, effort 2).
- Experiment B: Add an onboarding checklist to drive activation, expected +15% relative activation (confidence 0.6, effort 3).
- Experiment C: Pricing page clarity update, expected +5% relative trial-to-paid for activated users (confidence 0.4, effort 2).
Translate each into expected incremental paid users per week:
- A: If 500 signups is after form completion, impact is zero. If 500 is started signups and completion is 50%, then +10% relative completion yields +25 extra signups. Downstream: 25 × 20% × 25% = 1.25 extra paid users/week.
- B: Activated users baseline: 500 × 20% = 100. +15% relative activation adds 15 activated. Downstream: 15 × 25% = 3.75 extra paid users/week.
- C: Baseline paid users: 100 × 25% = 25. +5% relative adds 1.25 extra paid users/week.
Even before scoring, B is the clear leader on expected paid impact, and it is often easier to validate because activation metrics move faster than revenue. This is where funnel optimization becomes a finance-aligned decision, not a design debate.
Funnel optimization examples with before-after numbers
Small, well-measured experiments compound when you report the same three numbers every time: baseline rate, new rate, and what segment moved.
Example 1: Landing page message match by channel
| Item | Baseline | Change | After | Notes |
|---|---|---|---|---|
| Signup rate (Paid Search segment) | 2.0% | +0.4 pp | 2.4% | Segment-specific copy and CTA, measured per landing group |
Design: Split by campaign intent. Keep the control page intact. Only change headline, proof, and first CTA. Guardrail: activation rate for that segment should not drop.
Example 2: Signup friction removal with identity-proof
| Item | Baseline | Change | After | Notes |
|---|---|---|---|---|
| Signup completion (Mobile) | 48% | +6 pp | 54% | Removed optional fields, fixed autofill bugs, validated event uniqueness |
Design: Measure form_step_view and form_step_complete events. Checklist: confirm sign_up fires once per account and that anonymous-to-user merge works, or you will misread completion.
Example 3: Activation path with a single “next best action”
| Item | Baseline | Change | After | Notes |
|---|---|---|---|---|
| Activation within 7 days (All) | 20% | +3 pp | 23% | Guided users to one core action, reduced choice overload |
Design: Create a single onboarding path that ends at activation_event. Track time-to-activation and drop-offs per persona. For deeper activation work, align on what you are measuring by using activation metrics that correlate with later paid conversion.
Example 4: Retention micro-funnel focused on repeated value
| Item | Baseline | Change | After | Notes |
|---|---|---|---|---|
| Engaged in week 2 among activated | 35% | +4 pp | 39% | Email plus in-app prompt triggered by non-use of core feature |
Design: Build a segment: activated AND no core_feature_used in last 5 days. Trigger a lightweight nudge that points to one repeatable workflow. I prefer this over generic “come back” emails because it ties directly to a measurable micro-funnel.
Is the funnel dead, and what to optimize instead
Non-linear journeys do not kill funnel optimization, but they do require you to optimize micro-funnels, assisted conversions, and retention loops instead of pretending every user moves in a straight line.
Replace one big funnel with micro-funnels tied to outcomes
In B2B SaaS, a buyer might visit pricing, read docs, watch a webinar, then come back weeks later. The fix is not abandoning measurement, it is defining micro-funnels such as:
- Pricing assist funnel: pricing_view → demo_request or trial_start within 14 days.
- Onboarding micro-funnel: first_login → connect_integration → first_core_result.
- Retention loop: core_feature_used → saved_artifact → shared_with_teammate → return_use.
Measure assisted conversions with clear attribution rules
If you only credit the last click, you will under-invest in education and over-invest in high-intent pages. A practical setup is to report:
- Last-touch: what closed the conversion.
- Assist rate: which pages or actions appear in journeys that convert.
- Time-to-convert distribution: median and 75th percentile, so you do not call a campaign “bad” too early.
When I add assisted reporting, the immediate win is prioritization clarity: “docs readers convert later” becomes an evidence-backed reason to improve docs discoverability rather than a vague belief.
Keep the system honest with one weekly operating rhythm
Make funnel optimization sustainable by running a weekly cadence:
- 30 minutes: review stage KPIs and segment deltas.
- 30 minutes: pick one leak to investigate and write hypotheses.
- 30 minutes: prioritize the next test with the scoring model.
If you want a tactical guide for picking the highest-leverage fix, the workflow in optimize conversion funnel is a good complement to the measurement-first approach above.
FAQ
If you want to implement this measurement-first funnel optimization system quickly, Founder OS can get you from events to funnels to segments and onboarding experiments in one place: install tracking, define your activation funnel, create 2 to 3 behavioral segments, then run your first three prioritized tests. Start free or book a demo to set up the events, reports, and onboarding flow in a single working session.

Written by Sophia Nguyen
Growth Product | Helping founders build products users love.
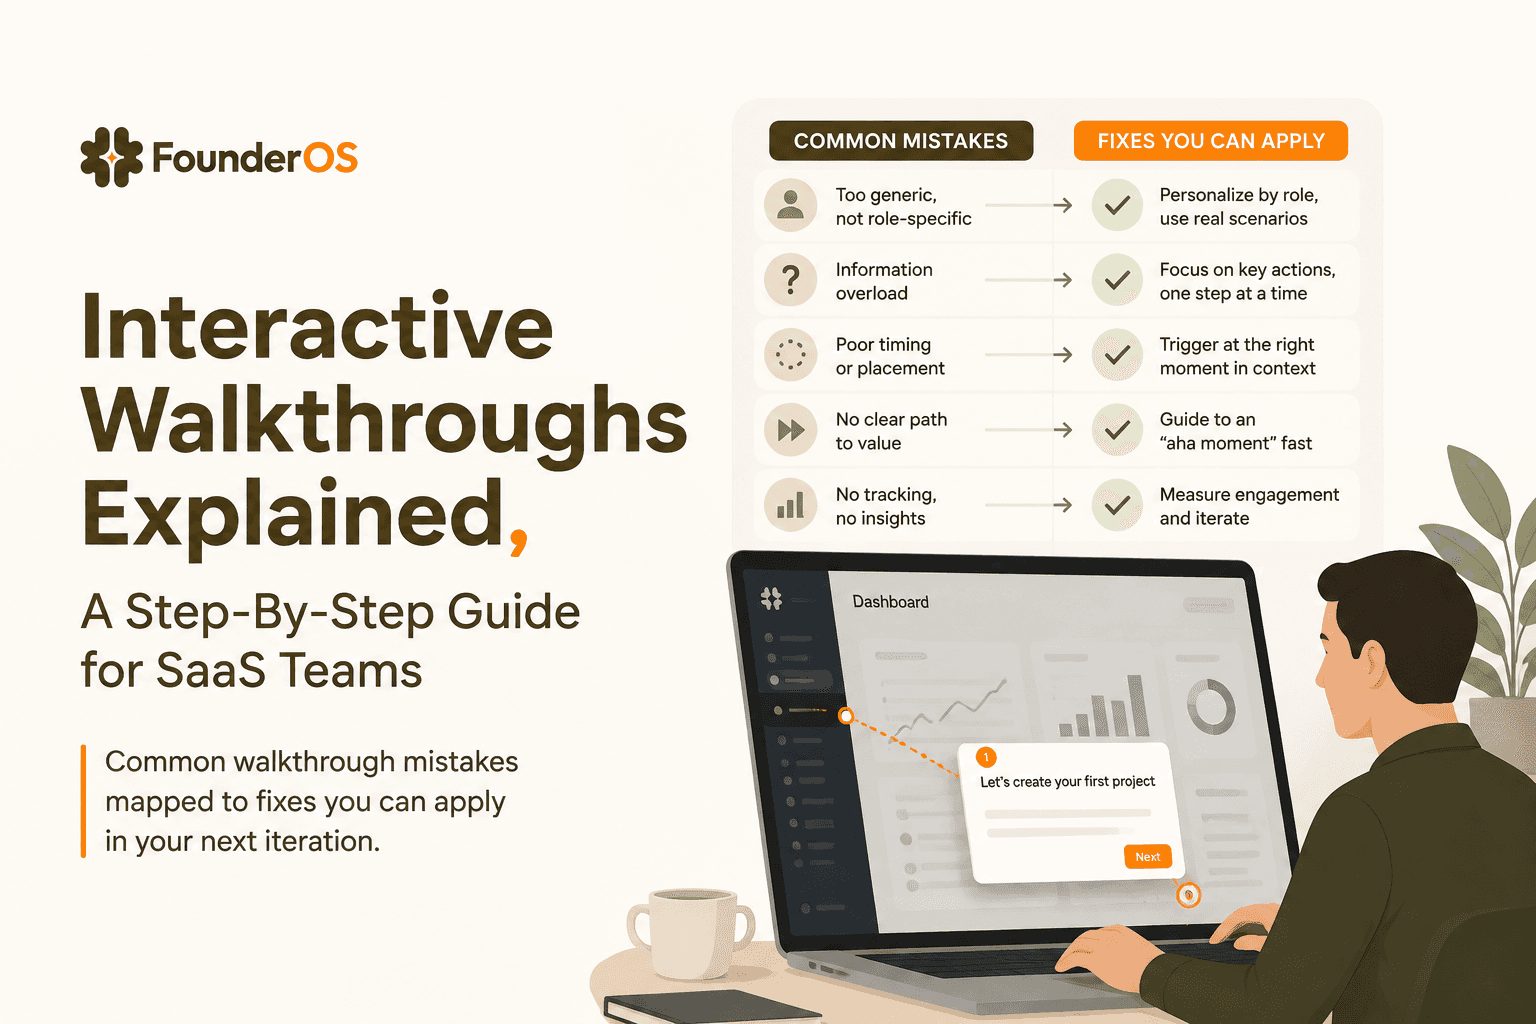
Interactive Walkthroughs Explained, A Step-By-Step Guide for SaaS Teams
Learn what an interactive walkthrough is, where it works best, and how to build one step by step without engineering help.
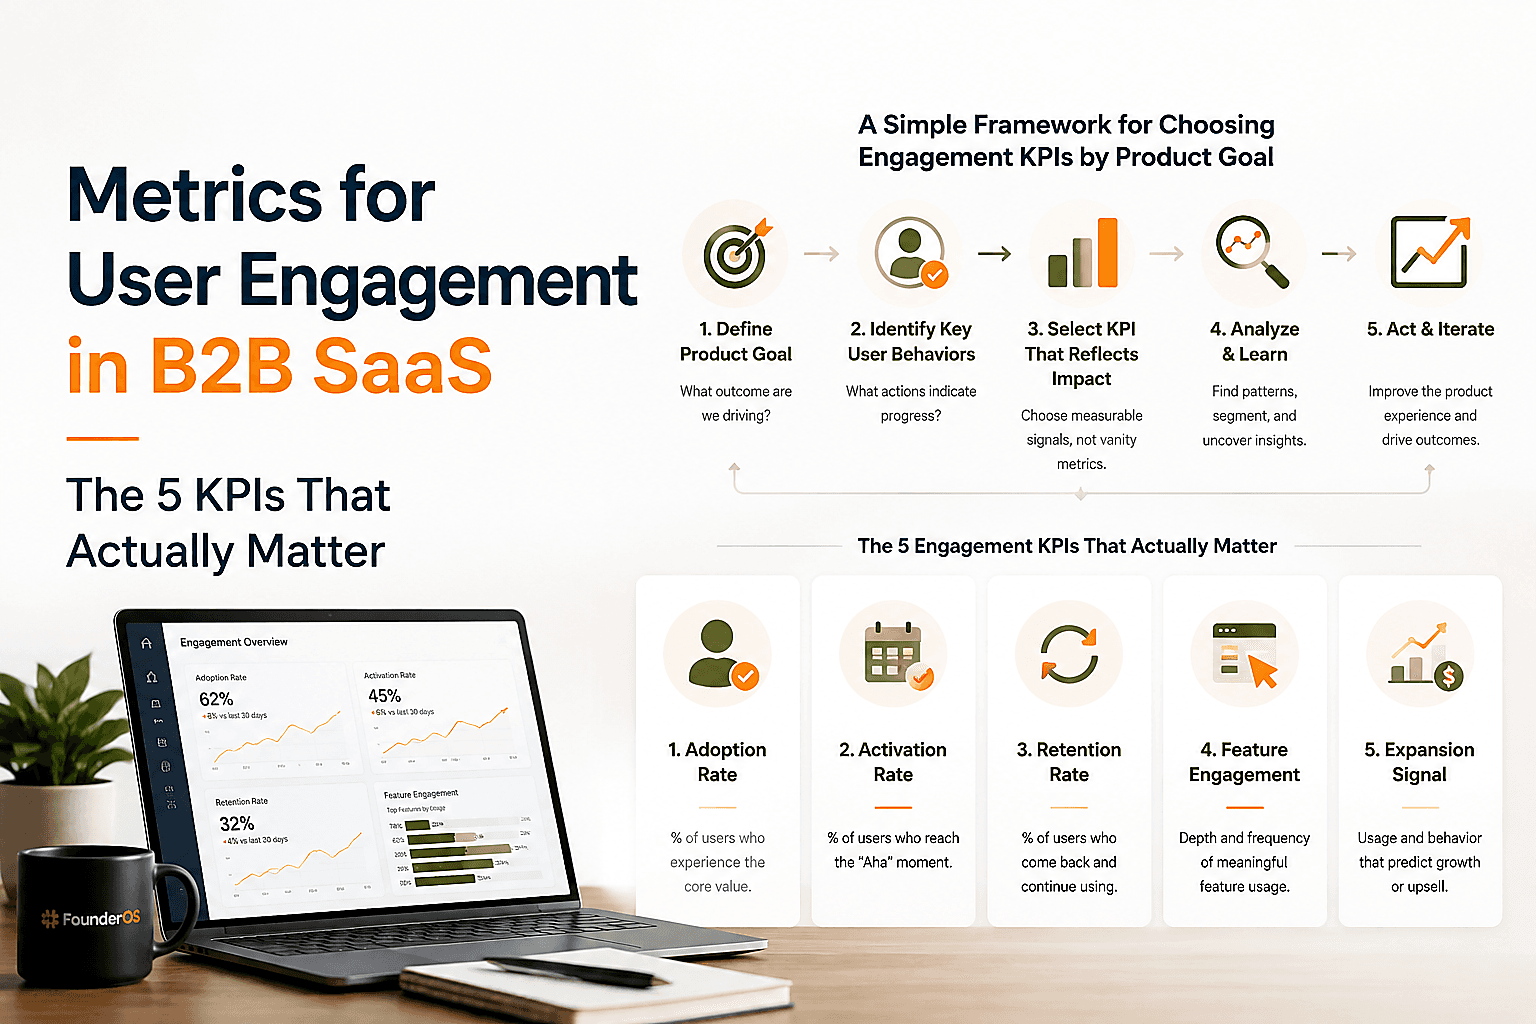
Metrics for User Engagement in B2B SaaS - The 5 KPIs That Actually Matter
Learn metrics for user engagement in B2B SaaS: the 5 KPIs, formulas, benchmarks, and a weekly review process that links engagement to retention and revenue.

Conversion Funnels for B2B SaaS, the Setup and Tool Checklist That Prevents Bad Decisions
Build decision-grade conversion funnels for B2B SaaS: event steps, instrumentation rules, segmentation defaults, and a tool checklist.