
Conversion Funnel Optimisation for SaaS with Benchmarks, Instrumentation, and a Repeatable Experiment Loop
Learn conversion funnel optimisation with instrumentation rules, benchmarks, leak diagnosis, and a repeatable experiment loop for SaaS growth.
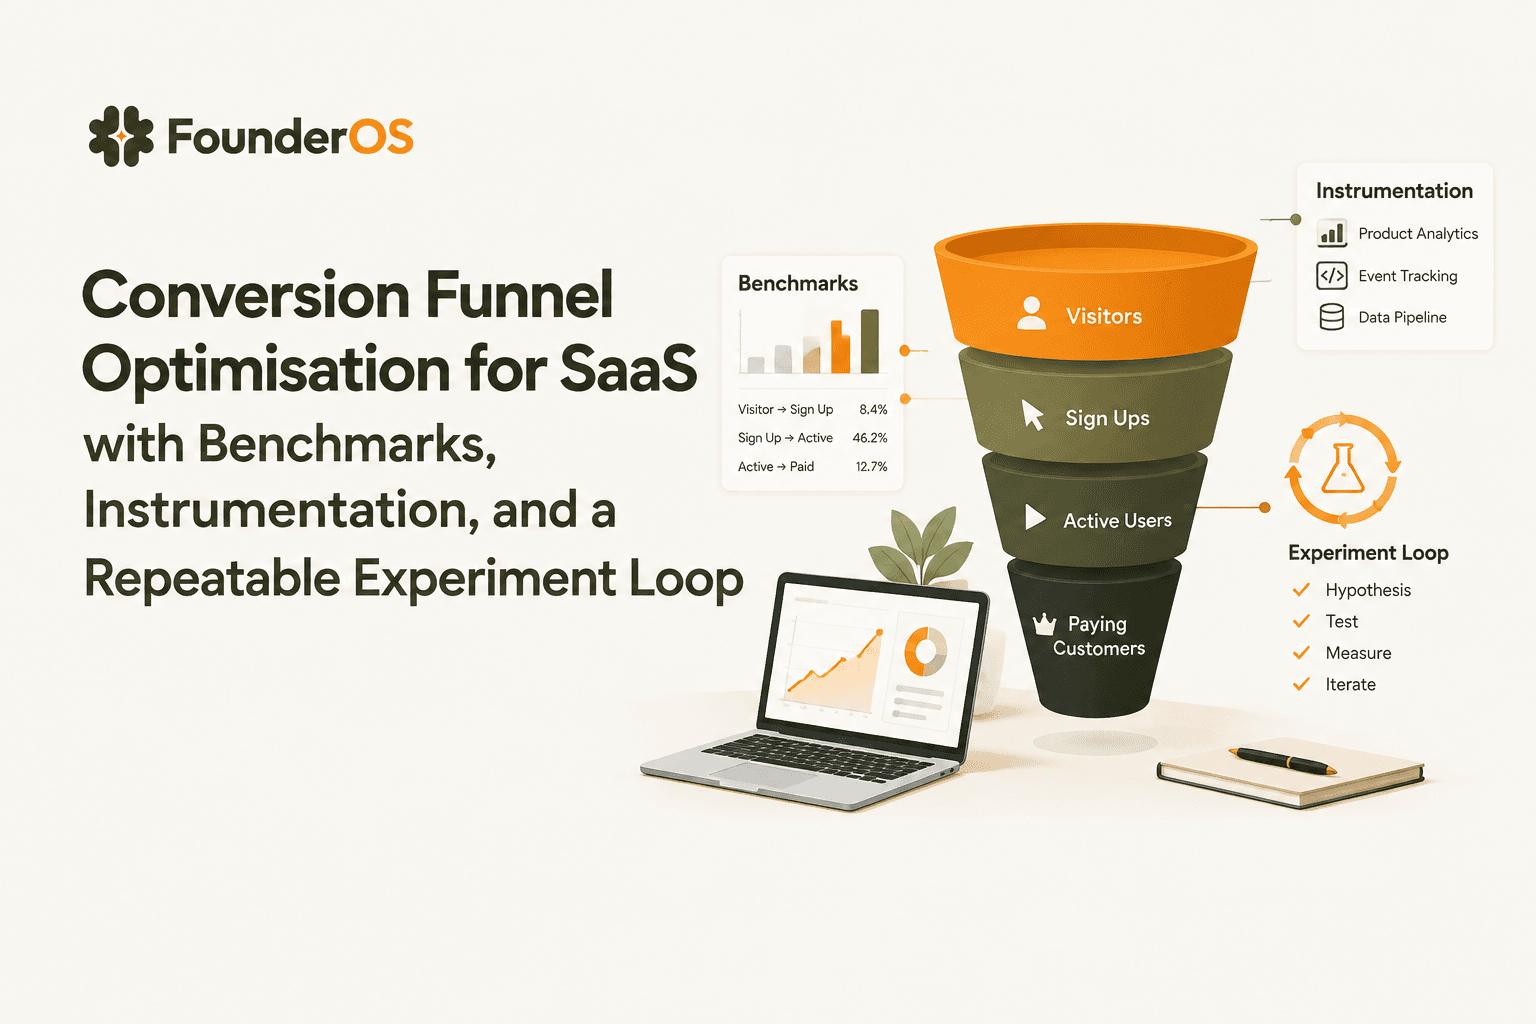
Conversion funnel optimisation is the practice of improving step-by-step user progression by measuring each step with clean events, finding the biggest drop-off, and proving lift with controlled experiments. The fastest way to get reliable wins is to treat the funnel like a measurement system first, then a UX problem second, so you do not optimize based on misleading data.
- Instrument the funnel first: clear event names, identity stitching, and data-quality checks prevent “false drop-offs.”
- Diagnose the biggest leak with a repeatable workflow: funnel view for step loss, flow view for paths, cohort view for time-based differences.
- Run fewer, higher-confidence tests: predefine success metrics, guardrails, and minimum detectable effect to avoid noisy “wins.”
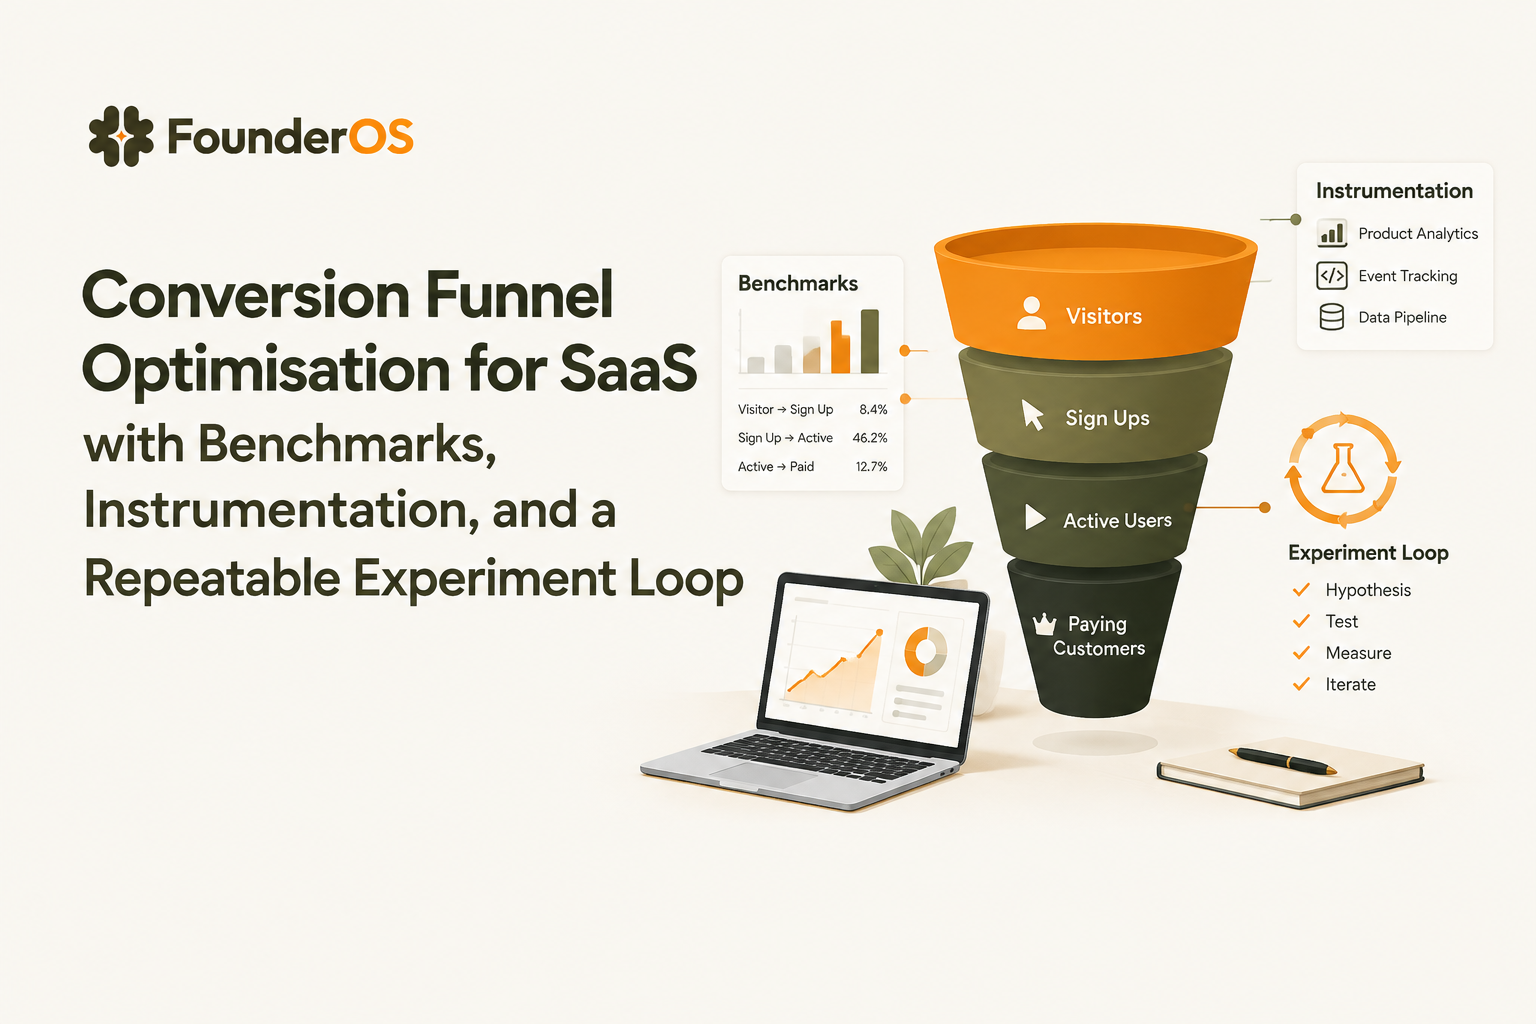
Define your funnel like a scientist with events, identity, and data-quality checks
Accurate conversion funnel optimisation starts with instrumentation that makes each step unambiguous and comparable over time. If the tracking layer is inconsistent, every downstream improvement effort becomes guesswork.
Step 1: Write a measurement spec that ties each step to a user intent
- Name the funnel and its purpose: “Trial activation” or “Demo request completion.”
- Define the unit of analysis: user, account, or session (pick one per funnel).
- Define each step as an observable event: avoid UI descriptions like “Clicked blue button.” Prefer intent like onboarding_completed or integration_connected.
- Define the time window: e.g., step 1 to step 4 within 7 days.
In our experience working with B2B SaaS teams, the most common “conversion problem” is actually a spec problem: steps mix intents (education vs commitment) so the funnel looks worse than it is.
Step 2: Use a consistent event taxonomy and properties
Use a naming convention you can scan quickly and that supports reuse in analytics events tracking:
- Event names: verb_noun format (e.g., signed_up, created_workspace, invited_teammate).
- Required properties per event: environment (prod/sandbox), plan, source, device, and an entity ID (workspace_id, org_id) where relevant.
- Version properties: app_version or experiment_variant to explain sudden shifts.
Step 3: Stitch identity so your funnel counts the right people
Funnels break when anonymous activity is not linked to a known user or when user-to-account mapping changes mid-journey. Minimum rules:
- Anonymous ID: set on first visit.
- Known user ID: set at signup/login, then alias to the anonymous ID.
- Account/workspace ID: attach to events after workspace creation; do not “guess” it earlier.
- One source of truth: decide whether the funnel is user-based or account-based, and keep it consistent.
Step 4: Run four data-quality checks before trusting any drop-off
- Completeness: does every step fire for at least some users each day?
- Order sanity: can step 3 occur without step 2 due to async processing or backfills?
- Duplication: are some events firing multiple times per action (double-clicks, retries)?
- Sampling and blockers: ad blockers, script blockers, or server-side loss that biases channels.
Practical tip: keep a “debug cohort” of internal users and replay their sessions when a step suddenly drops. That catches instrumentation regressions faster than staring at dashboards.
Diagnose the biggest leak with funnel, flow, and cohort views
Reliable conversion funnel optimisation depends on isolating one dominant drop-off cause rather than slicing endlessly by segments. A useful workflow is: confirm the leak in a funnel view, explain it with path analysis, then validate it in cohorts over time.
Step 1: Start with step loss and absolute volume
For each step, record both the percentage drop and the number of users lost. A 40% drop on a low-volume step can be less important than a 10% drop on a high-volume step.
- Leak score (simple): users_lost_at_step = users_at_step_n - users_at_step_n+1.
- Prioritize: largest users_lost_at_step first, unless revenue weighting suggests otherwise.
Step 2: Use flow view to see what users do instead
Step-level funnels show “where” you lose users; flow view shows “where they go.” Common patterns to look for:
- Looping: users repeat the same page/action, suggesting confusion.
- Dead ends: users hit settings/help repeatedly then leave.
- Detours that still convert: users skip a step but complete the goal via another path, meaning your funnel definition is too strict.
What surprised our team was how often “drop-offs” were actually alternative paths: users did the right thing, just not in the order we assumed. Fixing the funnel definition removed weeks of wasted optimization work.
Step 3: Segment only after you have a single suspected failure mode
Segmentation works best when you have a hypothesis to test. Examples:
- Acquisition source: paid search users might need different onboarding than referrals.
- Company size proxy: team invites matter more for multi-seat accounts.
- Device and browser: mobile friction or browser-specific bugs can create false “UX” narratives.
Step 4: Validate in cohorts to separate “newness” from “regression”
Cohort views answer whether the leak is persistent or tied to a period. Cohort questions worth asking:
- By signup week: did the drop start after a release?
- By first-seen channel: did a campaign introduce lower-intent users?
- By onboarding version: did a copy change shift time-to-value?
If a leak appears only in recent cohorts, treat it like an incident: investigate releases, experiments, pricing changes, and performance issues before redesigning anything.
Conversion funnel optimisation benchmarks and how to use them without lying to yourself
Benchmarks are useful for conversion funnel optimisation only when they guide questions, not when they become targets to copy. The right way to use benchmarks is to compare step shapes, identify outlier steps, and set realistic experiment expectations.
Use step-level benchmarks, not just overall conversion
Overall conversion hides where the problem lives. Track at least:
- Step conversion: step_n_to_n+1
- Time to convert: median time from step 1 to key activation
- Re-entry rate: % returning to complete later (important for longer sales cycles)
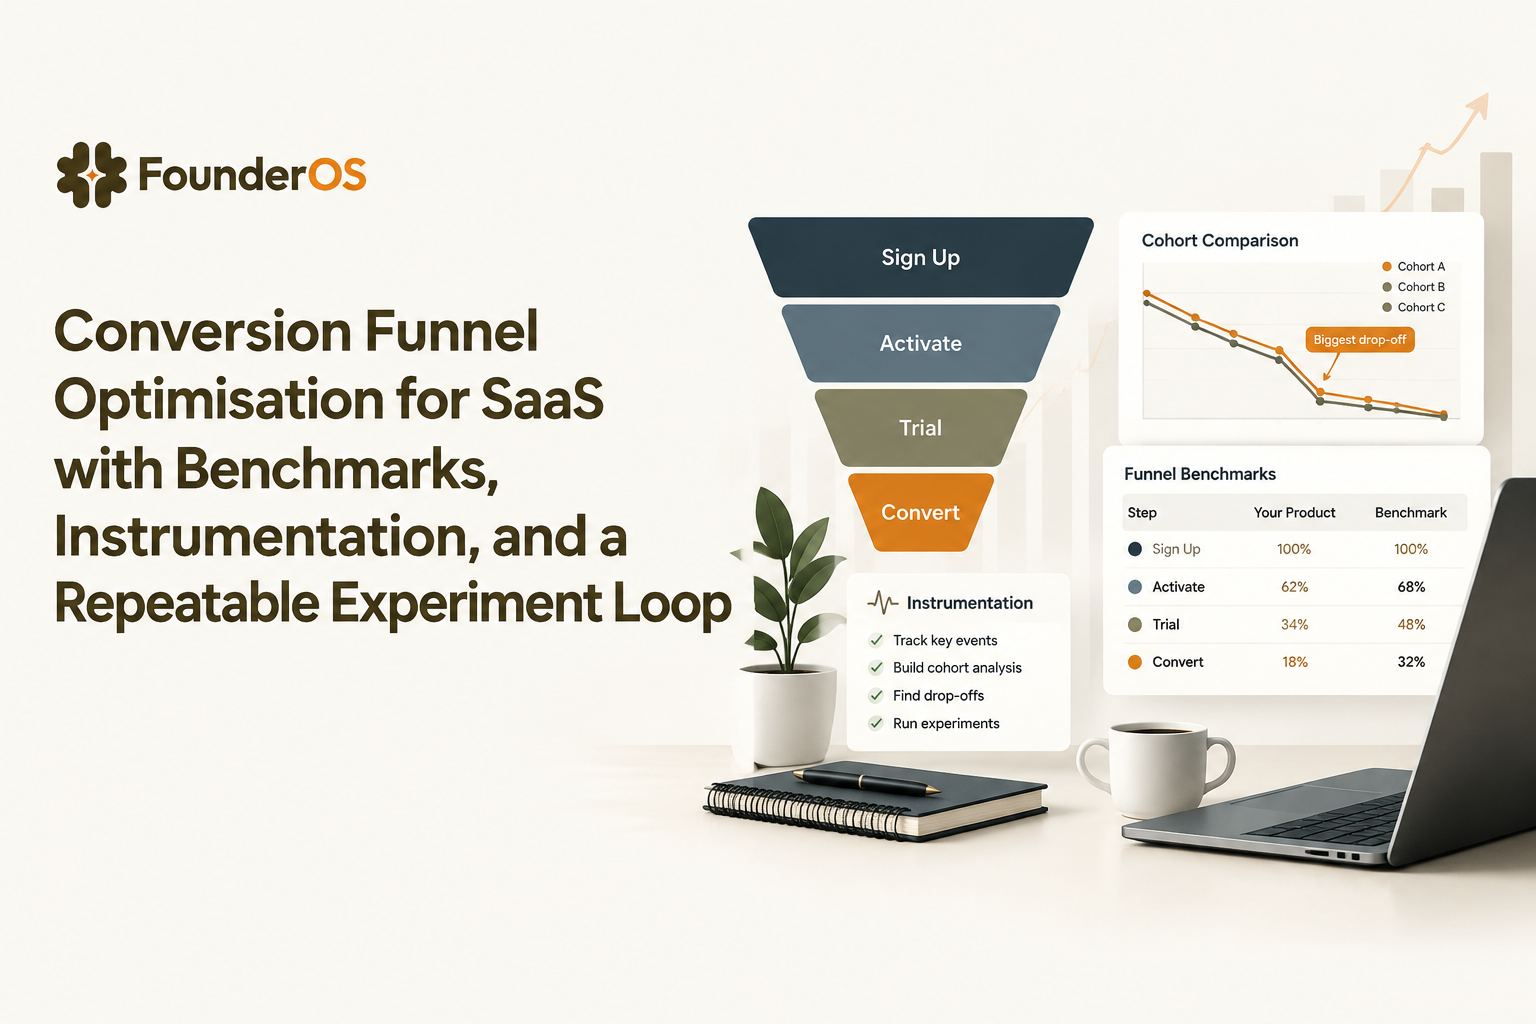
Reference benchmark ranges as “sanity bands”
The table below provides broad sanity bands that we use to sanity-check a funnel, not to claim universal “good.” Differences in traffic quality, pricing, and product complexity can move these ranges substantially.
How to baseline your own funnel before you compare
- Pick one primary conversion window: e.g., 7 days for trial activation, 30 days for lead lifecycle.
- Freeze definitions: do not change step logic mid-baseline period.
- Report both unique users and unique accounts: to catch seat-based dynamics.
- Annotate changes: releases, onboarding updates, pricing, and campaign launches.
If you need a deeper process for turning the numbers into actions, see conversion funnel analysis that actually leads to fixes, including a template for step definitions and hypothesis logging.
Run high-confidence funnel experiments with hypotheses, test design, and success metrics
High-confidence experiments make conversion funnel optimisation sustainable because they separate real lift from noise and seasonality. The core is a disciplined loop: hypothesis, test design, primary metric, guardrails, and interpretation rules before you ship.
A practical experiment checklist you can reuse
- Hypothesis: If we change X for segment Y, then step Z conversion will improve because of mechanism M.
- Primary metric: one step conversion rate (for example, signup to first key action).
- Secondary metrics: time-to-activate, feature adoption, or completion rate of onboarding tasks.
- Guardrails: refund rate, support tickets, error rate, or quality signals (e.g., spam leads).
- Unit and randomization: user-level for onboarding, account-level for pricing or seat prompts.
- Duration rule: run through at least one full business cycle for your traffic pattern; avoid stopping the moment you see green.
- Decision rule: ship only if lift exceeds a practical threshold, not just statistical significance.
Worked metric example with guardrails
Example: your trial funnel is signed_up → created_workspace → connected_integration → activated.
- Primary metric: created_workspace → connected_integration within 3 days.
- Guardrail 1: activation quality, measured as % of users who reach activated within 7 days.
- Guardrail 2: support burden, measured as tickets per 100 new signups.
We initially assumed shortening onboarding would always help, but in practice the winning variants usually remove one decision, not every step. When we kept the “why this matters” context and removed a single configuration choice, completion improved without harming downstream activation quality.
Interpreting results without over-claiming
- Lift only at an early step: verify it does not reduce downstream activation. Early-step lifts can be hollow.
- No lift but better time-to-value: still valuable if it reduces sales cycle or support load.
- Lift concentrated in one segment: ship as targeted experience rather than global change.
If your team needs a step-by-step prioritization approach, optimize conversion funnel work is most predictable when you fix the largest absolute leak first and re-measure before moving on.
Three end-to-end conversion funnel optimisation examples with numbers and before-after lifts
Concrete examples make conversion funnel optimisation easier because they show how instrumentation, diagnosis, and testing connect. The mini-datasets below are illustrative arithmetic examples, meant to show the workflow and calculations, not industry averages.
Example 1: SaaS trial activation via integration-first onboarding
Funnel definition (7-day window): signed_up → created_workspace → connected_integration → first_value_action.
| Step | Before users | Before step CVR | After users | After step CVR |
|---|---|---|---|---|
| signed_up | 1,000 | - | 1,000 | - |
| created_workspace | 720 | 72% | 760 | 76% |
| connected_integration | 310 | 43% | 410 | 54% |
| first_value_action | 180 | 58% | 255 | 62% |
- Diagnosis: largest absolute leak was created_workspace → connected_integration (410 lost before).
- Hypothesis: reducing integration choice paralysis improves connection completion.
- Change: default recommendation plus “connect later” path that preserves momentum.
- Observed lift: connected_integration step CVR improved from 43% to 54% (relative +25.6%).
Example 2: Demo request lead-gen with quality guardrails
Funnel definition (same-session): pricing_page_view → demo_form_started → demo_form_submitted → qualified_lead.
| Step | Before users | After users | Notes |
|---|---|---|---|
| pricing_page_view | 5,000 | 5,000 | Stable traffic |
| demo_form_started | 650 | 720 | Shorter form above the fold |
| demo_form_submitted | 390 | 430 | Removed two low-signal fields |
| qualified_lead | 210 | 215 | Guardrail: lead quality maintained |
- Primary metric: demo_form_started → demo_form_submitted.
- Guardrail: qualified_lead rate (do not trade volume for junk).
- Interpretation: form completion improved, but quality stayed flat, so the win is operational efficiency (more submissions for same qualified volume) rather than revenue lift.
Example 3: Ecommerce checkout by removing a single friction point
Funnel definition (24-hour window): product_view → add_to_cart → begin_checkout → purchase.
| Step | Before users | Before step CVR | After users | After step CVR |
|---|---|---|---|---|
| product_view | 10,000 | - | 10,000 | - |
| add_to_cart | 1,400 | 14% | 1,520 | 15.2% |
| begin_checkout | 820 | 58.6% | 980 | 64.5% |
| purchase | 410 | 50% | 530 | 54.1% |
- Diagnosis: begin_checkout → purchase was the biggest revenue leak.
- Change: removed mandatory account creation, switched to guest checkout with optional account after purchase.
- Observed lift: purchases increased from 410 to 530 per 10,000 product views (relative +29.3%).
These examples are why conversion funnel optimisation should be treated as an engineering-like loop: define events, verify identity, diagnose the dominant leak, test a mechanism, then re-measure end-to-end.
Modern funnels for non-linear journeys and retention loops
Modern conversion work stays relevant when you model multiple entry points and re-entry behavior instead of assuming a single straight path. Many SaaS journeys include switching devices, inviting teammates later, or returning after a sales call, so your analysis should allow “progress by loops.”
Replace single-path thinking with a “milestone system”
- Milestones: signup, first configuration, first value, team adoption, renewal.
- Multiple valid paths: users can reach first value via different features; your instrumentation should support that.
- Re-entry measurement: track how many users return and complete a milestone within 1, 3, 7, or 14 days.
Connect conversion to activation and retention metrics
Optimizing only the earliest step can backfire if it lowers downstream success. Tie your work to activation and later engagement:
- Activation definition: choose one “value moment” that correlates with retention, then build your onboarding and funnel steps around it.
- Retention signal: measure whether users who pass step 3 actually return in week 2.
If you want a rigorous way to define and calculate activation, reference activation rate and common pitfalls like counting “setup actions” that do not predict ongoing usage.
Operationalize with weekly review and change control
- Weekly: review step conversion, time-to-milestone, and top leaks by absolute users.
- Change control: every tracking change gets an annotation and a validation checklist.
- Experiment cadence: fewer tests, clearer reads, stronger documentation.
For onboarding-specific work, pair your analytics with a structured saas customer onboarding process so your funnel steps map to an actual sequence, not a random set of screens.
| Funnel type | Typical steps | Step CVR sanity bands | How to use the benchmark |
|---|---|---|---|
| SaaS trial activation | signup → workspace → key setup → first value | signup→workspace: 60% to 85% workspace→setup: 30% to 70% setup→first value: 40% to 75% |
Find the step with the largest absolute loss, then check if the definition matches a real “intent” milestone. |
| Lead-gen demo request | landing view → form start → submit → qualified | view→start: 5% to 20% start→submit: 40% to 75% submit→qualified: varies by ICP fit |
Always pair conversion with quality guardrails so you do not optimize for spam. |
| Ecommerce checkout | product view → cart → checkout → purchase | view→cart: 5% to 20% cart→checkout: 40% to 70% checkout→purchase: 30% to 70% |
Use bands to spot broken steps (payment errors, shipping surprises) before redesign work. |
FAQ on conversion funnel optimisation
How many steps should a conversion funnel have?
Most teams get the clearest diagnosis with 4 to 7 steps, where each step represents a distinct user intent. If you need more than 7, group micro-actions into a milestone event so the funnel stays readable and testable.
What is the biggest reason funnels show fake drop-offs?
The biggest cause is inconsistent event definitions or identity stitching issues, such as users starting anonymously on one device and finishing logged-in on another. Run completeness, ordering, and duplication checks before interpreting any drop.
Should I optimize the first step or the biggest leak?
Prioritize the biggest absolute leak unless there is strong evidence the first step is constraining volume. Improving an early step that does not change downstream activation often creates “empty” growth.
How do I prove an improvement is real?
Predefine a primary step metric, add at least one downstream guardrail metric, and keep the test running long enough to cover your normal traffic variability. Avoid changing tracking or UX mid-test without annotating and validating the data.
If you want a faster way to implement this conversion funnel optimisation loop without waiting on a data team, Founder OS combines product tracking, user profiles, segmentation, funnels, and onboarding flows so you can instrument steps, see drop-offs, and ship improvements with a clearer feedback cycle. Grab the worksheet, then install Founder OS once to start capturing the journey and turning drop-offs into experiments you can actually validate.
Read Next
View all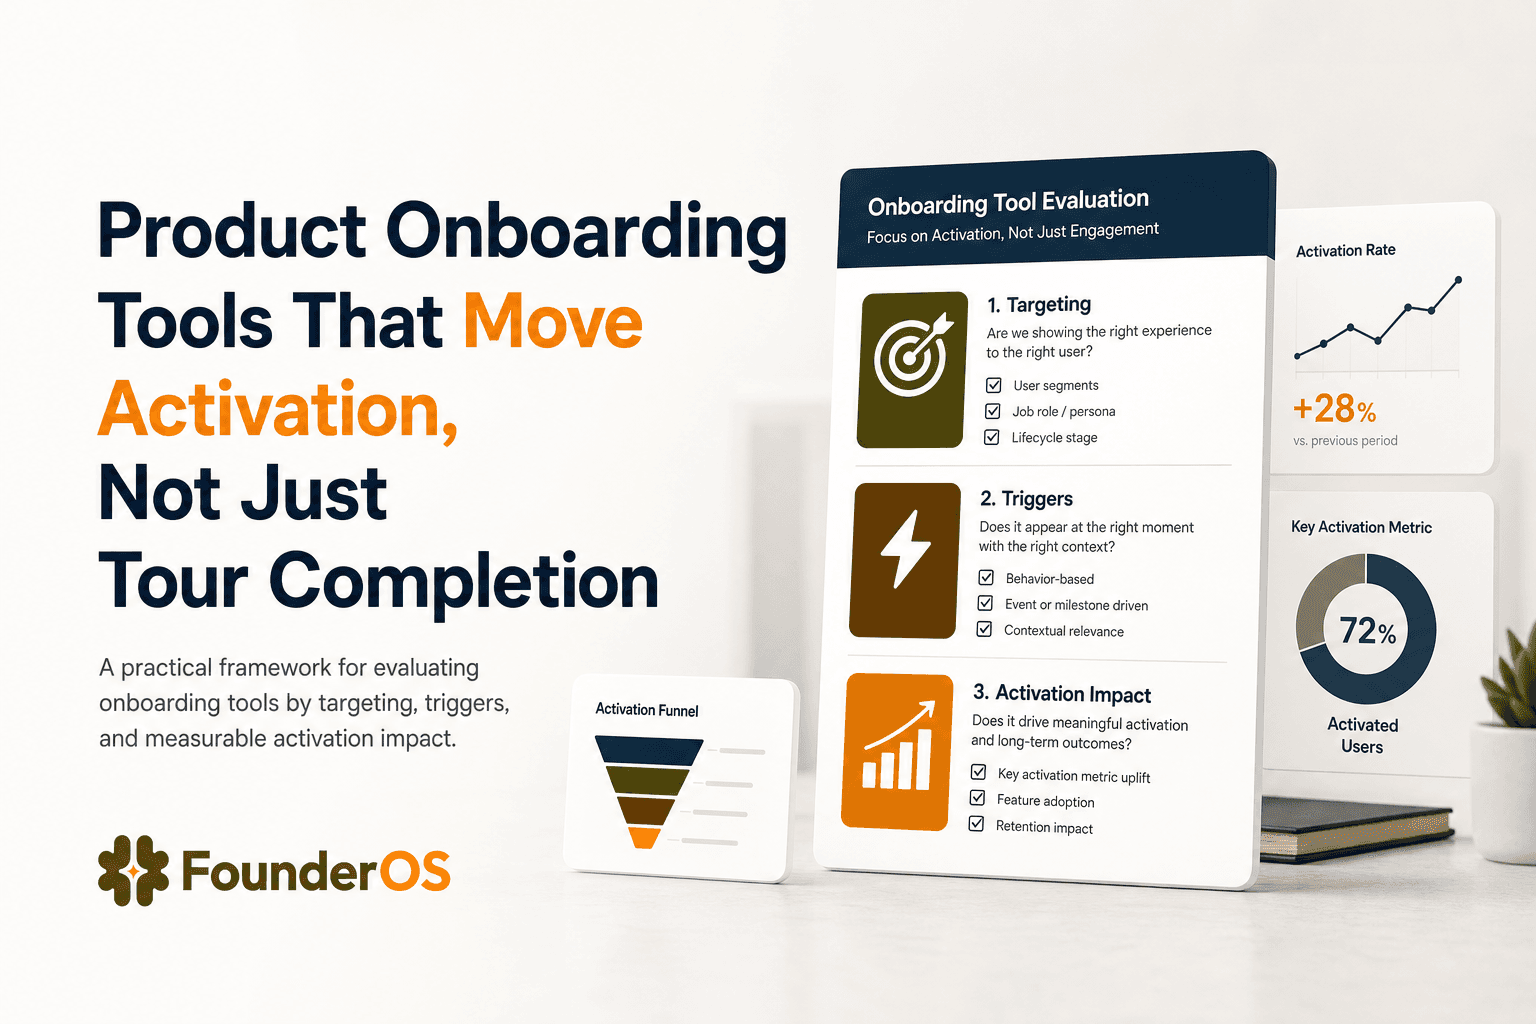
Product Onboarding Tools That Move Activation, Not Just Tour Completion
Compare product onboarding tools by motion, measurement, and targeting so you can pick a tool that proves activation impact, not just tour views.
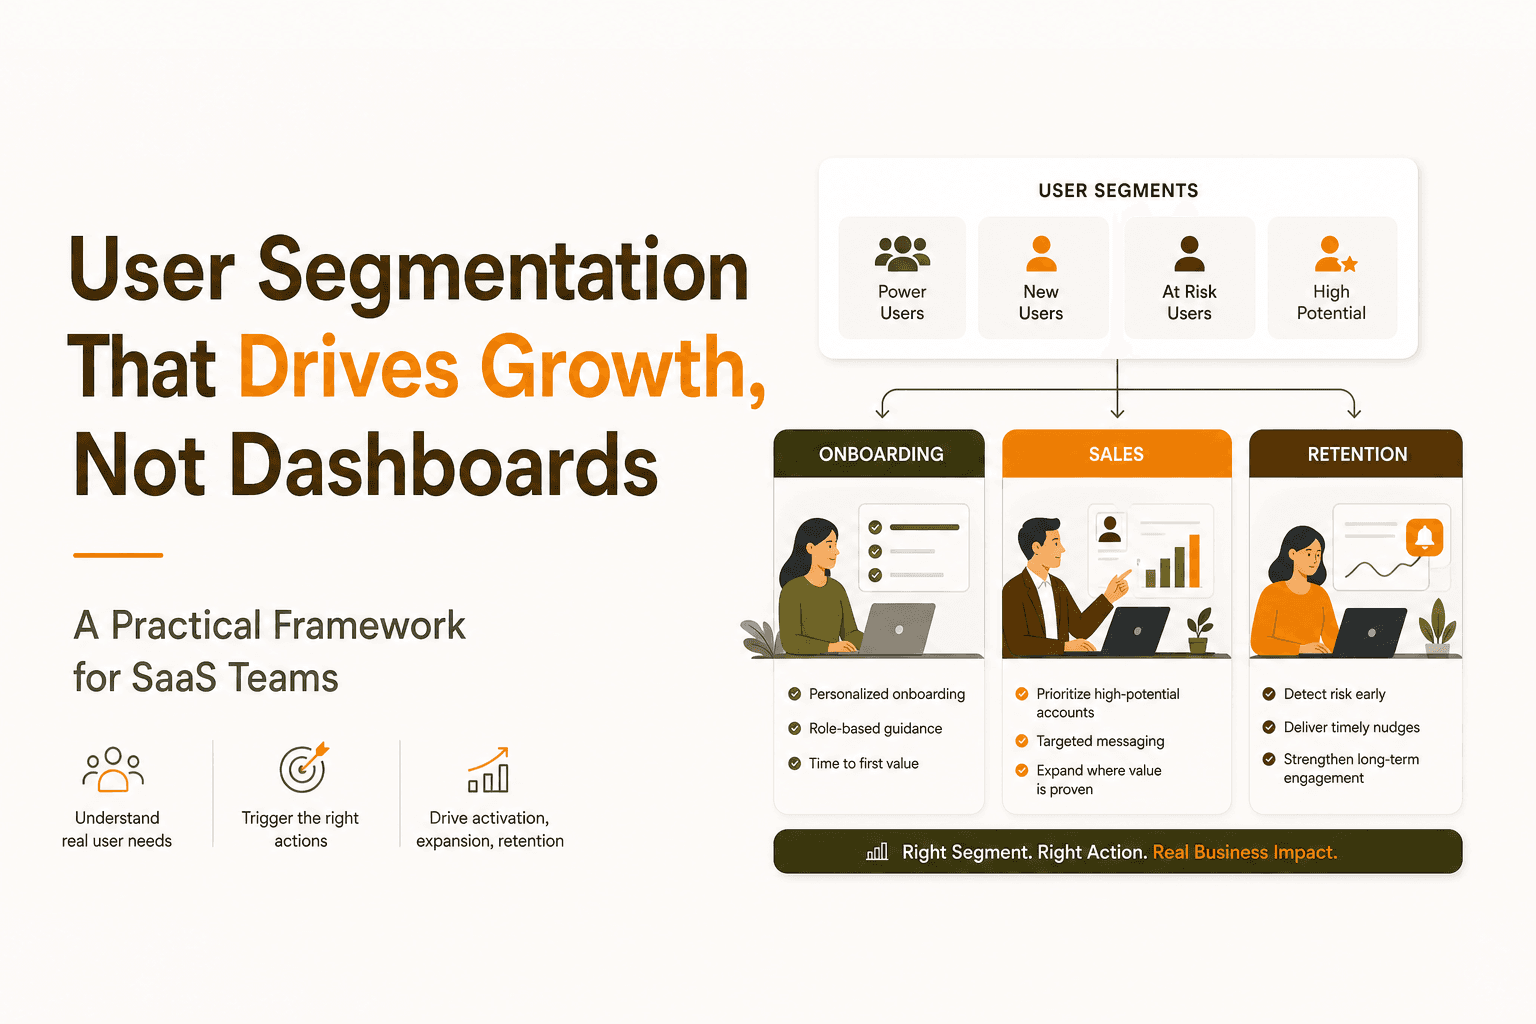
User Segmentation That Drives Growth, Not Dashboards - A Practical Framework for SaaS Teams
Learn user segmentation that powers onboarding, lifecycle messaging, and sales outreach with a simple framework and tool checklist.
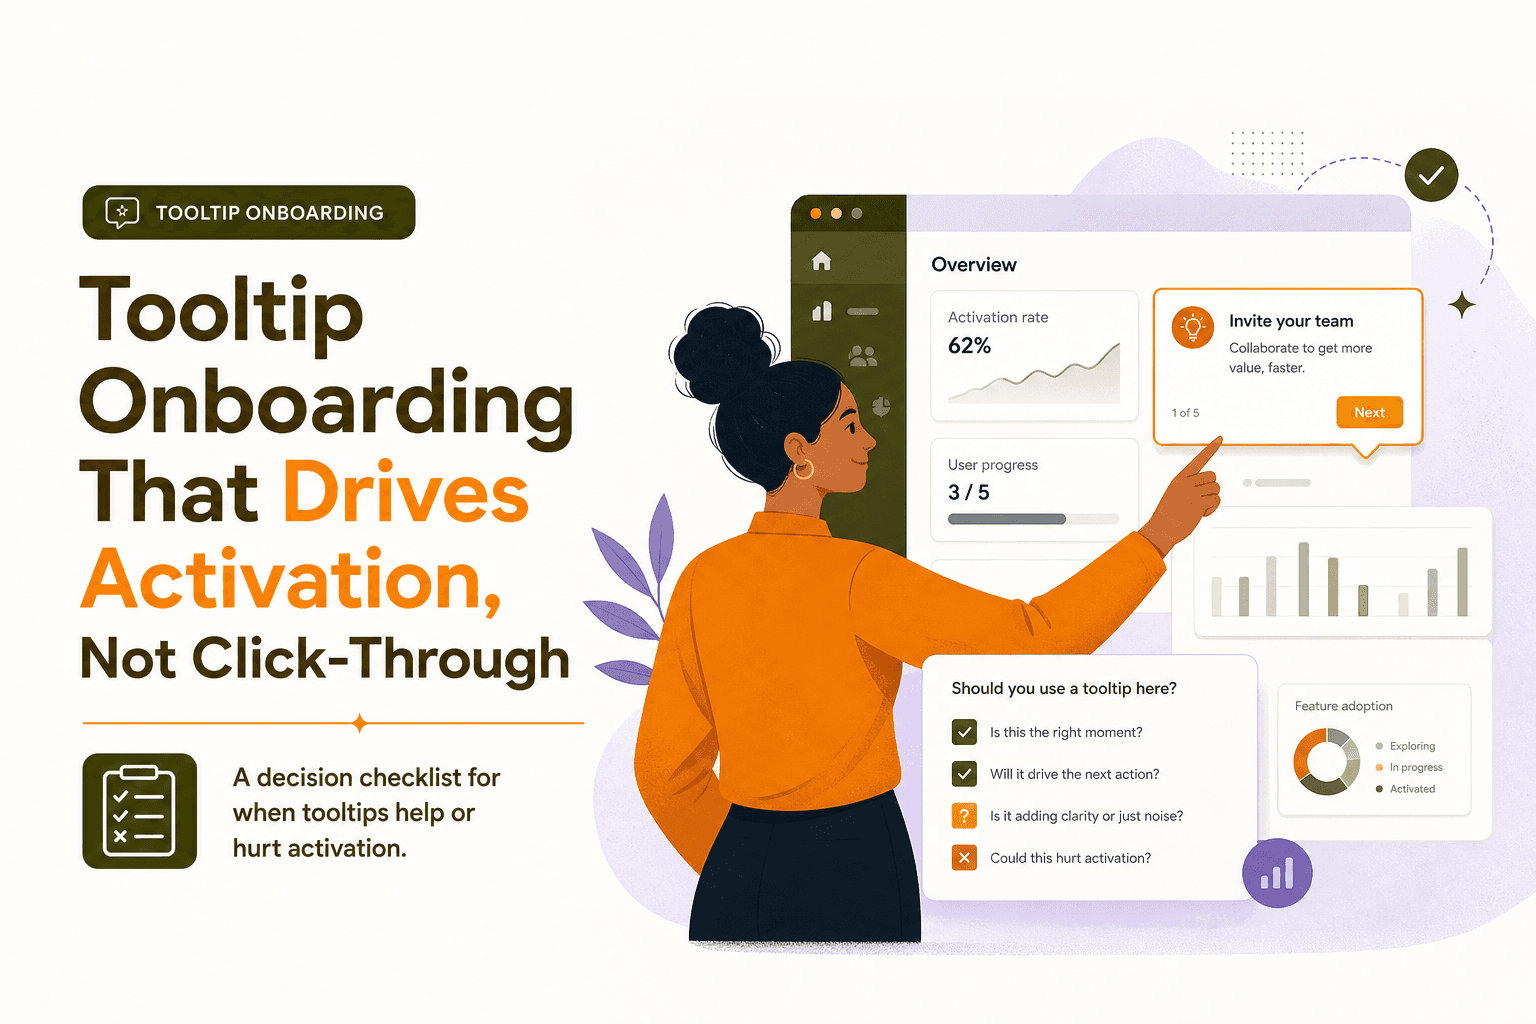
Tooltip Onboarding That Drives Activation, Not Click-Through
Learn tooltip onboarding that changes user behavior: when to use tooltips, a Trigger-Promise-Proof framework, and a measurement plan.