
PostHog Vs Google Analytics, How To Choose For B2B SaaS With A Real Cost And Data Checklist
posthog vs google analytics for B2B SaaS: compare attribution vs product analytics, real costs at scale, data mismatches, and a 30–60 day run-both plan.
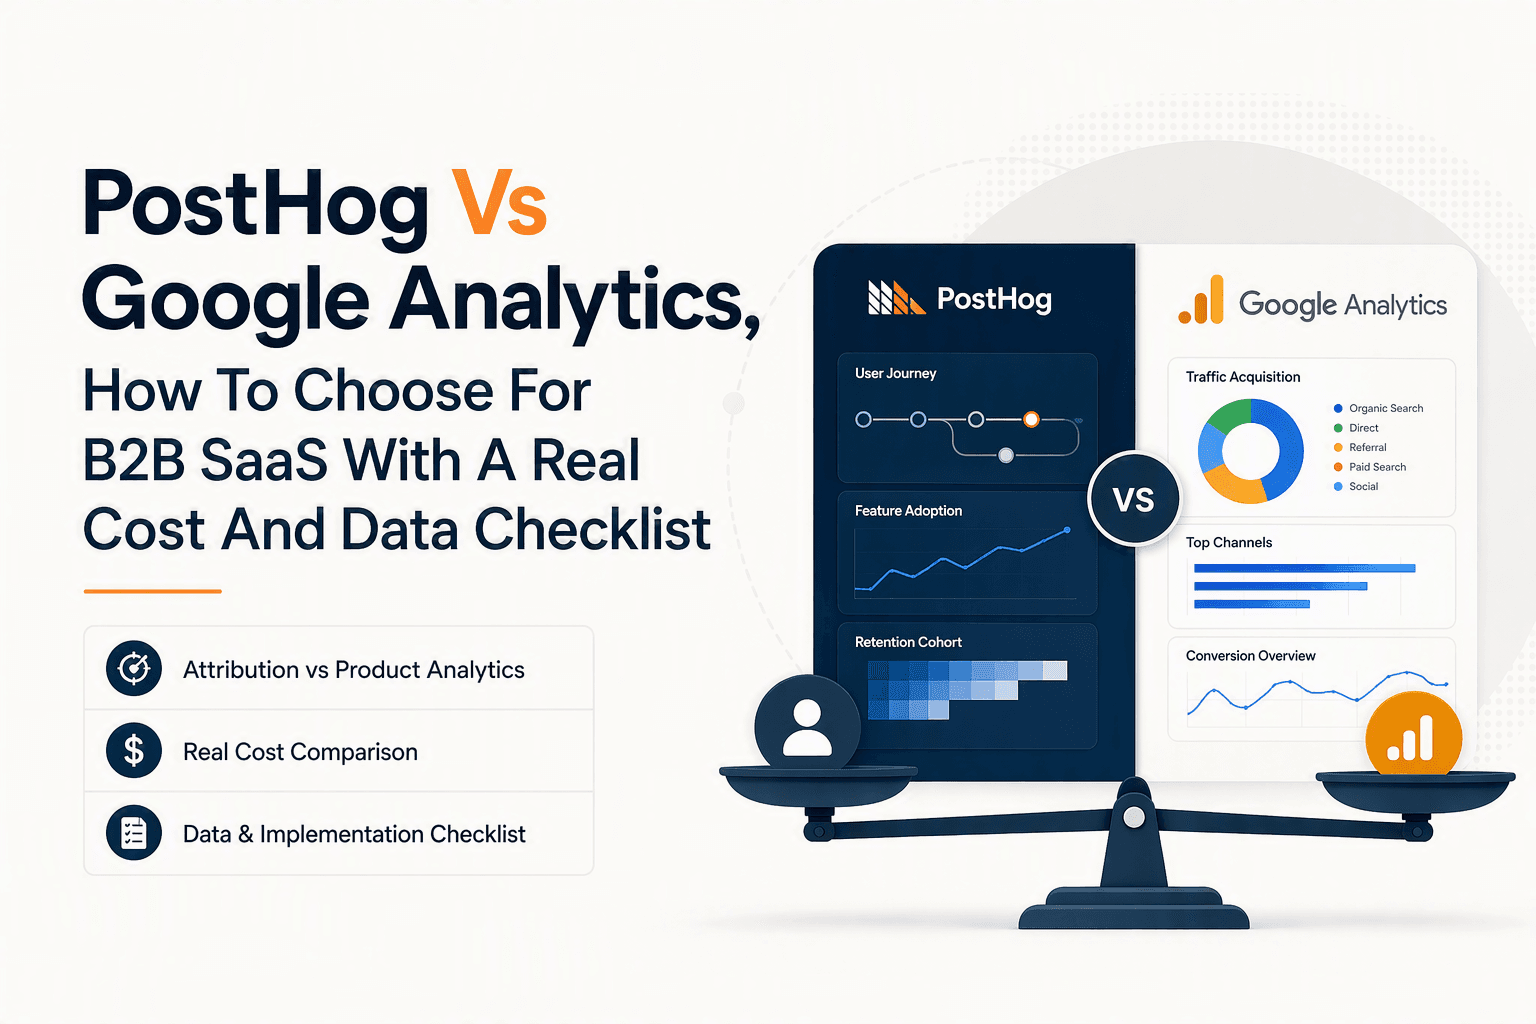
PostHog vs Google Analytics is a practical choice between product analytics depth and marketing attribution strength, and most B2B SaaS teams get the best outcome by deciding based on data model fit, identity reliability, export needs, and what the tools will cost at your real event volume.
- Choose GA4 when marketing attribution, acquisition reporting, and Google Ads ecosystem alignment are the primary job; choose PostHog when reliable event-based product insights (funnels, retention, paths, replay, experiments) are the primary job.
- Expect your numbers to differ across tools due to consent mode, ad blockers, identity rules, bot filtering, and sessionization; define acceptable discrepancy thresholds before you compare dashboards.
- Run dual tracking for 30–60 days with a mapped event taxonomy, consistent identity strategy, and a decision scorecard that weights cost, exports, governance, and daily workflow impact.
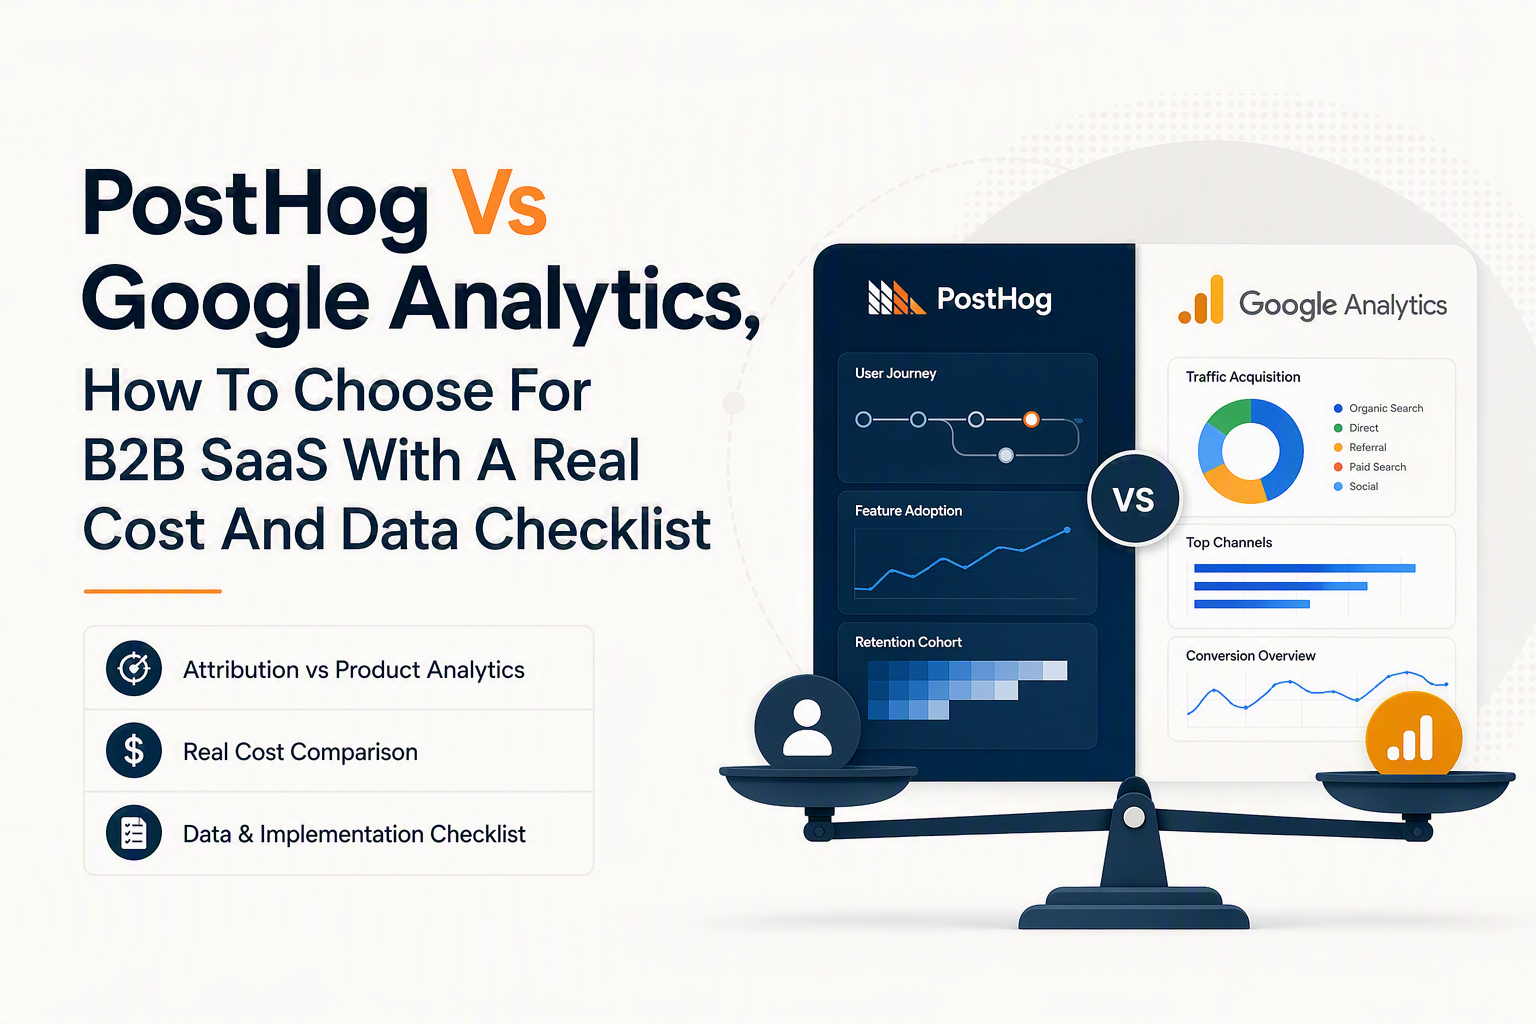
GA4 vs Google Analytics vs PostHog, what you’re actually comparing
PostHog vs Google Analytics comparisons go off the rails when teams mix three different products: Universal Analytics (UA), Google Analytics 4 (GA4), and enterprise Google Analytics (often referred to as GA360).
UA vs GA4 in one sentence
Universal Analytics was session-first and is now sunset for most standard properties, while GA4 is event-first and designed to unify web and app measurement with a different schema and different reporting behavior.
GA4 vs GA360, what changes in practice
GA4 and GA360 share the same core data model, but GA360 typically changes the operational reality more than the UI: higher limits and enterprise support expectations, plus contracts that often make sense only when analytics is business-critical and you need guaranteed throughput and service levels.
Where PostHog fits relative to GA4 for B2B SaaS
GA4 is strongest for acquisition and marketing measurement inside the Google ecosystem, while PostHog is built around product analytics workflows like feature usage, activation and retention analysis, self-serve funnels, session replay, and experimentation where user-level identity and event granularity are central.
In other words, posthog vs google analytics is less about “which tool is better” and more about which tool is the system of record for product behavior versus channel performance.
Decision matrix, marketing attribution vs product analytics vs privacy-first tracking
PostHog vs Google Analytics decisions become clear when you assign each tool a primary job and score them against a short list of non-negotiables: attribution, product insights, identity, privacy posture, and data access.
A simple chooser you can use in a meeting
- If you need attribution first: start with GA4 as your default, then add product analytics if GA4 can’t answer product questions without heavy workarounds.
- If you need product insights first: start with PostHog (or a similar product analytics platform), then keep GA4 for acquisition reporting and ad platform integration.
- If you need “privacy-first” as a requirement: evaluate how each tool behaves under consent denial, what you can self-host, and whether your governance team needs strict control over data residency and retention.
Decision criteria checklist (weight these for your org)
- Primary outcome: Do you optimize paid spend and channel ROI, or activation and retention?
- Identity reliability: Can you consistently stitch anonymous to known users, and do you need account-level (company) views?
- Time-to-answer: Can a PM answer “where do users drop off?” without exporting to a warehouse?
- Data access: Do you require raw event export for modeling, reverse ETL, or revenue analytics?
- Governance: Who can create events, manage naming, and prevent dashboard sprawl?
How identity handling changes the winner
Identity is the hidden lever in posthog vs google analytics because it determines whether “user” metrics mean what your team thinks they mean. GA4 has a specific approach to identity (device ID, Google signals where applicable, and any user ID you provide) and is optimized for aggregated reporting. PostHog leans into person-level analytics, where aliasing anonymous to identified users can make product journeys readable in a way marketers rarely need but product teams depend on.
After running identity audits across multiple B2B SaaS setups, the pattern was clear: teams that do not define a single rule for when a user becomes “known” end up debating dashboards instead of fixing drop-offs.
Feature and data access comparison that actually impacts daily work
PostHog vs Google Analytics differs most in the day-to-day questions each tool answers quickly without exporting, rebuilding, or hand-waving about data quirks.
Workflow-level comparison (what you can do in under 10 minutes)
- Activation and onboarding funnels: PostHog-style product funnels are purpose-built for stepwise behavior, breakdowns by cohort, and fast iteration; GA4 funnels exist but often feel more constrained for deep product analysis.
- Retention and cohorting: Product analytics tools tend to make retention and cohort definitions a first-class workflow; GA4 retention exists but many B2B teams still export to analyze cohorts their way.
- Pathing and “what happened before/after”: Product analytics generally emphasizes exploratory paths; GA4 offers path exploration but is frequently used at a higher level.
- Session replay and qualitative debug: PostHog includes replay as a core product workflow for debugging; GA4 is not designed as a replay tool.
- Experimentation: PostHog’s experimentation features align with product iteration; GA4 can report outcomes but is not an experimentation platform by default.
Exports and query model, BigQuery vs product-analytics querying
GA4’s BigQuery export is a major practical advantage when your team already analyzes data in SQL and wants raw, queryable events for modeling. PostHog emphasizes querying and analysis inside its own environment (including HogQL), which can be faster for product teams who want answers without building and maintaining a warehouse-first stack.
When we tested a “PM-only” workflow for answering a drop-off question, our team found that the deciding factor was not chart aesthetics, it was whether the tool let us click from an aggregate funnel step into user-level context fast enough to form a hypothesis.
Integration reality, what matters for B2B SaaS
For B2B SaaS, the integration question is usually “Can we connect product behavior to accounts and revenue?” not “Can we track pageviews.” GA4 plays well with Google Ads and web acquisition reporting. PostHog typically fits better when you need deeper product event instrumentation, plus reliable user-level views that support support, success, and product workflows.
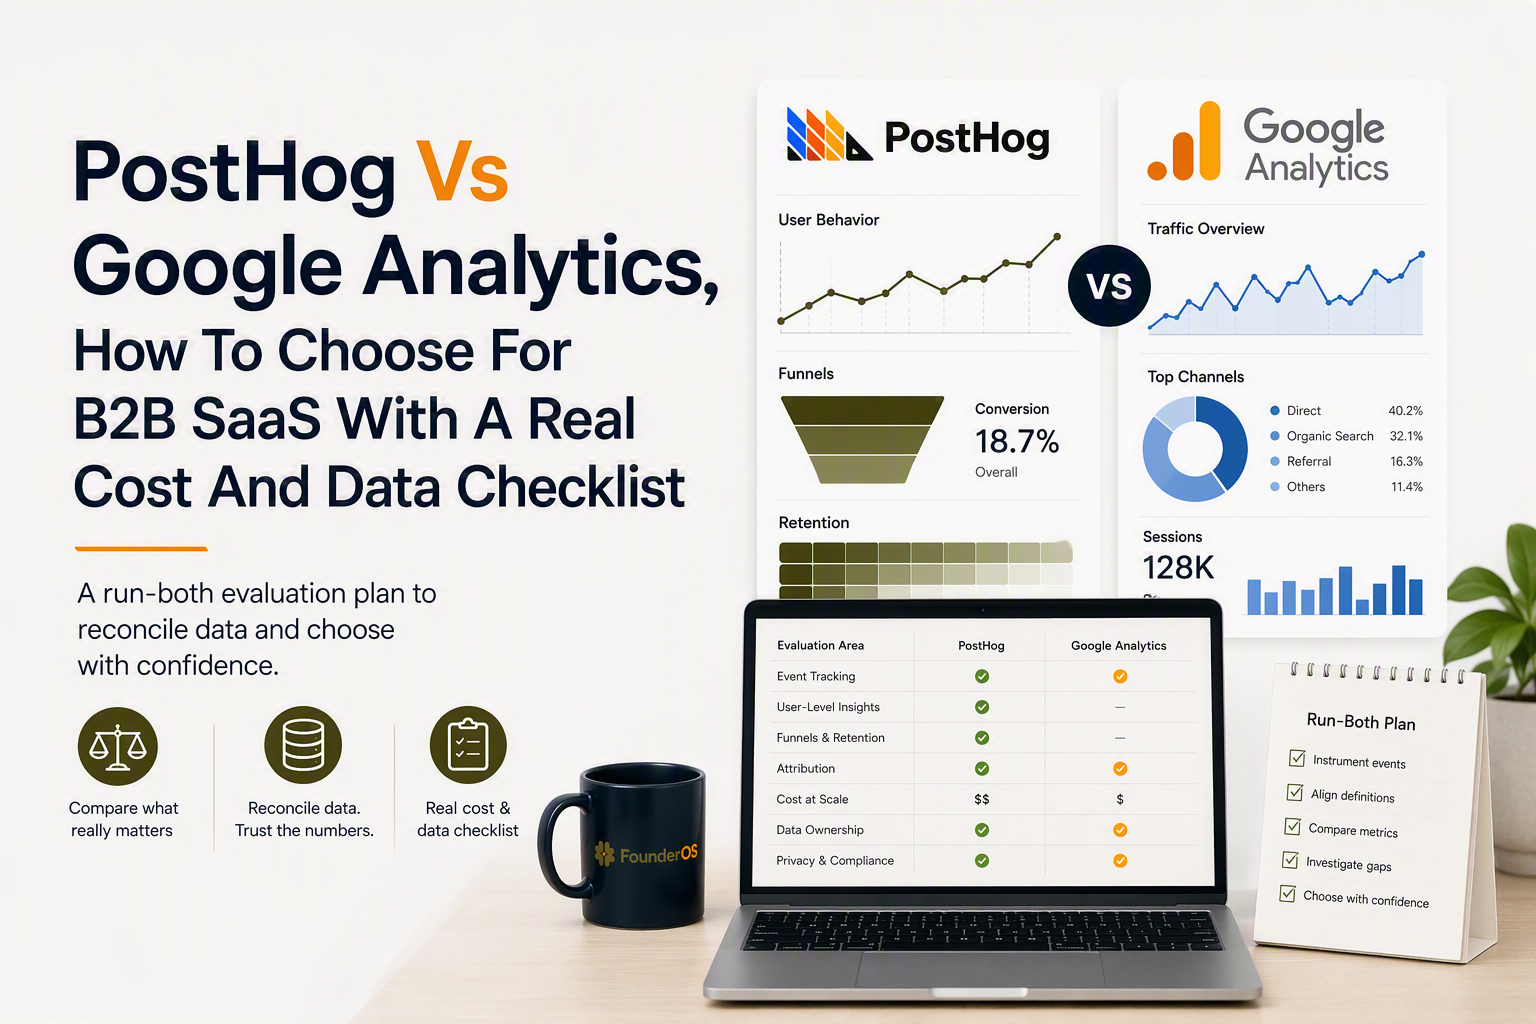
PostHog vs Google Analytics cost in practice, worked scenarios and breakpoints
PostHog vs Google Analytics cost comparisons need to start from your actual monthly event volume, retention period, and whether you will use high-cost features like session replay and frequent exports.
Start with a cost worksheet (inputs you can pull this week)
- Monthly tracked events: web + app + backend (if you track server events).
- Monthly active users: anonymous and logged-in.
- Retention requirement: 3 months vs 12+ months changes storage and export needs.
- Replay coverage: 1% for debugging vs 20% for broad UX review is a different budget line.
- Data export frequency: ad hoc vs daily warehouse sync.
Four realistic scenarios to sanity-check spend
Scenario A: Early-stage B2B SaaS (low volume, high iteration). You track a few key product events plus key onboarding steps. Cost risk is usually low in both ecosystems, but the hidden cost is engineering time if your tool requires constant manual tagging or schema refactors.
Scenario B: Product-led growth motion (moderate volume, heavy funnel work). You track many UI interactions and run weekly onboarding experiments. Session replay and experimentation become material. In posthog vs google analytics, this is where GA4 often stays your acquisition layer while product analytics becomes the daily driver.
Scenario C: Mid-market sales-led SaaS (account focus). The cost driver is less “events per user” and more “do we need account-level segmentation and user history for success workflows.” Paying for better identity and segmentation can be worth more than saving on raw event volume.
Scenario D: High-volume self-serve (large event volume). The decision shifts to governance, sampling/limits behavior, and warehouse strategy. At this point, the cheapest tool is often the one that prevents rework: consistent event naming, stable identity joins, and predictable exports.
Cost breakpoints to watch (even before you price-shop)
- Replay and heatmaps: treat these as separate budget items; they scale differently than pure event analytics.
- Data retention: long retention is frequently “free” in intent but costly in storage and query time.
- Warehouse usage: BigQuery and downstream BI costs can exceed analytics subscription cost when teams export everything by default.
If you want deeper planning for PostHog specifically, posthog pricing breakdowns are most useful when they include replay and retention assumptions, not just headline tiers.
Implementation reality check, why your numbers won’t match and what to do
PostHog vs Google Analytics will never match perfectly because the tools make different choices about consent, identity stitching, bot filtering, sessionization, and what counts as an event.
Top causes of mismatched numbers (and how to diagnose)
- Consent and tagging behavior: If GA4 runs in a different consent mode than your product analytics, you are comparing two different datasets. Decide what “must be measured” under consent denial and document it.
- Ad blockers and script blocking: Client-side tracking is suppressed unevenly across tools because of different script URLs and block lists. Use a server-side event (for example, “account_created”) to create a reconciliation anchor.
- Identity merges: If one tool aliases anonymous to known and the other treats them separately, user counts will diverge. Define a single “known user” moment (login, email capture, workspace creation) and implement it consistently.
- Bot and internal traffic filtering: Differences in bot filtering and internal IP rules will skew page views and sessions. Maintain a shared internal traffic definition list and test it quarterly.
- Event duplication: SPA navigation, retries, and double-fired click handlers are common. Validate with a live event stream and compare raw logs for a handful of user sessions.
A practical discrepancy policy (so you don’t debate forever)
Set an explicit rule like: “We accept up to X% variance on page views and sessions, but only Y% variance on server-confirmed conversion events.” The exact X and Y depend on your consent rate and tracking approach, but the existence of the policy is what prevents endless stakeholder arguments.
We initially assumed dashboard mismatches meant broken tracking, but repeated audits showed a more common cause: different identity rules across tools, especially around anonymous-to-known transitions.
Make funnels comparable by anchoring to the same event truth
For B2B SaaS, the cleanest cross-tool alignment is to define a small set of server-confirmed lifecycle events (signup created, email verified, workspace created, subscription started) and then layer client-side UX events for diagnostic depth. If you need help defining what should be tracked, analytics events tracking frameworks work best when they start from activation and revenue questions, not from a giant event list.
A 30–60 day run-both plan to choose confidently
PostHog vs Google Analytics is easiest to decide after a structured dual-tracking evaluation that measures data reliability, time-to-insight, governance overhead, and cost at your actual usage.
Week 0, define the evaluation scope (one page)
- North Star questions: pick 5 questions you must answer weekly (for example, “Where does activation drop off?”, “Which features correlate with week-4 retention?”).
- Event map: list 10 to 20 events max for the evaluation, with names, properties, and who owns each definition.
- Identity rules: define anonymous, known user, and account/workspace identifiers.
- Success criteria: define acceptable variance for each key metric.
Weeks 1–2, instrument and validate (treat this like QA)
- Install both tags: ensure both tools see the same pages and core actions.
- Validate with test scripts: run a scripted user journey and confirm event sequences match in both systems.
- Check edge cases: SPA routing, logout/login, invite flows, and payment redirects.
Weeks 3–6, run real workflows (the part teams skip)
- Build the same 3 dashboards: acquisition overview, activation user funnel, and retention cohorts.
- Record time-to-answer: how long does it take a PM to answer each North Star question without help?
- Log discrepancy incidents: every mismatch gets a short note: cause, fix, and whether it’s acceptable.
Decision scorecard (use weights, not vibes)
- Data reliability: identity correctness, variance on server-confirmed conversions.
- Workflow speed: time-to-insight for product and growth questions.
- Governance: naming consistency, permissioning, and auditability.
- Cost trajectory: projected cost at 2x and 5x event volume, including exports and replay.
- Team adoption: does the tool get used weekly by PM, growth, and success?
If your shortlist expands beyond these two, use a structured comparison list like posthog alternatives to keep criteria consistent across vendors.
| Need | GA4 is usually the better fit when... | PostHog is usually the better fit when... | What to validate in a 30–60 day run-both |
|---|---|---|---|
| Attribution and acquisition reporting | You rely on Google Ads and channel reporting as a primary operating cadence | You treat marketing reporting as secondary to in-product activation and retention | Variance on sessions, UTMs, and paid channel metrics; consent mode behavior |
| Product behavior analysis | You only need light in-product reporting or you export everything to a warehouse | You need fast funnels, retention, paths, replay, and experiments for weekly iteration | Time-to-answer for 5 core product questions; ability to drill into user context |
| Identity and account context | User-level stitching is “nice to have” and aggregated reporting is acceptable | Person-level analysis and anonymous-to-known stitching are critical to interpret journeys | Correctness of aliasing rules; account/workspace rollups; duplicate user rates |
| Data access and exports | You want BigQuery exports and downstream modeling as a default workflow | You prefer in-tool querying and only export curated datasets | Export completeness, latency, and downstream cost; governance for raw data sharing |
| Governance and scale | Your org has established Google ecosystem governance and standardized reporting | Your org needs strict product event definitions and reusable product insight templates | Event naming drift over time; permissions; audit trails; dashboard sprawl control |
FAQ
Can a B2B SaaS use GA4 and PostHog together?
Yes, and it is often the most pragmatic setup: GA4 remains your acquisition and attribution layer, while PostHog becomes the system you use weekly for activation, retention, and product iteration. The key is to define shared lifecycle events so your core conversions reconcile.
Why do user counts differ so much in posthog vs google analytics?
User counts diverge primarily due to identity rules (anonymous vs known stitching), consent and script blocking, and differences in how each tool defines and deduplicates users across devices. Align on a single “known user” moment and use server-confirmed lifecycle events as anchors for reconciliation.
What should we compare during a dual-tracking evaluation?
Compare (1) variance on server-confirmed conversions, (2) time-to-answer for your top product and growth questions, (3) export completeness and operational cost, and (4) governance overhead like event naming drift and permission controls. Avoid judging tools by page view totals alone.
Do we need a warehouse to make GA4 useful for product analytics?
Not always, but many teams choose BigQuery exports when they need custom cohorting, revenue modeling, or joining product events with CRM and billing data. If your priority is fast, self-serve product insights without a data team in the loop, a product analytics tool may reduce dependence on warehouse workflows.
If you want to run the same 30–60 day evaluation with less instrumentation churn, Founder OS can help you unify product event tracking, user profiles, segmentation, and GTM reporting in one place, then validate your activation and retention hypotheses against GA4 and PostHog on your own data. Start free or book a demo to see whether it fits your measurement and governance requirements.
Read Next
View all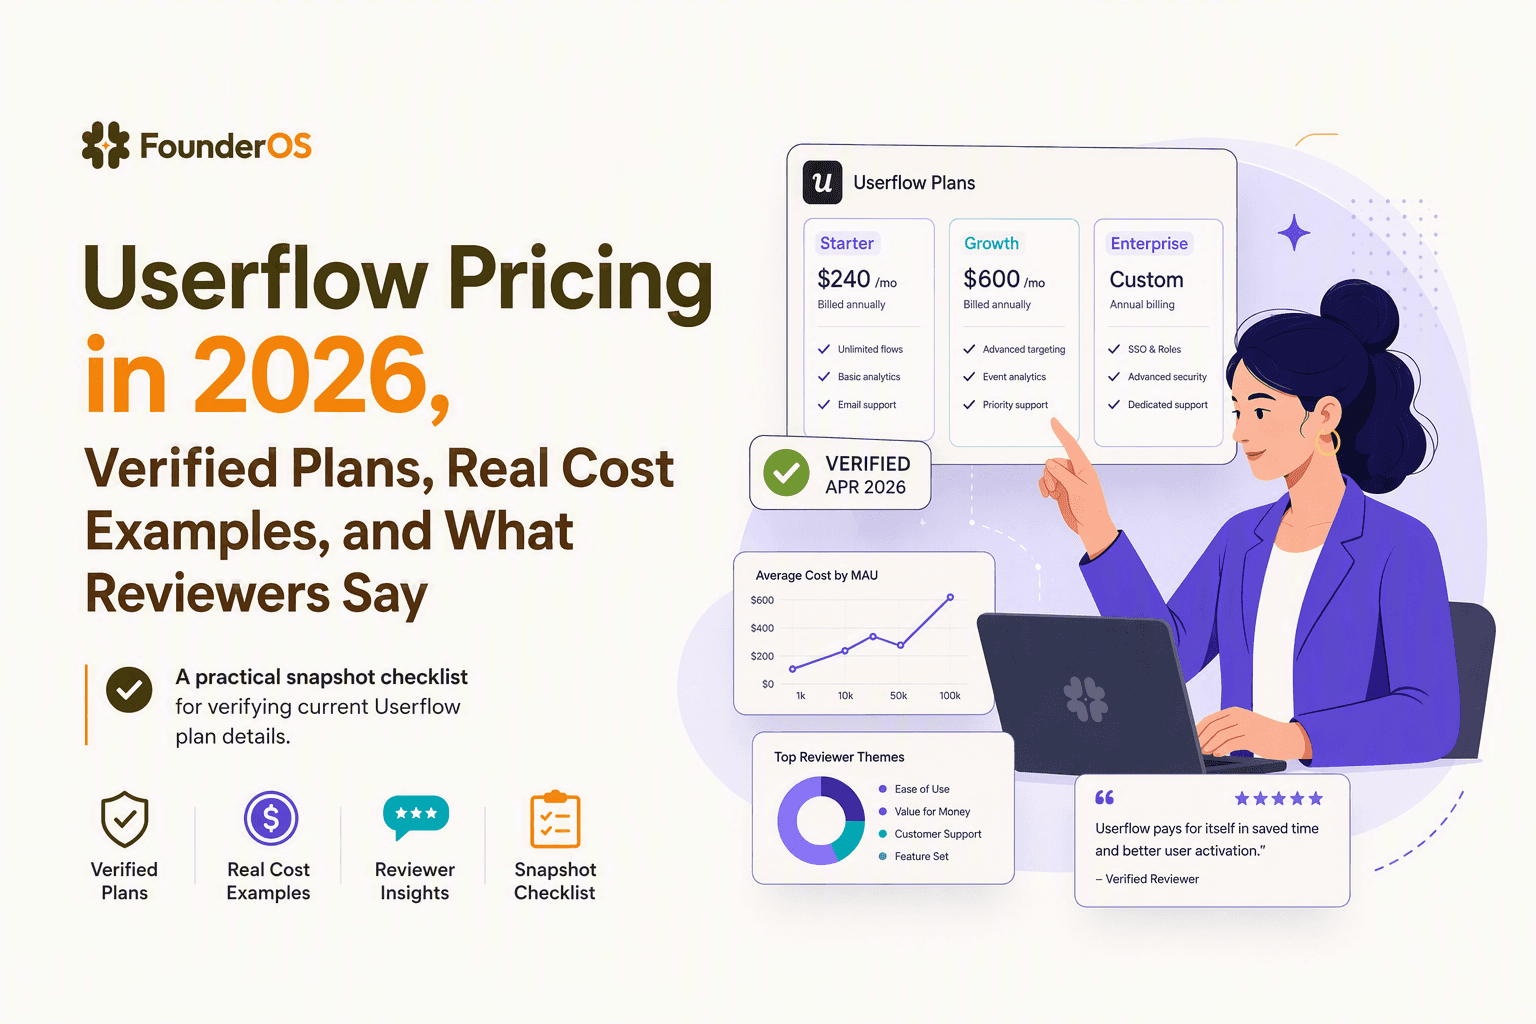
Userflow Pricing in 2026, Verified Plans, Real Cost Examples, and What Reviewers Say
A decision-ready guide to userflow pricing in 2026 with plan mechanics, a quick cost model, feature gating, and reviewer patterns.
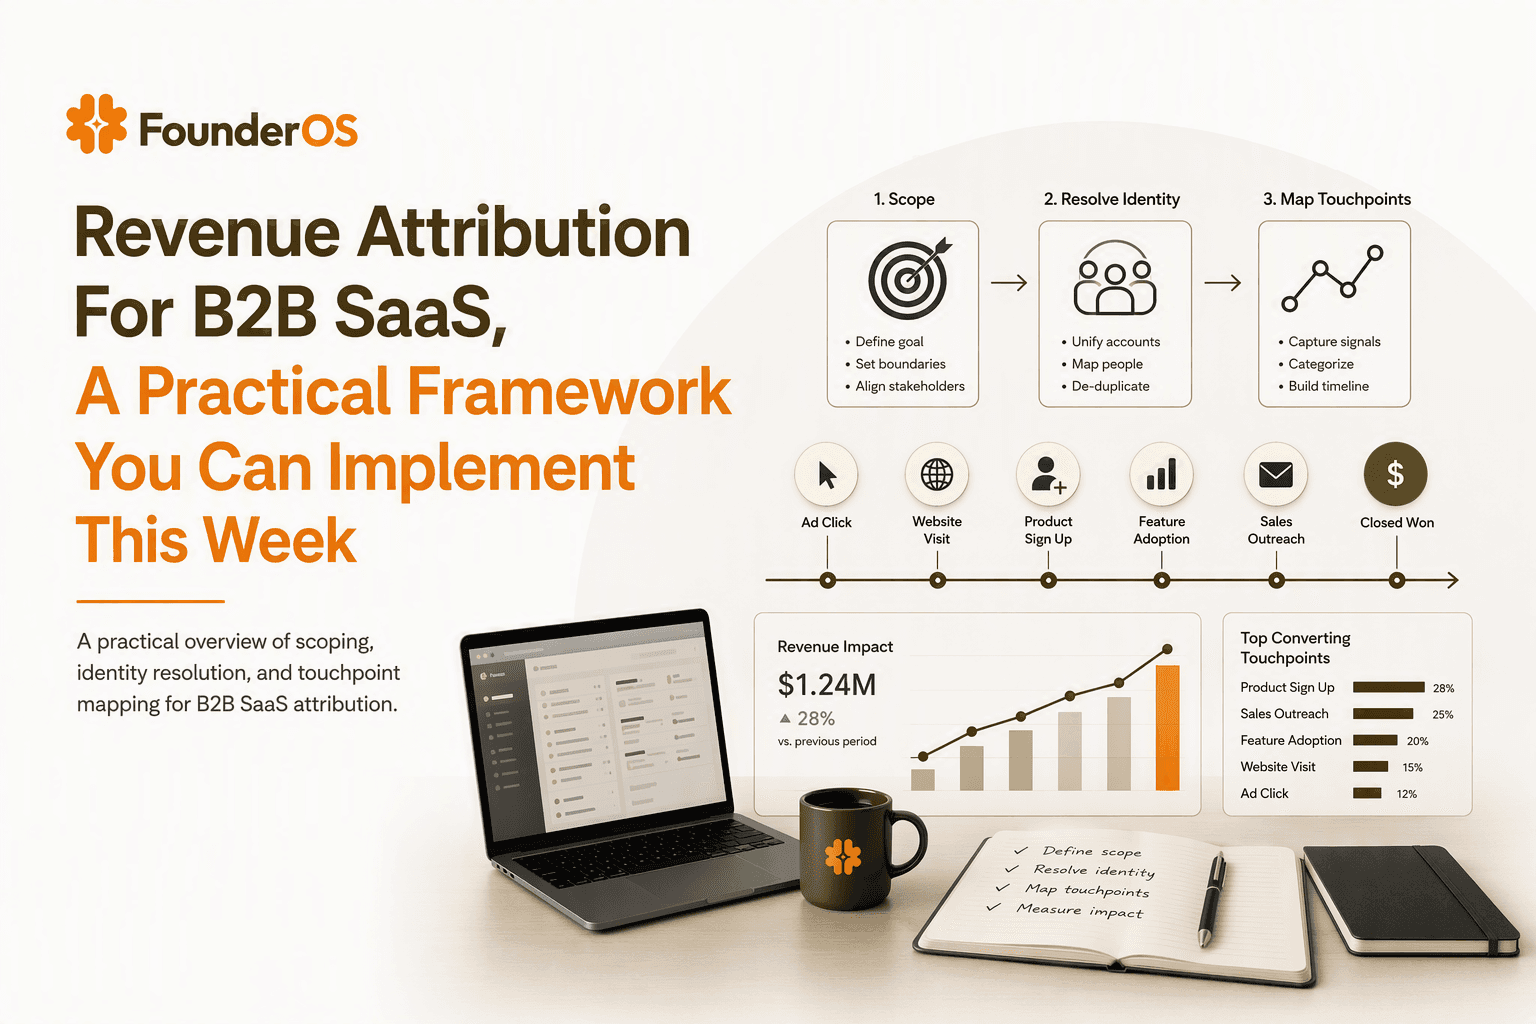
Revenue Attribution For B2B SaaS, A Practical Framework You Can Implement This Week
Build revenue attribution for B2B SaaS with identity, product events, and a defensible multi-touch model plus QA checks you can run weekly.
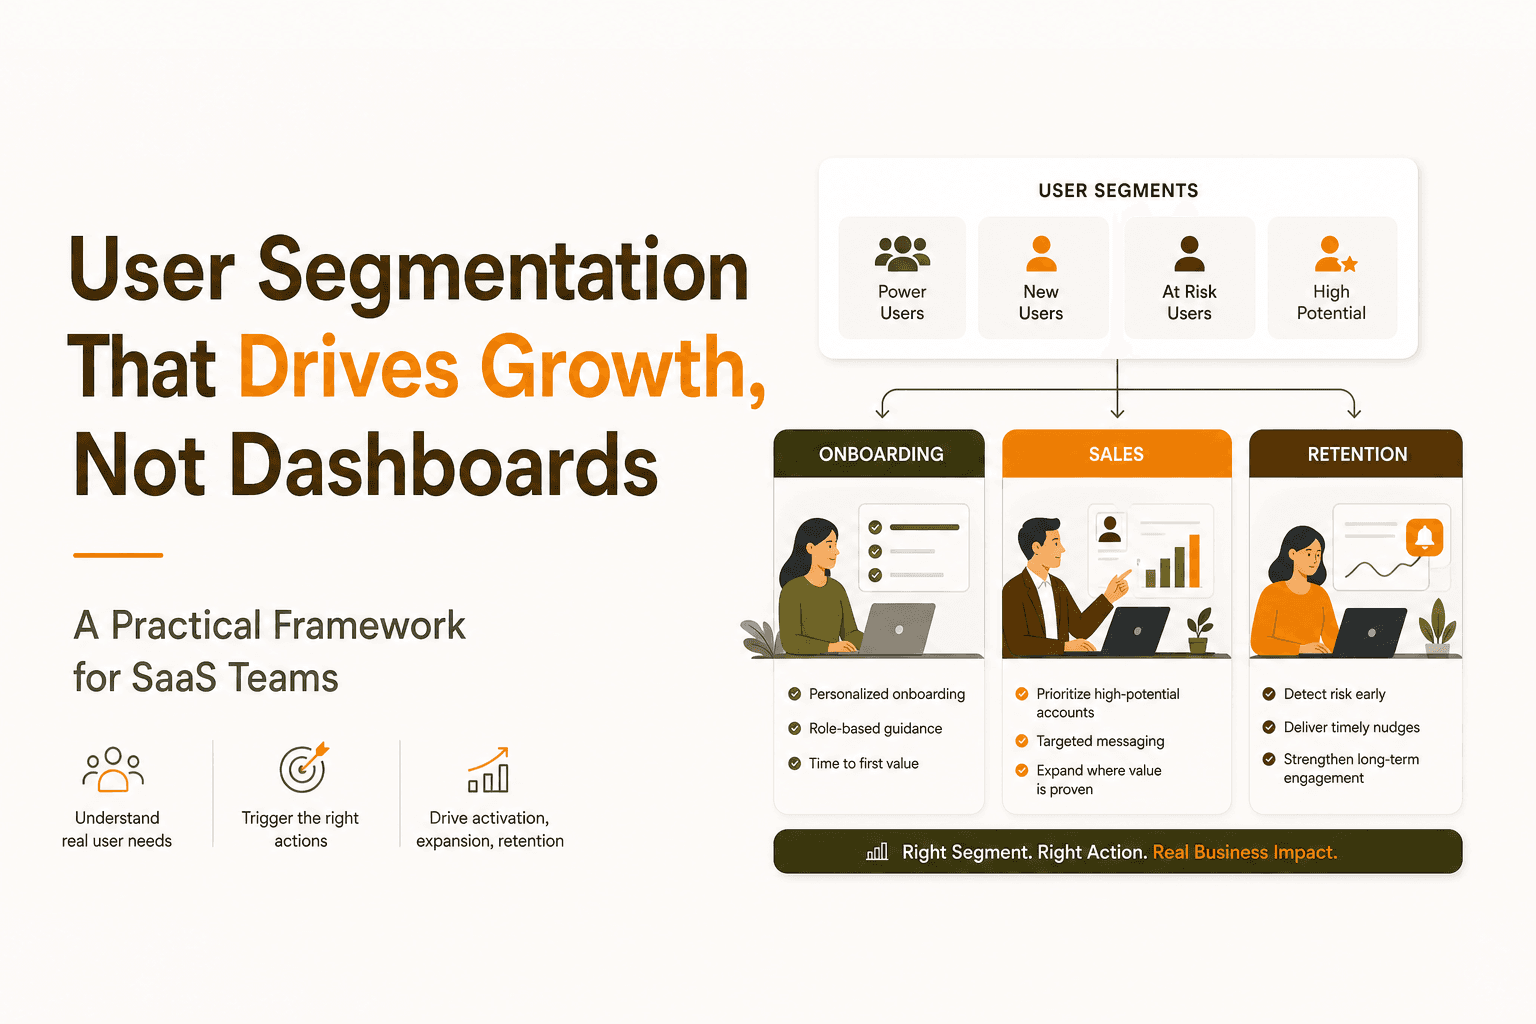
User Segmentation That Drives Growth, Not Dashboards - A Practical Framework for SaaS Teams
Learn user segmentation that powers onboarding, lifecycle messaging, and sales outreach with a simple framework and tool checklist.