
How To Analyze Marketing Data for B2B SaaS and Connect Channels to Revenue
Learn to analyze marketing data by linking channels to activation, retention, and revenue with a weekly workflow and decision rules for B2B SaaS.
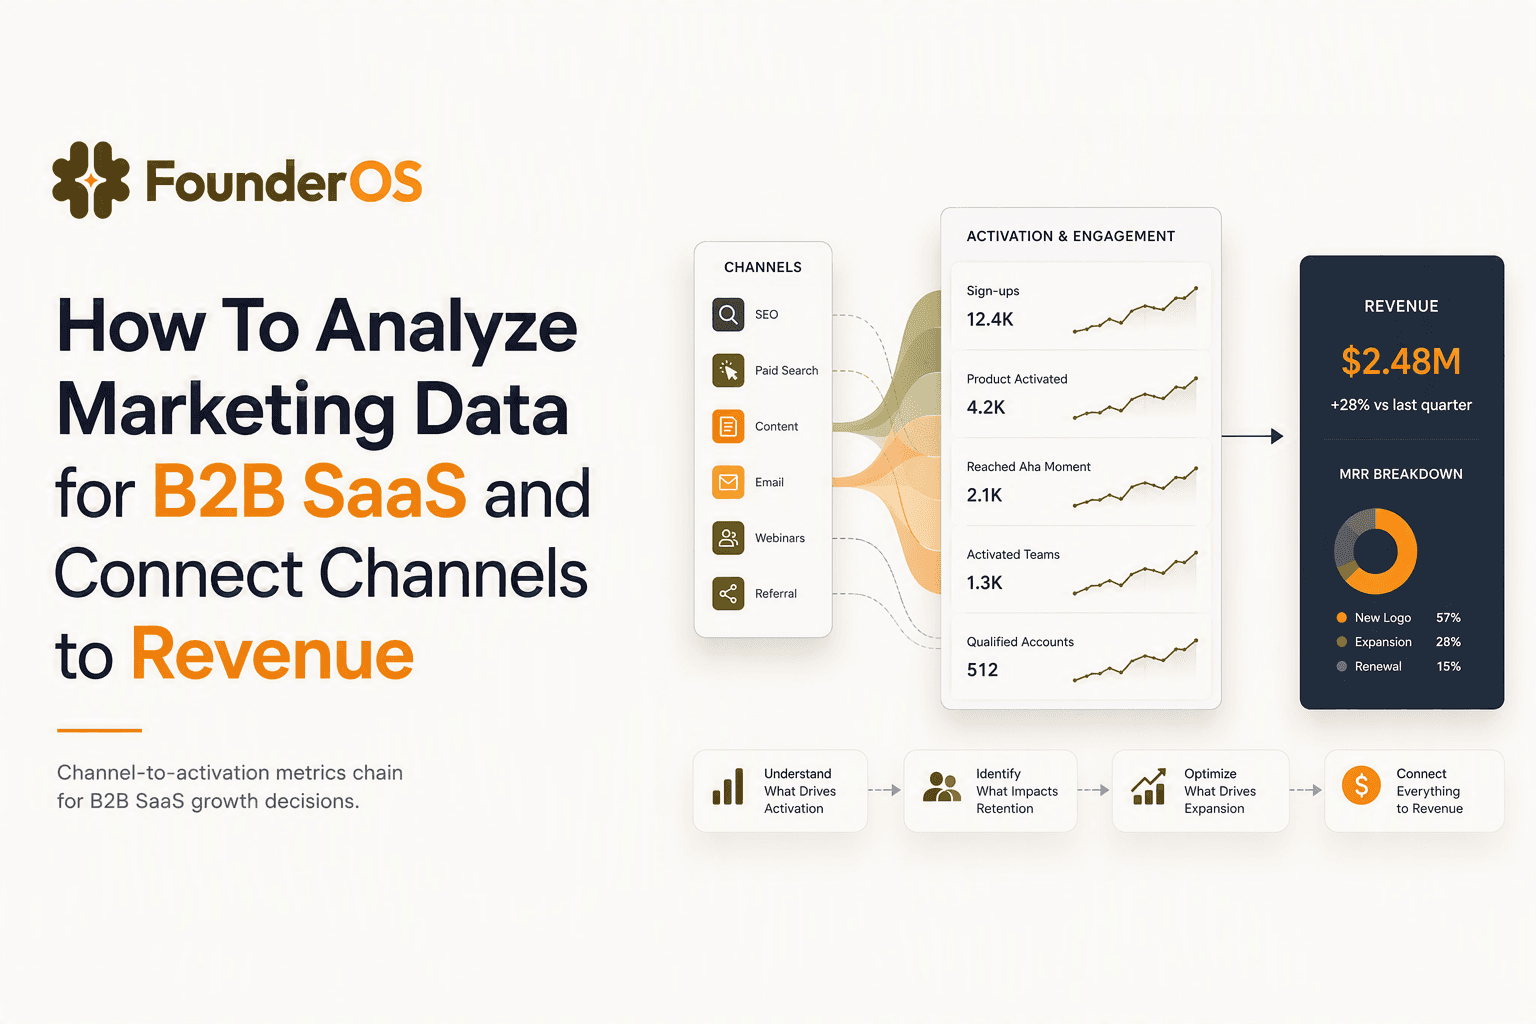
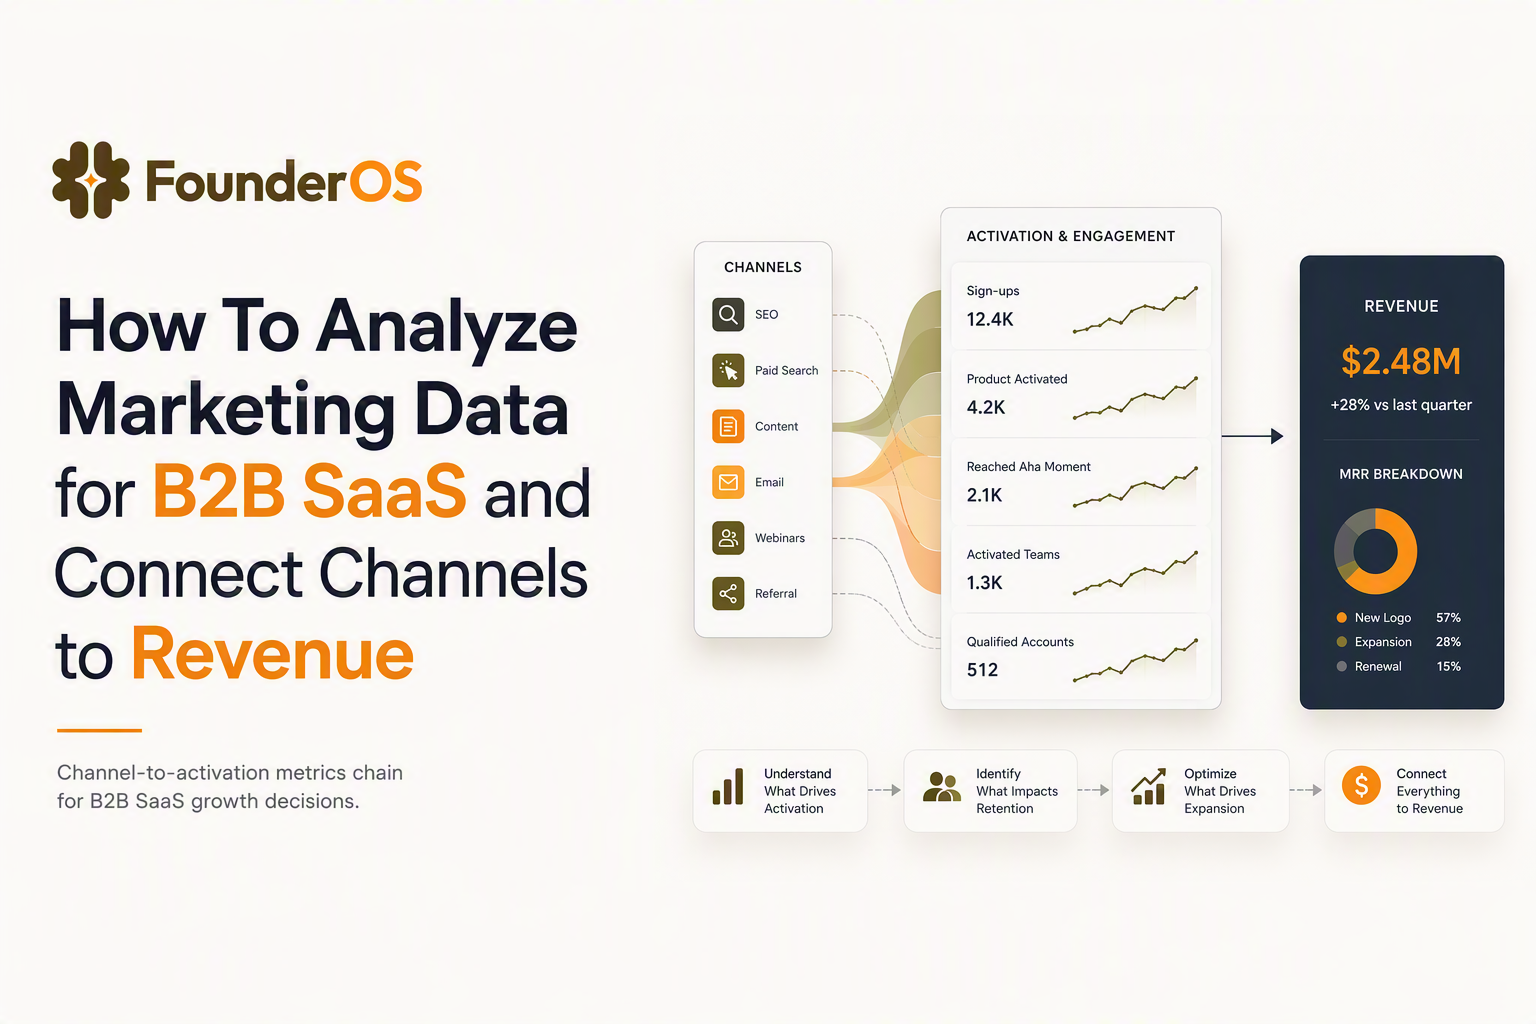
To analyze marketing data in B2B SaaS, connect acquisition signals (spend, clicks, leads) to in-product behavior (activation and retention) and then to revenue outcomes (pipeline and expansion) using a repeatable weekly workflow. The biggest failure mode is optimizing channels on vanity metrics because the product data and attribution rules are not tied to specific growth decisions.
- Start with 5 to 7 recurring decisions (budget shifts, onboarding fixes, ICP focus) and map each to one measurable outcome you can defend.
- Build a single metrics chain from channel to activation to pipeline so every report answers “what should we do next?” not “what happened?”
- Run a weekly insights loop with thresholds, sample-size checks, and guardrails to avoid false positives and attribution confusion.
Start With Decisions, Not Dashboards
Marketing analysis becomes actionable only when every chart is tied to a recurring decision and a measurable outcome. If the decision is unclear, the analysis will drift toward what is easiest to measure: clicks, sessions, and MQL volume.
Define 5 to 7 recurring growth decisions
Use this list as a starting point and tailor it to your motion:
- Budget reallocation: “Which 2 channels get more spend next week?”
- Offer and landing page iteration: “Which message improves qualified signup rate?”
- ICP and persona focus: “Which segment should we target with paid and outbound?”
- Activation bottleneck fix: “Which onboarding step is killing conversion?”
- Sales follow-up rules: “Which leads should get routed fastest?”
- Retention rescue: “Which cohort is slipping and needs lifecycle nudges?”
Map each decision to one outcome metric and one guardrail
For each decision, define:
- Primary outcome: the metric you want to move.
- Leading indicator: the earliest reliable signal you can observe (often an in-product action).
- Guardrail: what must not degrade while you optimize.
| Decision | Primary outcome | Leading indicator | Guardrail |
|---|---|---|---|
| Scale Channel A | Activated signups per $ | Activation rate by source | Refund rate, churn proxy |
| Change onboarding | Activation rate | Step-to-step completion | Time-to-value not worse |
| Shift persona targeting | Pipeline created | Qualified activation rate | CAC payback not worse |
A quick “decision readiness” checklist
- Could a teammate take your report and make a budget or product change within 24 hours?
- Is the metric defined the same way across marketing, product, and sales (names, filters, time windows)?
- Would two different analysts pull the same number from the data?
Build A Metrics Chain From Channel to Revenue
A KPI chain prevents you from optimizing top-of-funnel volume that never activates, retains, or converts to pipeline. The goal is a single tree that starts with source and ends with revenue outcomes, with clear handoffs between marketing, product, and sales.
Use one KPI tree instead of separate marketing and product dashboards
A practical chain for B2B SaaS looks like this:
- Channel input: spend, impressions, clicks, cost per click (platform-reported).
- Acquisition output: visit to signup rate, signup volume, cost per signup (web analytics + attribution).
- Activation: percent of signups reaching “aha” within N days, median time-to-aha (product events).
- Retention: week-1 return rate or key-action repeat rate by cohort (product events).
- Monetization: trial to paid conversion, pipeline created, revenue influenced (CRM + billing).
Define activation as an event sequence, not a feeling
Activation should be a small set of observable actions that correlate with retention. A common pattern is: Signup → Connect integration → Create first workspace/project → Invite teammate → Run core feature. Your version will differ, but it must be measurable and time-bound.
Decision rules that keep teams honest
- Budget shifts: move spend only when a channel’s activated signups per $ is better than baseline and the sample is non-trivial (avoid reacting to a handful of signups).
- Creative tests: declare a winner only if it improves the activation-leading indicator, not just CTR.
- Channel verdict: keep a channel with high CPC if it produces high activation or pipeline per signup.
When our team audited multi-channel spend for a mid-market SaaS, the pattern was clear: the channel with the “worst” CPL produced the highest activated signups because the ad promise matched the product’s first-time value. The fix was not cheaper leads, it was aligning message to the activation path and evaluating the channel on activation, not form fills.
If you need a structured way to connect spend to closed-won in B2B, the fastest path is to formalize revenue attribution definitions before you debate channel performance.
Instrument the Data You Actually Need
Instrumentation becomes “usable” when event names, properties, identities, and attribution rules are defined to answer your decisions with minimal ambiguity. The goal is not to track everything, it is to track the few things that make channel-to-product analysis defensible.
Event design: 12 to 20 events that cover the journey
Start with a compact taxonomy you can maintain. A typical set includes:
- Acquisition and signup: Landing page view, signup started, signup completed.
- Activation steps: Completed onboarding step, connected integration, created first object, ran core action.
- Engagement: Core action repeated, feature adopted, invited teammate.
- Monetization: Trial started, upgraded, payment failed, subscription canceled.
Properties that make marketing analysis possible
- Attribution: utm_source, utm_medium, utm_campaign, utm_content, utm_term.
- Click identity: gclid or equivalent, landing page URL.
- Account context: account_id, plan_type, seat_count, company_size bucket.
- Persona signals: role, use case selected, industry (from signup or enrichment).
Identity rules: the non-negotiable part
Write down these rules and enforce them in tracking:
- Anonymous to known merge: merge pre-signup activity into the user profile after signup.
- User vs account: decide which metrics are user-level (activation) and which are account-level (conversion to paid) and do not mix them in the same numerator/denominator.
- Cross-device: define how you handle users who click an ad on mobile and sign up on desktop (email-based linking, magic link, or self-reported “how did you hear about us”).
Attribution rules you can explain to a CFO
Pick an attribution model and stick to it for weekly decisions. A workable baseline is:
- First-touch for acquisition learning: helps you understand which channels create net-new demand.
- Last-touch for conversion diagnosis: helps you see which steps push users over the line.
- Account-level rollups: aggregate users to account_id for pipeline and revenue.
If you are still building the event foundation, this guide on analytics events tracking can help you keep the scope tight and KPI-driven.
Analyze Marketing Data With Funnels, Cohorts, and Segments
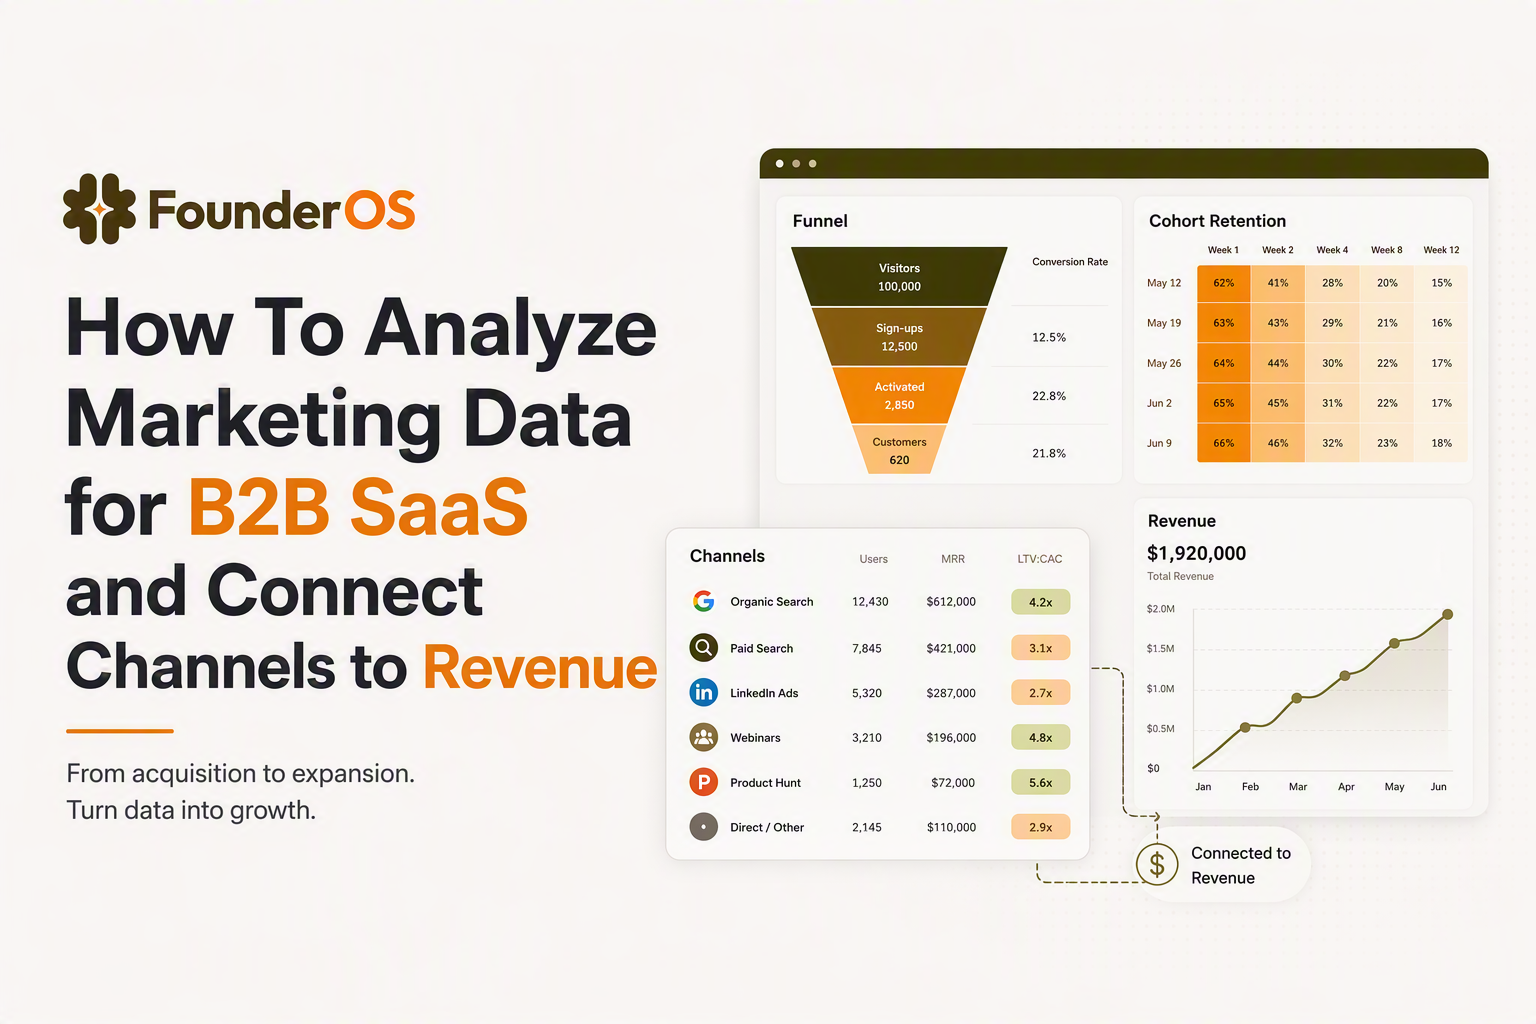
Marketing performance becomes predictable when you analyze marketing data as a channel-to-activation system instead of a channel-to-click system. The three cuts that consistently produce actions are: (1) channel-to-activation funnels, (2) retention cohorts by source, and (3) persona or behavior-based segments.
1) Channel-to-activation funnel cuts (the default weekly view)
Build one canonical funnel and slice it by utm_source or campaign:
- Visit landing page
- Signup completed
- Activation step 1 completed (within 1 day)
- Aha action completed (within 7 days)
Then apply two diagnostics:
- Drop-off localization: identify the single step with the largest loss for each channel.
- Time window: compare “within 24 hours” vs “within 7 days” to separate urgency problems from clarity problems.
For a more detailed workflow, use conversion funnel analysis tactics that end in specific fixes, not just drop-off charts.
2) Cohort retention by acquisition source (where quality shows up)
Run weekly cohorts by signup week and measure retention as “performed core action at least once in week 2/3/4.” If you only measure DAU/WAU, you will miss whether users do the action that drives value.
- Good sign: paid search retains worse than organic in week 1 but converges by week 3, implying slower time-to-value not worse fit.
- Bad sign: a channel spikes signups but retention collapses after week 1, implying message mismatch or wrong persona.
3) Segmentation that ties marketing promises to product reality
Segment on what users did, not only who they are. Examples:
- Fast activators: reached aha in under 1 day.
- Stalled evaluators: completed signup but not activation step 1 within 3 days.
- Feature-qualified: used feature X twice in first week (often a stronger signal than job title).
We initially assumed role-based personas would explain activation variance, but behavior-based segments explained it faster because they reflected actual intent. Once we grouped users by their first three events, the “why” behind channel performance became much easier to diagnose.
If you are mapping the stages and events of a user funnel, keep it consistent across marketing and product so source comparisons do not change week to week.
Turn Insights Into a Weekly Experiment Loop
A weekly loop turns analysis into compounding gains by enforcing cadence, thresholds, and measurement discipline. Without a loop, teams “analyze marketing data” repeatedly but ship inconsistent changes and cannot attribute lift.
Weekly cadence that fits a lean B2B SaaS team
- Monday: pull channel-to-activation funnel slices and retention cohorts; flag anomalies.
- Tuesday: pick 1 to 2 experiments using prioritization rules; define success metric and guardrail.
- Wednesday to Friday: ship changes (creative, landing page, onboarding step, lifecycle email).
- Next Monday: read results using the same windows, definitions, and segments.
Prioritization rules (simple, measurable, hard to game)
- Impact estimate: focus on the step with the biggest absolute drop-off volume, not the biggest percentage drop.
- Confidence gate: do not call winners on tiny samples; if volume is low, batch weeks or test bigger changes.
- Effort cap: prefer experiments that take under a week and touch one variable (message, step order, friction).
How to measure lift without a data team
- Use pre/post with a holdout when possible: if you can split traffic, do it; if not, compare to a stable baseline channel.
- Lock definitions: keep event names, attribution rules, and time windows unchanged during the test.
- Report both outcome and mechanism: activation rate changed (outcome) because step 2 completion improved (mechanism).
The Common Failure Modes and How to Fix Them Fast
Most teams fail to analyze marketing data accurately for the same four reasons: attribution drift, small samples, mixed identities, and vanity metrics that hide product mismatch. Each has a practical fix you can implement in days, not quarters.
Failure mode 1: Attribution changes every week
- Symptom: the “best channel” keeps changing, and no one trusts the dashboard.
- Fix: freeze UTM standards and define a single source-of-truth field for “acquisition source,” including rules for organic, direct, referrals, and sales-assisted signups.
Failure mode 2: You are reading noise (small samples)
- Symptom: a campaign looks amazing on 10 signups and terrible the next day.
- Fix: set minimum sample thresholds for decisions (for example, “do not reallocate budget until at least X activated signups”); if you cannot reach the threshold, aggregate by week or by campaign group.
Failure mode 3: Mixed identities break channel-to-revenue linking
- Symptom: users show up as multiple people, or accounts cannot be tied to pipeline.
- Fix: enforce identity merge at signup, require account_id on all key events, and align CRM account IDs with product account IDs.
Failure mode 4: Vanity metrics win because they are easy
- Symptom: CTR and MQLs improve while activation and retention stagnate.
- Fix: promote activation and retained core-action to the first page of weekly reporting; demote CTR to a diagnostic metric, not a goal.
If you are choosing a stack to support this workflow, prefer tools that unify acquisition properties with product events and cohorts. This shortlist of analytics software tools explains what to look for so you do not end up stitching spreadsheets forever.
| Analysis cut | Best for answering | Minimum data required | Common pitfall |
|---|---|---|---|
| Channel-to-activation funnel | Where each channel loses users | UTMs + activation events + time windows | Changing activation definition mid-test |
| Retention cohorts by source | Which channels bring users who come back | Signup date + core-action event | Using DAU/WAU instead of value action |
| Behavior segments | Which users are stuck and why | Event sequences + account context | Segmenting only by demographics |
FAQ
What is the fastest way to analyze marketing data without a data team?
The fastest path is to define one activation event sequence, enforce UTM standards, and review a single channel-to-activation funnel every week. If you can only do one cut, prioritize activated signups per channel over CPL.
Which metrics should a B2B SaaS team stop using as primary goals?
Stop using CTR, raw traffic, and MQL volume as primary goals unless they are proven to correlate with activation and pipeline for your product. Keep them as diagnostics while you optimize for activation rate, time-to-value, and pipeline per activated account.
How do you handle users who click an ad on one device and sign up on another?
Make identity linking part of the signup flow: email-based linking is the most reliable, and a “how did you hear about us” field can serve as a backstop when UTMs are lost. The key is to write down the rule and apply it consistently so source comparisons stay stable.
How often should we change attribution models?
Rarely. Pick a simple model for weekly decisions (often first-touch for acquisition learning plus a last-touch view for conversion diagnosis) and keep it fixed for at least a quarter so trends and experiments are comparable.
If you want to implement this workflow without stitching spreadsheets, Founder OS helps you connect acquisition channels to product events, build channel-to-activation analysis, and review a weekly GTM report alongside onboarding changes so you can analyze marketing data and act on it faster.
Read Next
View all
Free Product Tour Software That Actually Drives Activation, A Buyer Checklist and Fast Setup Plan
Choose free product tour software that boosts activation. Use this checklist to avoid free-plan traps and launch a measurable tour in 60 minutes.

User Engagement Metrics for B2B SaaS You Can Implement This Week
A practical framework to choose user engagement metrics, instrument them in GA4 and product analytics, and turn signals into activation and retention wins.
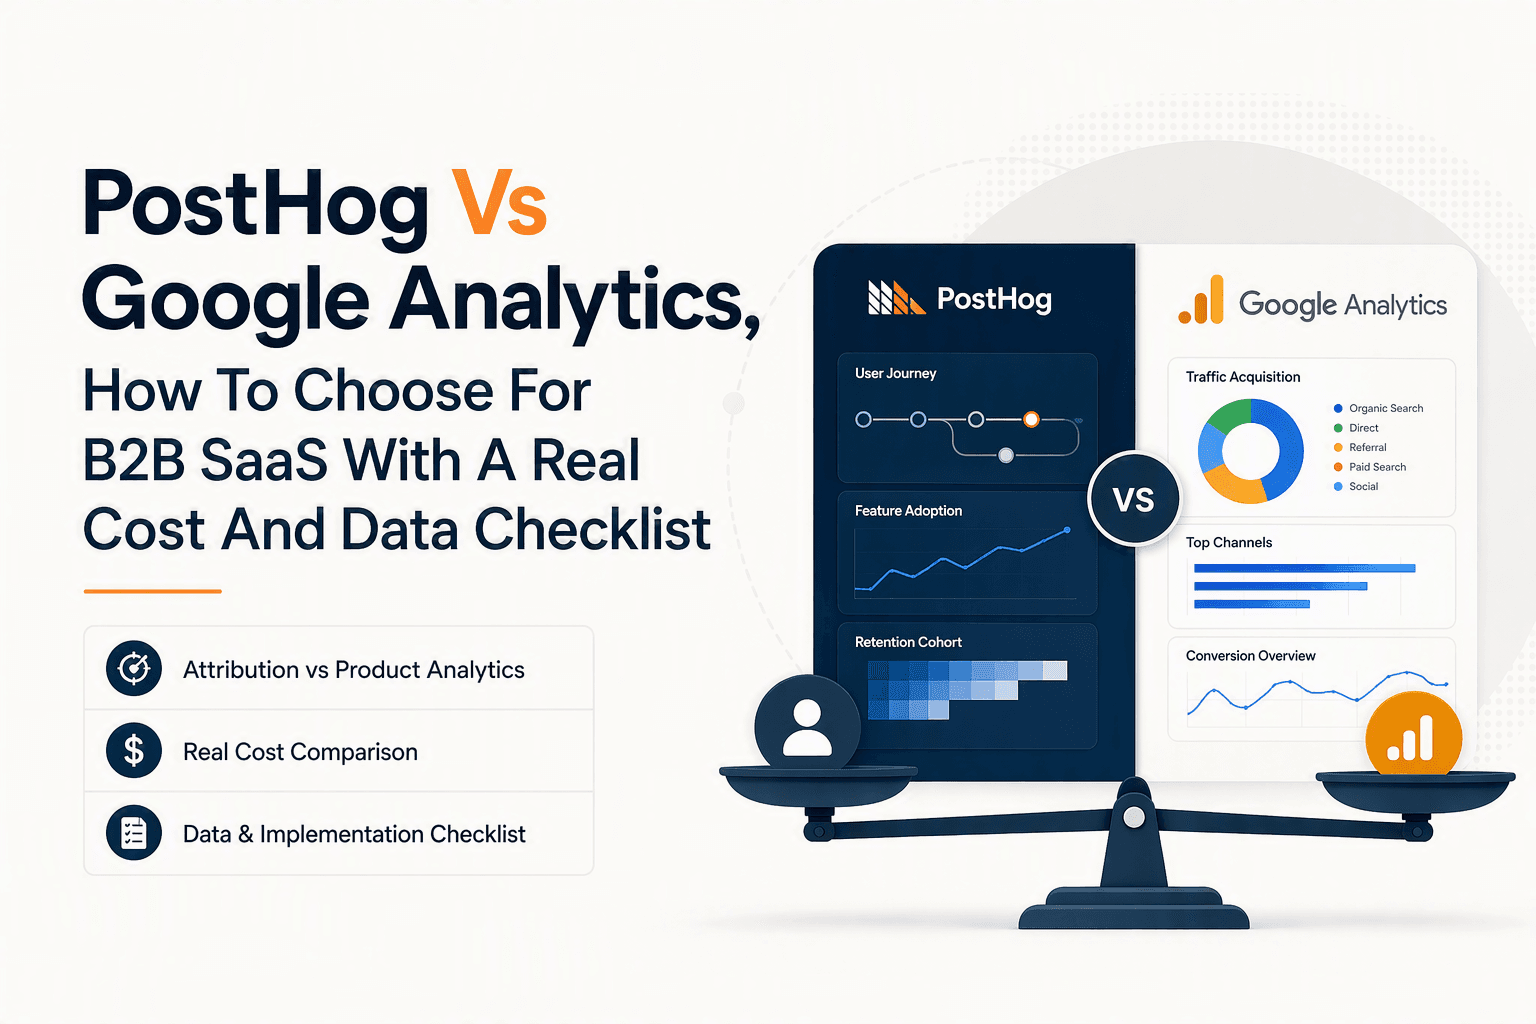
PostHog Vs Google Analytics, How To Choose For B2B SaaS With A Real Cost And Data Checklist
posthog vs google analytics for B2B SaaS: compare attribution vs product analytics, real costs at scale, data mismatches, and a 30–60 day run-both plan.