
Click Analytics Explained, How Click Tracking Works and What to Measure First
Learn click analytics for B2B SaaS: how click tracking works end-to-end, what to measure first, and how to interpret results without traps.
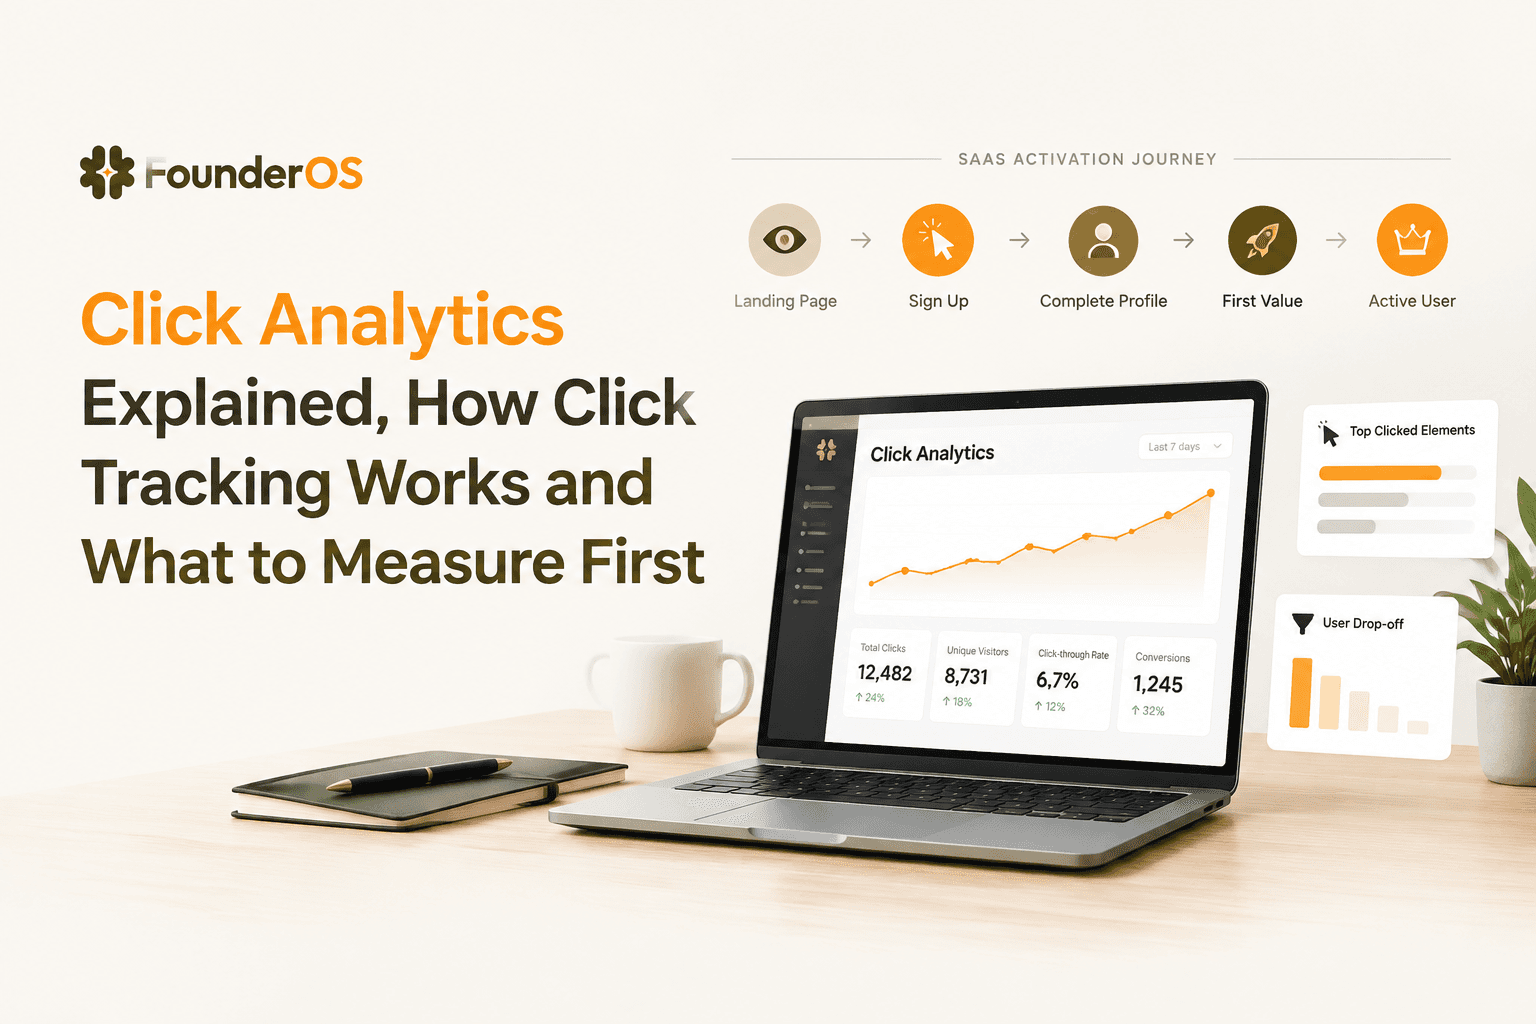
Click analytics is the practice of measuring which UI elements users click, in what context, and what those clicks lead to, so SaaS teams can improve activation and conversion with evidence instead of guesses.
- Track clicks as part of a journey (intent + context + outcome), not as vanity counts of button taps.
- Choose the right lens for the question: click analytics, clickstream, heatmaps, or session replay each answers different problems.
- Start with a small click taxonomy and a short report that ties clicks to activation and drop-offs, then expand only when decisions require it.
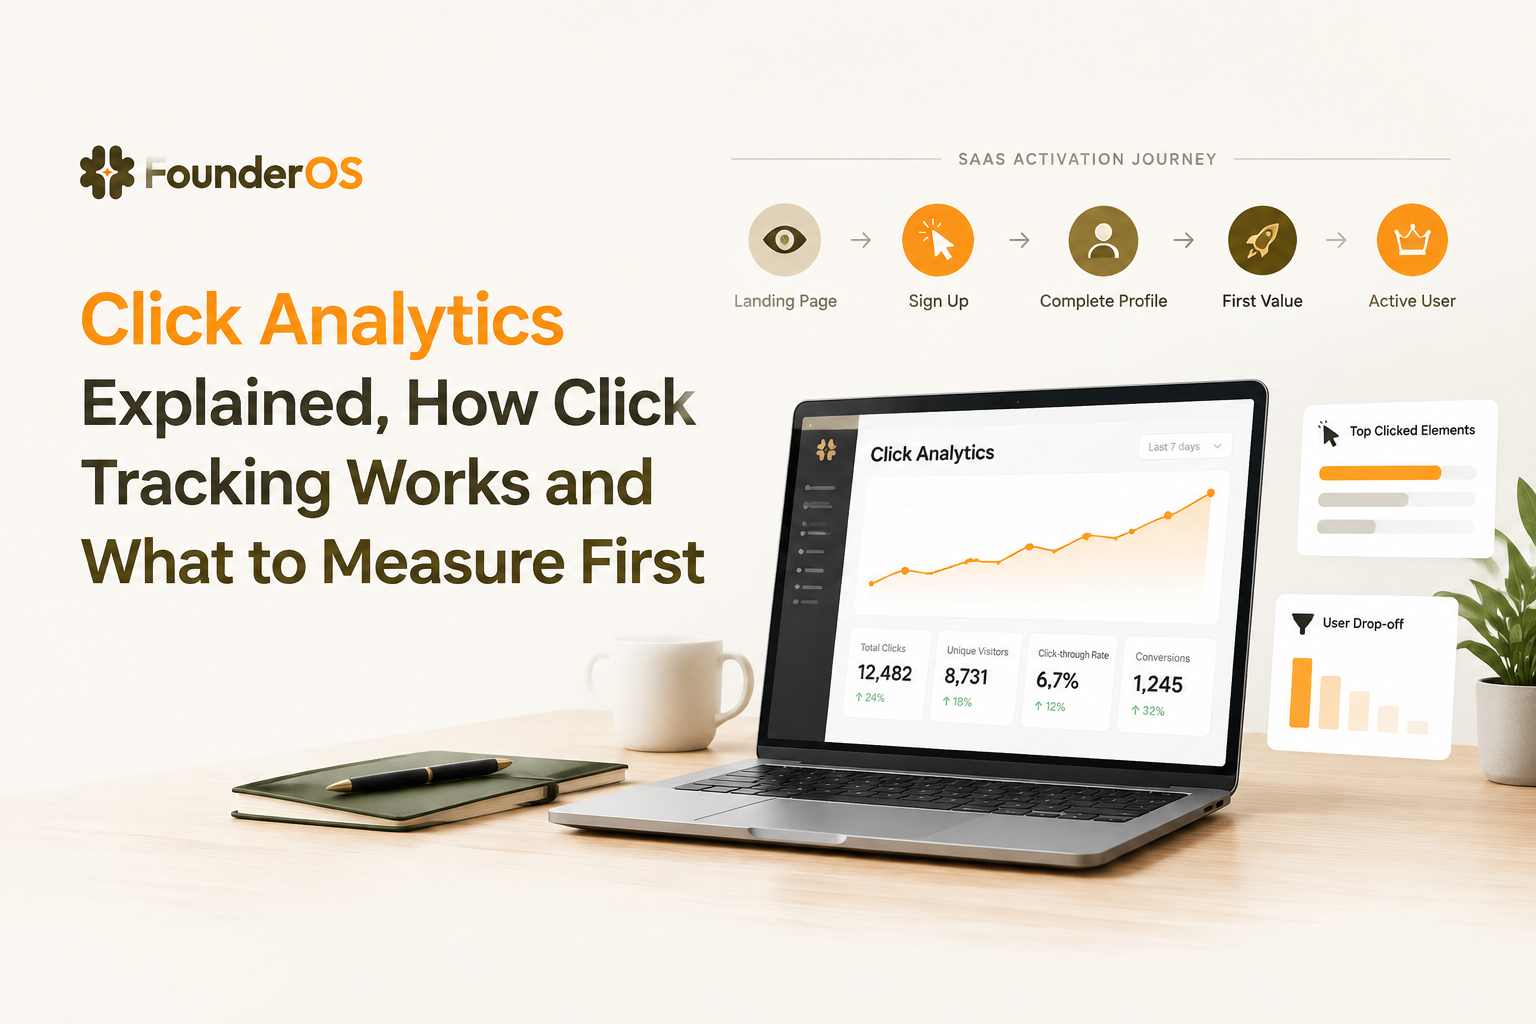
What Click Analytics Really Measures and Why SaaS Teams Use It
Click analytics measures user intent signals inside the product interface by recording a click event plus its context (what was clicked, where, when, and by whom) and linking it to downstream outcomes like signup completion, activation, and feature adoption.
The common pain is that teams see conversion drop-offs but cannot tell which interaction is causing the stall. Click data helps answer practical questions such as:
- Discoverability: Are users finding the primary action (for example, “Create project”) on their first session?
- Friction: Are users clicking “Next” repeatedly on onboarding but not reaching the first key action?
- Misleading UI: Are users clicking non-clickable elements (suggesting they expect them to be interactive)?
Consequences of not measuring clicks (or measuring them poorly) show up fast: you ship UI changes based on opinions, you over-index on page views, and you blame acquisition quality when the real issue is inside the product path.
A lightweight framework we use to keep click analytics decision-driven has four steps:
- Pick the decision first: for example, “Should we move the primary CTA above the fold on the setup screen?”
- Define the click in context: element + screen + state (logged-in vs logged-out, plan, role) + device.
- Connect click to an outcome: activation event within a time window (for example, within 24 hours).
- Segment before you conclude: new vs returning, self-serve vs sales-led, trial vs paid.
In our experience working with early-stage B2B SaaS teams, the biggest win comes from mapping 5 to 10 “make-or-break” clicks to the activation moment, rather than tracking every UI tap.
Click Analytics vs Clickstream vs Heatmaps vs Session Replay
Different interaction tools answer different questions, so click analytics works best when you choose it intentionally rather than treating it as a universal substitute for product analytics.
Use this comparison to pick the right method by question type:
| Approach | What it captures | Best for | Example question | Common trap |
|---|---|---|---|---|
| Click analytics | Structured click events with properties | Measuring UI engagement tied to outcomes | Do users who click “Invite teammate” activate more? | Tracking too many elements without outcomes |
| Clickstream | Ordered sequence of events (not only clicks) | Understanding paths and drop-offs | What are the top 3 paths to “First report created”? | Assuming the most common path is the best path |
| Heatmaps | Aggregated click density by page/screen | Quick UX diagnostics on a single screen | Are users clicking the pricing FAQ more than the CTA? | Ignoring cohort differences (new vs power users) |
| Session replay | Playback of user sessions (mouse, scroll, input) | Qualitative debugging of specific issues | Why do users rage-click the integration toggle? | Watching replays without a hypothesis |
When click analytics is the right first choice
- You have a clear activation definition and need leading indicators.
- You suspect a UI element is not discoverable or is distracting.
- You want to compare interaction patterns across cohorts using consistent event names.
When to start elsewhere
- If you need to see how people struggle (cursor movement, form confusion), use session replay with a short list of target sessions.
- If the question is about paths across multiple screens, you likely want broader event analytics beyond clicks alone.
How Click Tracking Works End-to-End From Browser Click to Report
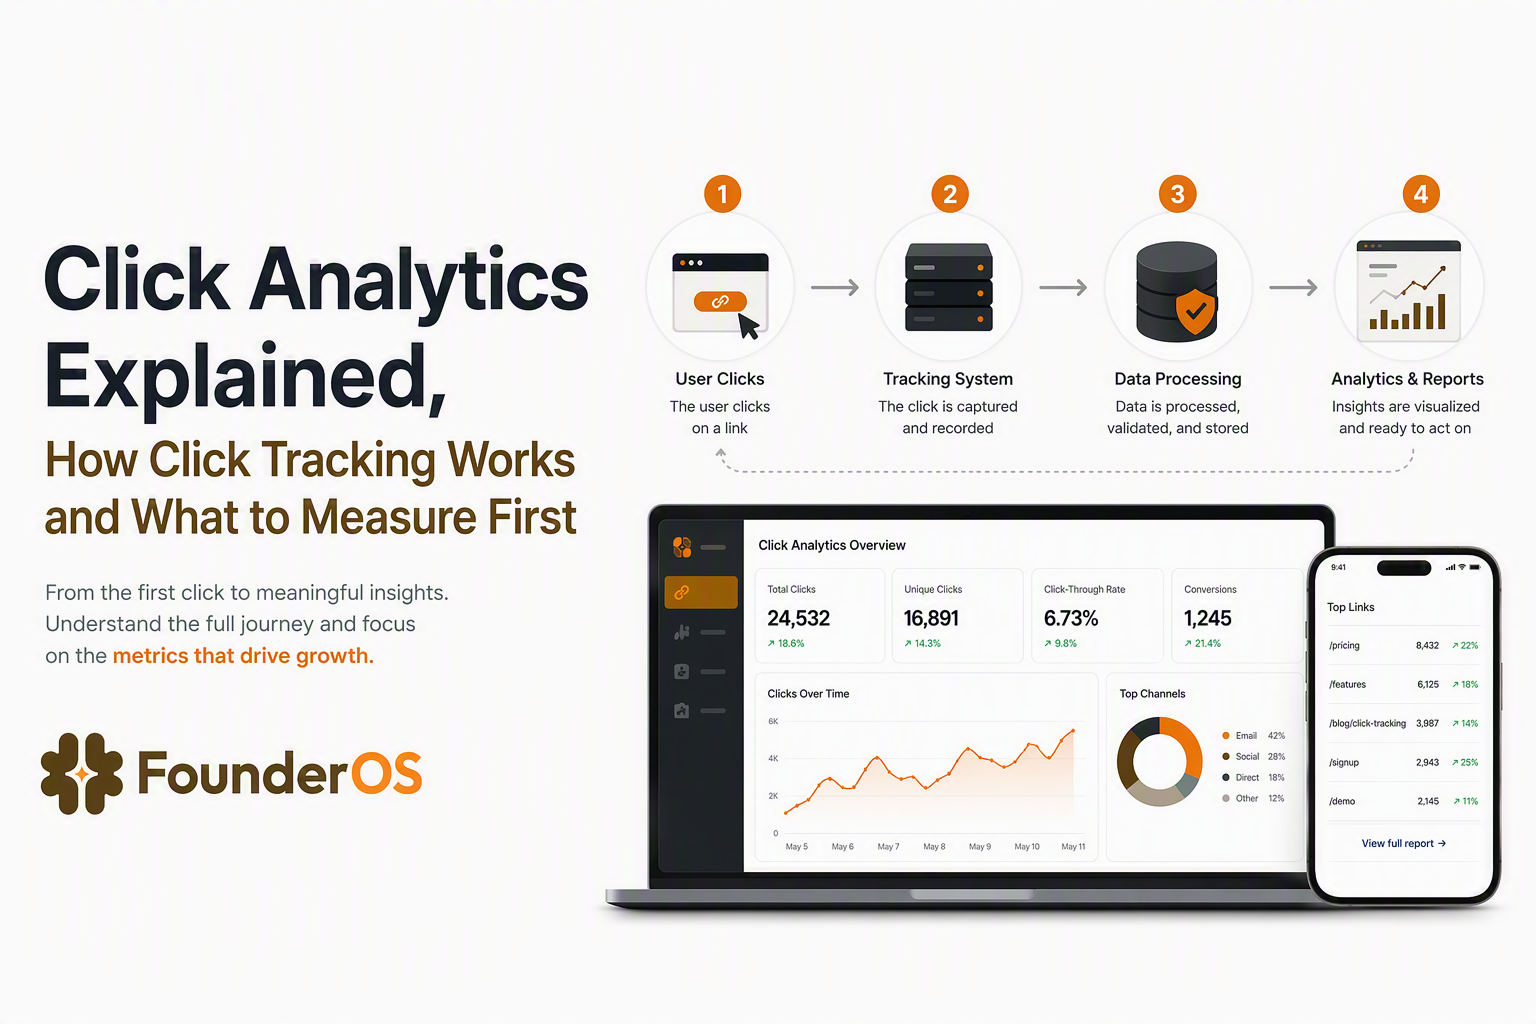
Click tracking works by listening for browser interaction events, attaching metadata, sending the event to a collection endpoint, then transforming it into queryable reports and funnels.
Step-by-step pipeline
- DOM interaction: the browser fires a click event on a target element.
- Capture layer: a script, SDK, or tag manager listens and decides what to record (for example, only elements with a data attribute).
- Enrichment: the client adds properties like page URL, screen name, referrer, device type, experiment variant, and an anonymous user ID.
- Transport: the event is sent via HTTPS to a backend endpoint; batching reduces network overhead.
- Processing: backend validates schema, applies filters (bot rules), and stores events.
- Identity linking: anonymous IDs are linked to known users after login or signup, so pre-signup clicks are not lost.
- Reporting: dashboards, retention, and funnel analysis queries turn raw events into insights.
Two collection methods and their trade-offs
- Auto-capture: faster time-to-data, good for early discovery. Trade-off: higher risk of noisy events and brittle element identifiers when UI changes.
- Explicit instrumentation: developers fire named events in code. Trade-off: slower setup, but cleaner definitions and more stable tracking over time.
What surprised our team was how often “auto” click tracking inflated counts because it captured clicks on nested elements (icon inside a button) as separate events; we now normalize to a single semantic target per action.
Privacy and governance basics for click data
- Do not capture sensitive fields: avoid raw text input, passwords, payment details, or free-form notes. Consider using allowlists for properties.
- Prefer stable selectors: use data attributes (for example,
data-analytics="invite_teammate_cta") instead of CSS classes that change. - Respect consent: if your product requires consent banners in certain regions, ensure click collection honors those settings. A practical reference is the UK GDPR guidance for lawful processing concepts.
A Practical SaaS Click Measurement Blueprint What to Track, Name, and Report
A practical click analytics blueprint starts with a small set of high-leverage clicks, a consistent naming system, and a weekly report that ties interaction to activation and drop-offs.
1) Start with 3 categories of clicks
- Activation clicks: clicks that should directly lead to the first value moment (for example, “Create workspace”, “Connect integration”, “Generate first report”).
- Navigation clicks: clicks that indicate intent to explore (sidebar items, tabs), helpful for diagnosing wrong turns.
- Support clicks: “Docs”, “Chat”, “Pricing”, “Request demo”, which can signal confusion or high intent.
2) Use an event taxonomy that stays stable
Use a single click event with properties, or separate named events, but keep the semantics consistent. A clean starter taxonomy looks like this:
- Event name:
ui_click - Required properties:
element(semantic name likeinvite_teammate_cta)screen(likeonboarding_team)location(likeheader,modal,sidebar)state(liketrial,paid,logged_out)experiment_variant(optional but useful)
If you prefer separate names, keep the pattern: click_[screen]_[element]. The key is that the name should reflect intent, not implementation details like button color.
3) Define “what to track first” with a prioritization checklist
- Decision relevance: Would we change the product if this moved?
- Volume sufficiency: Do we expect enough users to click weekly to detect movement?
- Outcome linkage: Can we connect it to activation, retention, or revenue events?
- Ambiguity: Does the element have a single meaning, or multiple interpretations?
After running multiple tracking audits, the pattern was clear: teams get more value by instrumenting 10 well-defined interactions than by collecting 200 vague clicks they never review.
4) Build a weekly click report that forces interpretation
Below is a mock report structure that keeps click analytics tied to outcomes rather than raw activity:
| Element (semantic) | Screen | Unique users clicked (7d) | % of new users | Activation rate after click (24h) | Top drop-off step after click | Next action |
|---|---|---|---|---|---|---|
| connect_integration_cta | onboarding_integrations | [fill] | [fill] | [fill] | [fill] | Run a funnel by cohort; inspect 10 replays |
| invite_teammate_cta | workspace_settings | [fill] | [fill] | [fill] | [fill] | Test moving CTA earlier in onboarding |
| pricing_link | billing_modal | [fill] | [fill] | [fill] | [fill] | Clarify plan limits copy; add inline FAQ |
5) Interpret click analytics without the common traps
- Trap: clicks equal success. A high click rate can mean confusion (users hunting). Pair clicks with completion events.
- Trap: last click attribution. The last click before activation is not always the cause. Use sequences and compare cohorts.
- Trap: ignoring non-clickers. Segment users who never click the CTA; their path often reveals the real UI issue.
For deeper instrumentation planning, a KPI-first method helps prevent noise. See analytics events tracking for a structured way to pick events that map to business outcomes.
FAQ about click analytics
How many clicks should a SaaS product track at the start?
Start with 10 to 20 high-leverage elements tied to activation and top navigation. Expand only when a new product decision requires more detail, otherwise you create noise and reporting debt.
Should click analytics use one event name or many?
Either can work, but beginners usually do best with one ui_click event plus strong properties (element, screen, location, state). Many separate events can be readable, but they tend to multiply and drift without strict naming rules.
What is the difference between click analytics and conversion funnel analysis?
Click analytics focuses on interaction with UI elements, while conversion funnel analysis measures drop-offs between defined steps (which may include clicks, page views, or backend events). In practice, clicks often explain why a funnel step is failing.
How do clicks help identify high-intent users?
Clicks on specific actions (like “Invite teammate”, “Connect integration”, “View pricing”) can act as intent signals when they reliably correlate with activation or expansion. Combine click events with outcome events and build a behavioral segment; this pairs well with a guide like how to identify high intent users in saas.
If you want a lightweight next step, use the taxonomy and weekly report template above as an event-tracking checklist, then try Founder OS to centralize click events, user profiles, segmentation, and GTM reporting so your click analytics stays tied to real activation outcomes.
Read Next
View all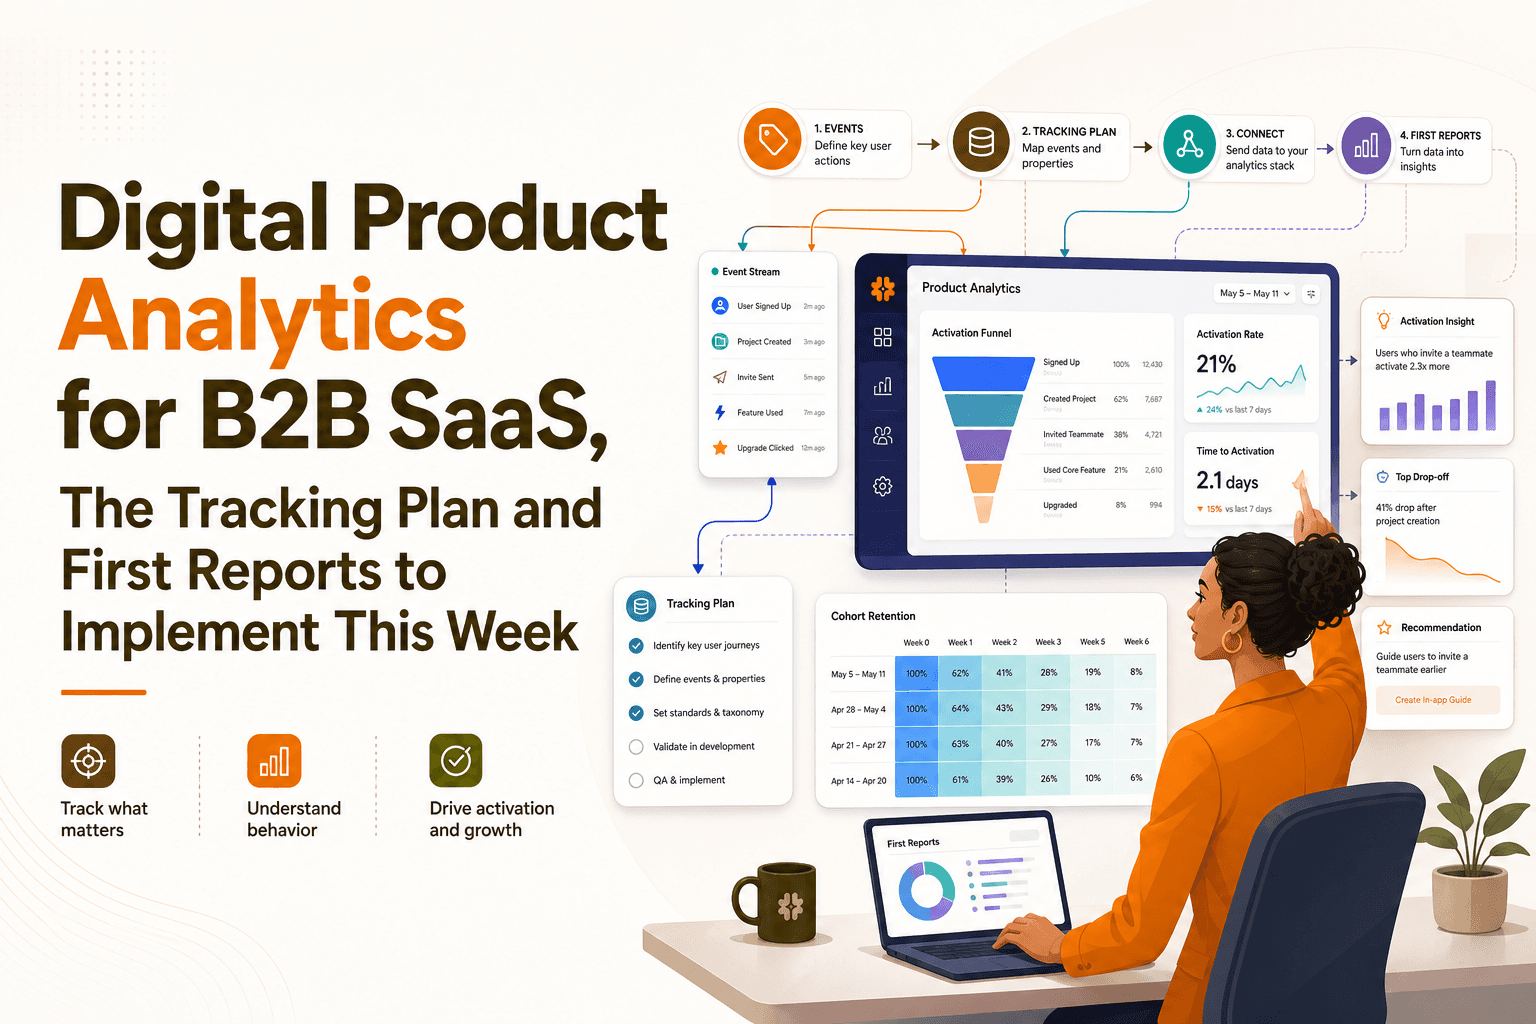
Digital Product Analytics for B2B SaaS, The Tracking Plan and First Reports to Implement This Week
Implement digital product analytics in a B2B SaaS: a minimal event schema, week-1 funnel and retention reports, and a 7-day rollout plan.
Customer Onboarding Process Explained for B2B SaaS Teams
Learn the customer onboarding process from signup to first value, plus a simple framework to reduce friction and improve activation.

How to Identify High-Intent SaaS Users From Product Behavior
Learn how FounderOS uses event tracking, funnels, and account scoring to identify high-intent users and turn product usage into growth signals.
