
Product Manager Analytics, Two Meanings, One Practical Playbook
Product manager analytics usually means one of two things: a dedicated Analytics Product Manager role, or the analytics practice every PM needs to make decisions from user behavior and revenue signals.
- Pick the right track: Analytics PM (owns data products) vs PM analytics practice (uses data to ship better product decisions).
- Run a weekly cadence that forces decisions: metrics review, diagnosis, hypothesis, experiment, and stakeholder readout.
- Use copy-paste artifacts (taxonomy, tracking plan, metric definitions, readout) so your analytics becomes decision-grade, not dashboard theater.

Which meaning of product manager analytics are you using: Analytics PM role vs PM analytics practice
Product manager analytics splits cleanly into (1) an Analytics PM career track and (2) a day-to-day analytics practice that supports product work, and choosing the wrong mental model is the fastest way to mis-scope your work.
Intent selector (60 seconds)
- You likely mean an Analytics PM role if you own a data product: event pipelines, metrics layer, experimentation platform, analytics UI, attribution, governance.
- You likely mean PM analytics practice if you ship product features and need trustworthy answers to questions like “Where do users drop off?” and “Did our onboarding change improve activation?”
Comparison table: what changes in goals, deliverables, and success metrics
| Dimension | Analytics PM (career role) | PM analytics practice (day-to-day) |
|---|---|---|
| Primary customer | Internal teams (Product, Growth, Sales, CS, Finance) | Your product area (activation, adoption, retention) |
| Main output | Reliable measurement capability | Decisions and experiments backed by evidence |
| Core deliverables | Event standards, identity rules, metric layer, dashboards, governance | Funnels, cohorts, segments, experiment readouts, PRD metrics |
| Success metrics | Data quality, adoption of reports, time-to-answer, coverage | Lift in target metric, reduced uncertainty, faster iteration |
| Typical pitfalls | Building tooling without clear use cases | Trusting messy instrumentation, changing definitions mid-quarter |
| Where you spend time | Aligning stakeholders, designing schemas, prioritizing data roadmap | Diagnosing drop-offs, defining hypotheses, measuring impact |
How to avoid ambiguity in meetings
- Start every request with: Decision (what will change), Metric (what moves), Slice (which users), Time window (when), Confidence need (directional vs experiment-grade).
- Use two labels in docs and tickets: [Capability] for instrumentation and reporting work, [Decision] for analysis that drives a product choice.
The weekly product manager analytics operating system
A weekly product manager analytics cadence works when it produces one decision, one measurable bet, and one stakeholder update every week, even if the bet is “do nothing yet.”
Weekly cadence (90 minutes total) with concrete outputs
- Monday 20 min: Metric pulse (output: 3-line narrative)
- One North Star or primary outcome (for activation work, pick a single “activated” definition).
- Two input metrics you can influence this week (example: onboarding completion rate, core feature adoption in day 0 to day 2).
- One guardrail (example: trial-to-paid conversion, error rate, support tickets).
- Tuesday 30 min: Diagnose one break (output: ranked list of 3 hypotheses)
- Pick one funnel with the largest absolute user loss, not the lowest conversion rate.
- Segment by at most two dimensions (channel and persona, or plan and company size).
- Write hypotheses in “Because…, users…, causing…” format.
- Wednesday 20 min: Commit to one bet (output: experiment or change plan)
- Define a primary metric, an exposure rule, and a minimum observation window.
- Choose: A/B test, holdout, phased rollout, or before/after with strong guardrails.
- Friday 20 min: Readout (output: one-page update)
- What changed, what you saw, what you will do next week.
- Attach links to the exact funnel/cohort views used so definitions do not drift.
Decision rules that prevent dashboard theater
- One funnel, one segment, one decision: if you cannot name the decision, do not build the chart.
- Prefer counts over rates when prioritizing: a 5% drop on 10,000 users is usually more urgent than a 30% drop on 50 users.
- Lock metric definitions for a quarter: changes require a changelog entry and a backfill plan.
What we do when metrics disagree
After running multiple activation diagnostics across B2B trials, the pattern was clear: conflicting charts usually come from identity problems (anonymous vs logged-in), not user behavior. Our team now checks identity stitching and event de-duplication before debating product changes.
The product analytics starter kit for PMs with copy-paste templates
Product manager analytics becomes credible when you ship five artifacts together: a tracking plan, event taxonomy, property dictionary, metric definitions, and an experiment readout template.
1) Tracking plan template (what to instrument and why)
Rule: instrument decisions, not screens. If a PM cannot describe the decision the event supports, it is not in the plan. For a deeper framework on structuring events around outcomes, see analytics events tracking.
Tracking Plan
- Product area:
- Primary outcome metric:
- Key user journey:
- Funnel steps (ordered):
- Events required (name, trigger, actor):
- Properties required (per event):
- Identity rules (anonymous -> known):
- Data consumers (who uses this):
- QA plan (how to validate):
2) Event taxonomy (naming and scoping)
- Format: [Object] [Action] (examples: “Workspace Created”, “Invite Sent”, “Report Exported”).
- Avoid: UI labels ("Clicked Button"), because they break when UI changes.
- Choose one level of abstraction: either track feature-level actions or workflow-level milestones, not both for the same question.
3) Property dictionary (the minimum set that makes analysis possible)
Minimum properties we require for most B2B SaaS questions:
- user_id (stable), account_id (stable), timestamp
- source (UTM or referrer mapping), plan, role, use_case
- experiment_id and variant (when applicable)
- environment (prod, staging) to prevent pollution
Property Dictionary
- property_name:
- type (string/number/bool):
- allowed_values:
- source_of_truth:
- populated_when:
- privacy notes:
4) Metric definitions (make them unambiguous and auditable)
Every metric should include numerator, denominator, unit, time window, and exclusions. If you want a practical walkthrough for setting up first reports and definitions, use digital product analytics as a reference checklist.
Metric Definition
- name:
- intent (decision supported):
- formula (numerator/denominator):
- unit:
- window (e.g., D0-D7):
- inclusion criteria:
- exclusion criteria (bots, internal users, retries):
- data sources:
- owner:
- last_changed:
5) Experiment readout template (forces action)
Experiment Readout
- hypothesis:
- primary metric:
- guardrails:
- exposure rule:
- start/end dates:
- segments analyzed:
- result summary (direction + confidence level):
- decision (ship, iterate, revert):
- follow-ups (instrumentation gaps, next tests):

A worked example from onboarding drop-off to measurable lift
Product manager analytics is most useful when you can trace a single user journey from signup to value, quantify the biggest drop-off, and connect a change to activation lift with guardrails.
Step 1: Define activation as a behavior, not a feeling
- Activation event: “Core Value Reached” (example placeholder).
- Window: within 48 hours of signup (choose a window tied to your sales motion).
- Who counts: exclude internal users, QA accounts, and known bots.
Step 2: Build an activation funnel with explicit steps
Example funnel steps (replace with your product’s real milestones):
- Signup Completed
- Email Verified
- Workspace Created
- Integration Connected
- Core Value Reached
Diagnostic rule: prioritize the step with the largest user drop in absolute numbers, then check if the drop concentrates in a segment (for example, self-serve vs sales-assisted). If you need a structured diagnostic playbook for weird conversions, use funnel analysis to avoid false conclusions.
Step 3: Segment, then watch behavior sequences
- Segment A: users from content-led acquisition.
- Segment B: users from outbound or partner channels.
- Sequence check: do users attempt “Integration Connected” multiple times, hit errors, or abandon after viewing pricing?
We initially assumed onboarding friction was a UI problem, but event sequences showed many users repeatedly triggering the same failed integration step before churned inactivity. That changed the fix from copy tweaks to error handling and clearer prerequisites.
Step 4: Turn the diagnosis into a testable hypothesis
- Hypothesis: “Because users do not understand prerequisites for integration setup, they fail connection and abandon; adding an inline checklist plus clearer error states will increase ‘Integration Connected’ completion and raise activation within 48 hours.”
- Primary metric: conversion from Workspace Created to Integration Connected.
- Secondary: Activation within 48 hours.
- Guardrails: support tickets tagged “integration”, time-to-connect, and trial-to-paid conversion.
Step 5: Measure impact with a clean readout
- Exposure: new signups only, randomized by account_id.
- Run length: long enough to cover your activation window plus a buffer; avoid calling it early because day-of-week effects can distort onboarding.
- Decision: ship if primary metric improves without guardrail regression; otherwise iterate on the failure mode with the highest frequency in session review.
Tool checklist for decision-grade product manager analytics
Decision-grade product manager analytics depends less on pretty dashboards and more on instrumentation quality, identity, governance, and the ability to slice cohorts without rewriting definitions.
Evaluation checklist (score 0 to 2 for each)
- Event capture reliability: can you detect missing events, duplicates, retries, and client-side blockers?
- Identity and account modeling: does the system support anonymous-to-known stitching and a stable account_id for B2B analysis?
- Schema governance: can you enforce naming rules, required properties, and a changelog?
- Funnel and cohort flexibility: can PMs build funnels from any event sequence and compare cohorts side by side?
- Segmentation: can you define audiences by behavior sequences plus profile traits, and do they update automatically?
- Experiment measurement: does it support experiment_id and variant analysis cleanly?
- Revenue attribution readiness: can events and accounts be joined to plan, MRR, pipeline stage, or at least trial-to-paid outcomes?
- Time-to-first-insight: how long from install to first trustworthy funnel? Minutes, days, or weeks?
Two practical red flags
- Red flag 1: “We can answer that in SQL” is fine, but if every question requires SQL, PMs will stop asking and your analytics becomes a reporting bottleneck.
- Red flag 2: If definitions live only in people’s heads, the org will argue about numbers instead of decisions.
One body mention: implementing the starter kit without creating a data project
If you want to operationalize the templates above quickly, a platform like Founder OS can help by capturing product events, tying them to user profiles and segments, and letting you connect onboarding changes to funnel movement and GTM reporting in one workflow, so product manager analytics stays close to decisions instead of becoming a separate data initiative.
Career FAQs on Analytics PM jobs, skills, interviews, and compensation signals
Analytics PM careers reward strong product thinking plus measurement fundamentals, and hiring signals usually focus on how you define metrics, debug data trust, and influence stakeholders rather than pure SQL depth.
Skills matrix (what to be strong at)
| Skill area | Baseline | Strong signal |
|---|---|---|
| Metric design | Clear definitions, guardrails | Metric hierarchies, counter-metrics, change management |
| Instrumentation | Event taxonomy, properties, QA | Identity stitching, dedupe logic, governance processes |
| Analysis | Funnels, cohorts, segmentation | Causal thinking, experiment design tradeoffs, bias checks |
| Stakeholder influence | Runs readouts, aligns on KPIs | Drives cross-team standards and adoption with minimal friction |
| Data literacy | Understands warehouses and ETL | Designs pragmatic data contracts and evaluation frameworks |
JD outline you can use (or map yourself against)
- Own event standards, metric definitions, and analytics governance
- Ship analytics capabilities that reduce time-to-answer for product teams
- Partner with Engineering and Data to ensure instrumentation quality
- Enable experimentation and trustworthy decision-making across the org
Interview questions and what good answers contain
- “Define activation for this product.” Good answers specify a behavior, a time window, exclusions, and a reason the metric predicts retention or revenue.
- “A funnel dropped 15% overnight, what do you do?” Good answers start with data integrity checks, identity changes, release notes, then segment analysis.
- “An exec says your numbers do not match Finance.” Good answers propose a definitions doc, reconciliation steps, and a long-term metric layer plan.
- “What events would you instrument for onboarding?” Good answers use milestones, required properties, and QA tests, not UI clicks alone.
Compensation signals (how to read the range without guessing numbers)
- Broader scope (company-wide metrics layer, experimentation, attribution) usually maps to higher leveling than a team-local analytics enablement role.
- If the role owns governance and adoption across functions, expect heavier stakeholder demands and a leveling closer to core product leadership.
In our experience working with early-stage B2B SaaS teams, the best Analytics PM candidates can explain how they prevented definition drift and improved time-to-answer, not just how they built a dashboard.
| Artifact | Owner | Review cadence | “Done” criteria |
|---|---|---|---|
| Tracking plan | PM + Eng | Per initiative | Events mapped to decisions, QA steps listed |
| Event taxonomy | PM/Analytics | Monthly | Naming rules enforced, duplicates removed |
| Property dictionary | Analytics + Eng | Monthly | Required properties present, allowed values documented |
| Metric definitions | PM + Stakeholders | Quarterly | Numerator/denominator locked, exclusions defined |
| Experiment readouts | PM | Weekly | Decision made, follow-ups tracked |
FAQ
If you want the quickest path from the Starter Kit templates to live, decision-grade workflows, implement them in Founder OS so event tracking, user profiles, segmentation, GTM reporting, and onboarding measurement stay connected as you iterate.
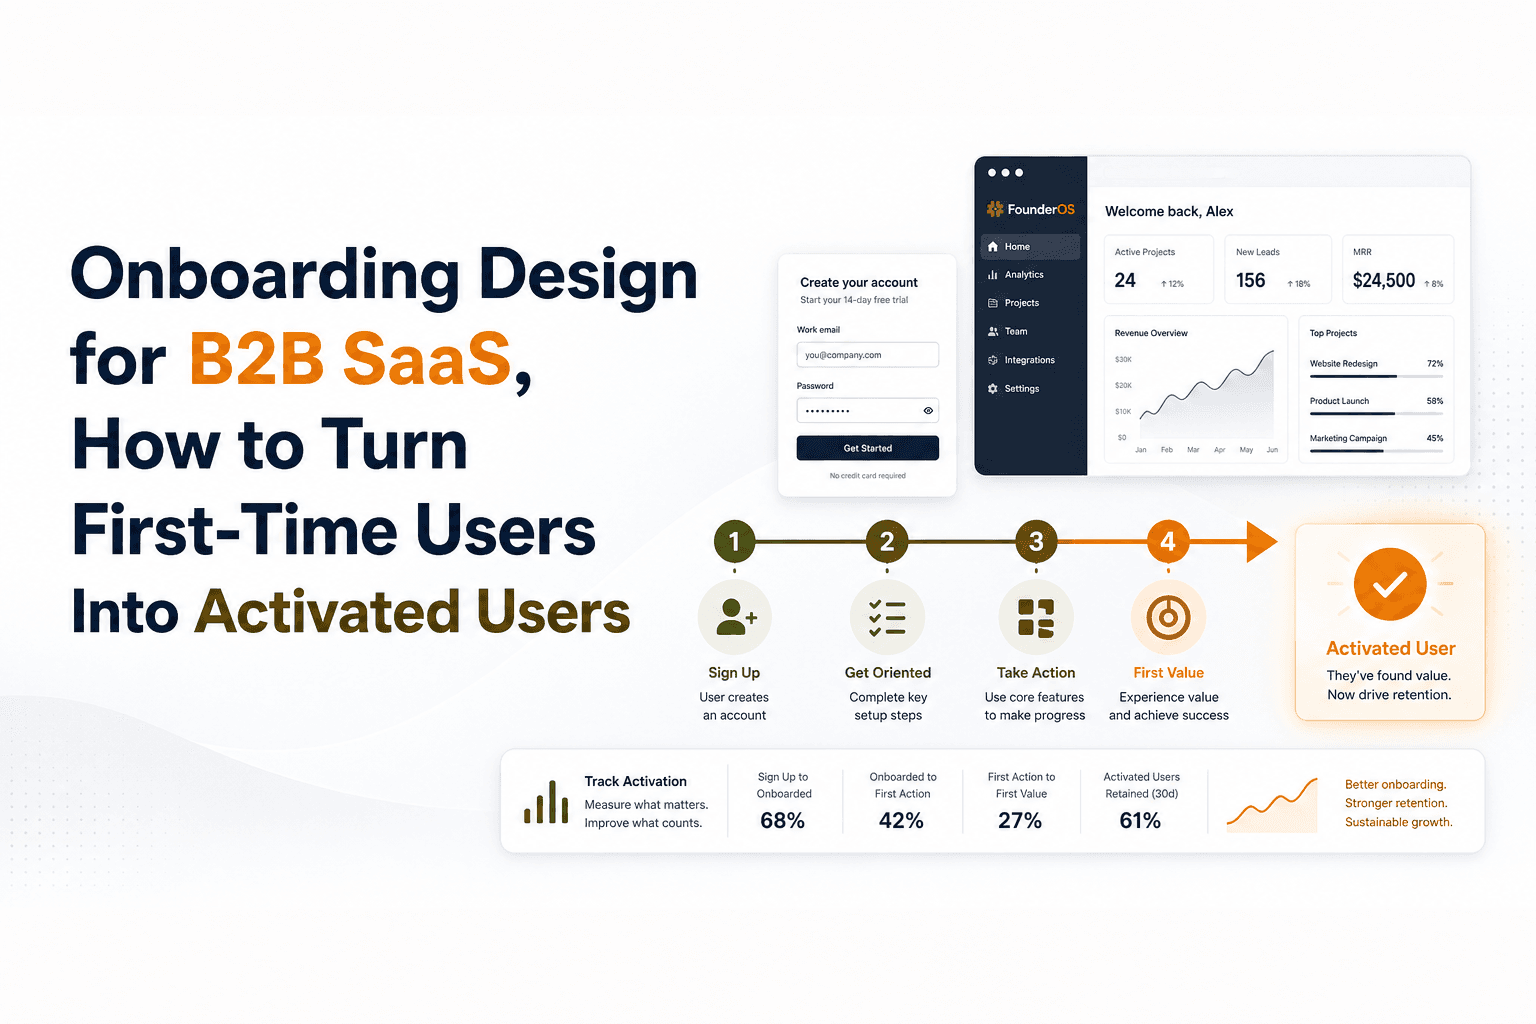
Onboarding Design for B2B SaaS, How to Turn First-Time Users Into Activated Users
Learn onboarding design for B2B SaaS: define activation, build flows and prompts, reduce friction, and measure time-to-value with simple metrics.
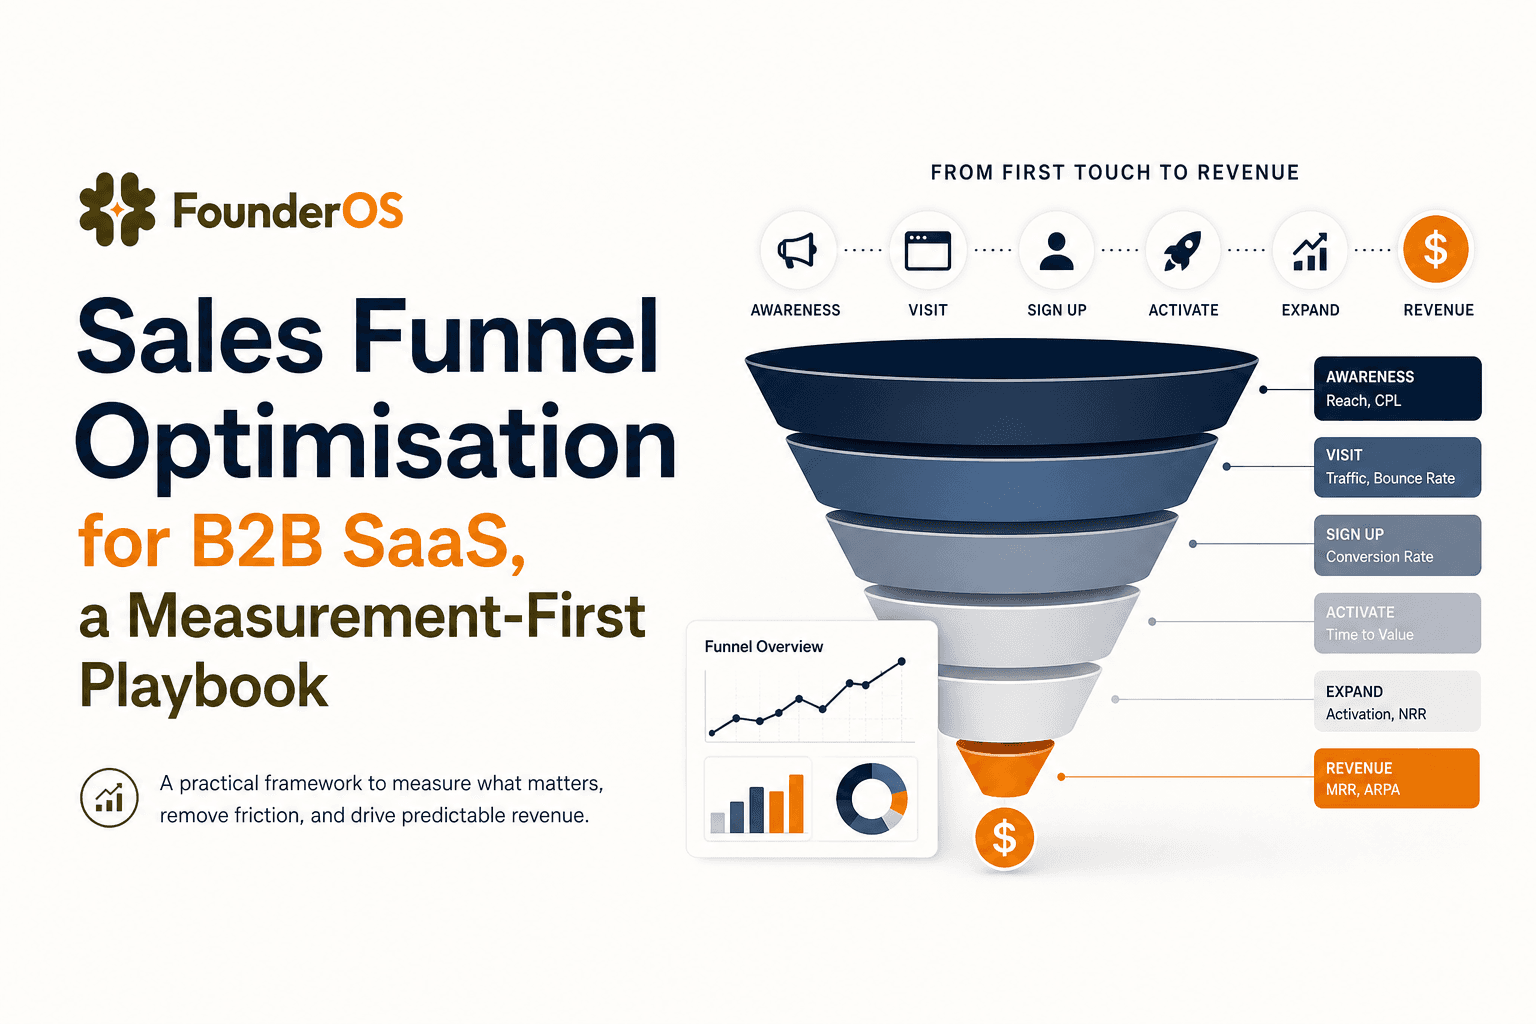
Sales Funnel Optimisation for B2B SaaS, a Measurement-First Playbook
A measurement-first guide to sales funnel optimisation for B2B SaaS: event tracking, leak diagnosis, experiments, and product-led lead scoring.
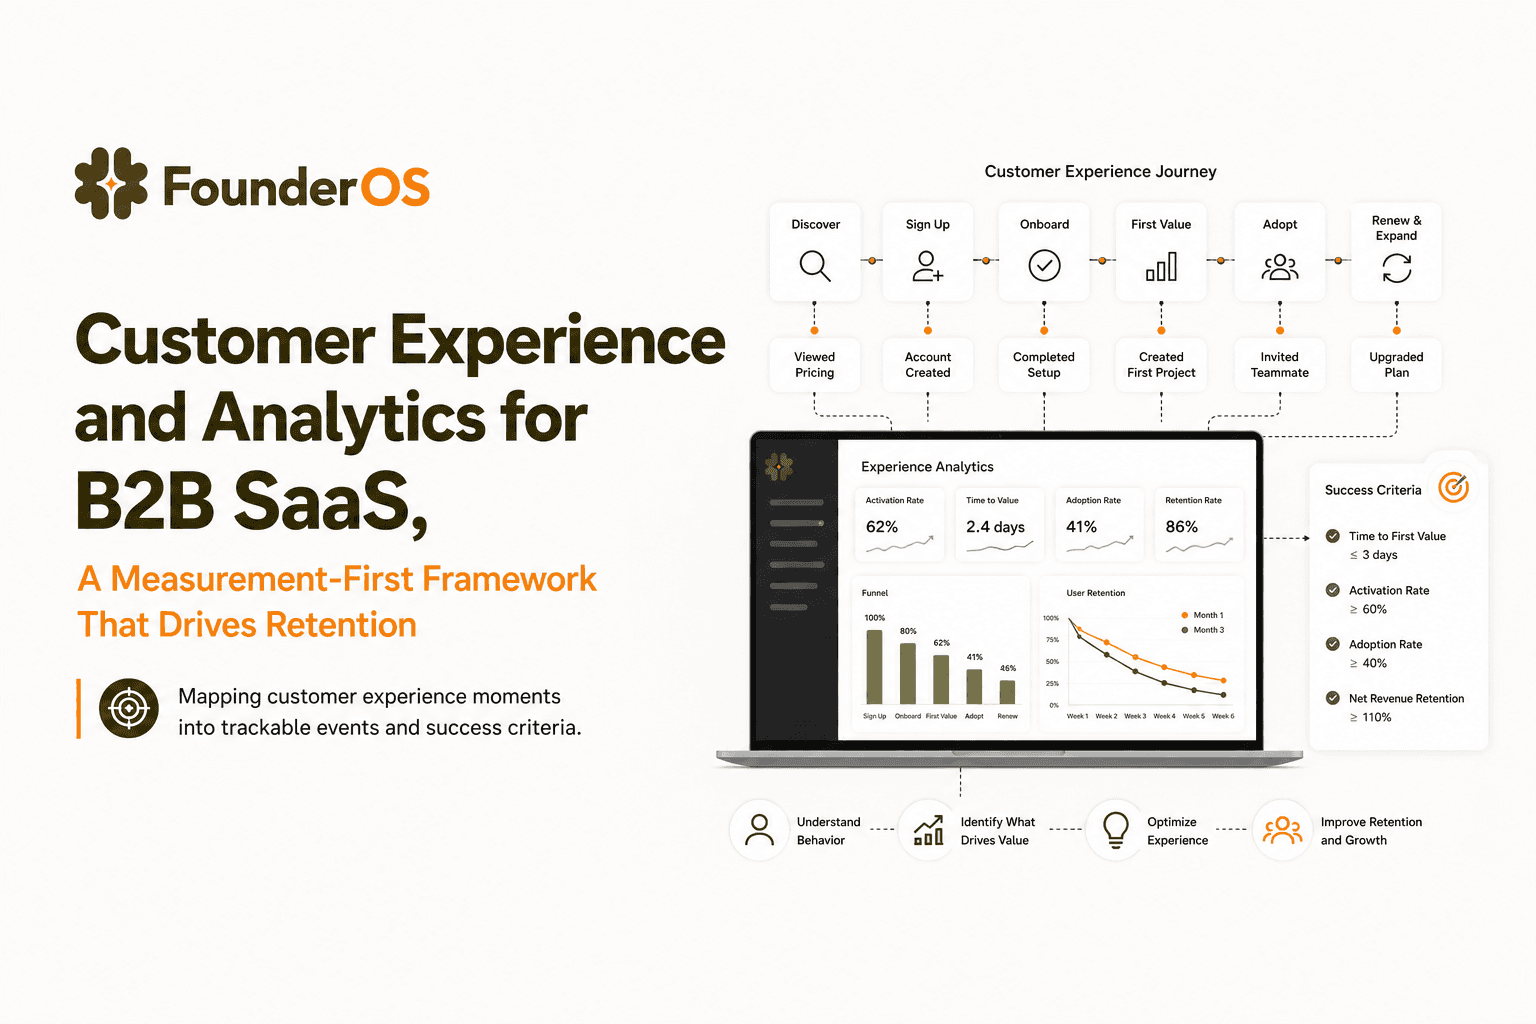
Customer Experience and Analytics for B2B SaaS, A Measurement-First Framework That Drives Retention
A practical customer experience and analytics framework for B2B SaaS to connect CX signals to activation, retention, and revenue outcomes.