
Revenue Attribution Model for B2B SaaS, A Practical Framework With Real Calculations

A revenue attribution model for B2B SaaS should allocate closed-won revenue across the marketing and sales touchpoints that preceded the deal, using a consistent definition of what is being credited and a repeatable weighting method.
- Separate sourced, influenced, attributed, and incremental revenue so one deal does not create contradictory “wins” across reports.
- Reliable attribution requires consistent IDs and timestamps across web, product, marketing automation, and CRM, plus a rule for identity resolution.
- Use a simple model first (first-touch, last-touch, linear, 50/50), then graduate to more complex weighting only when the decision requires it.
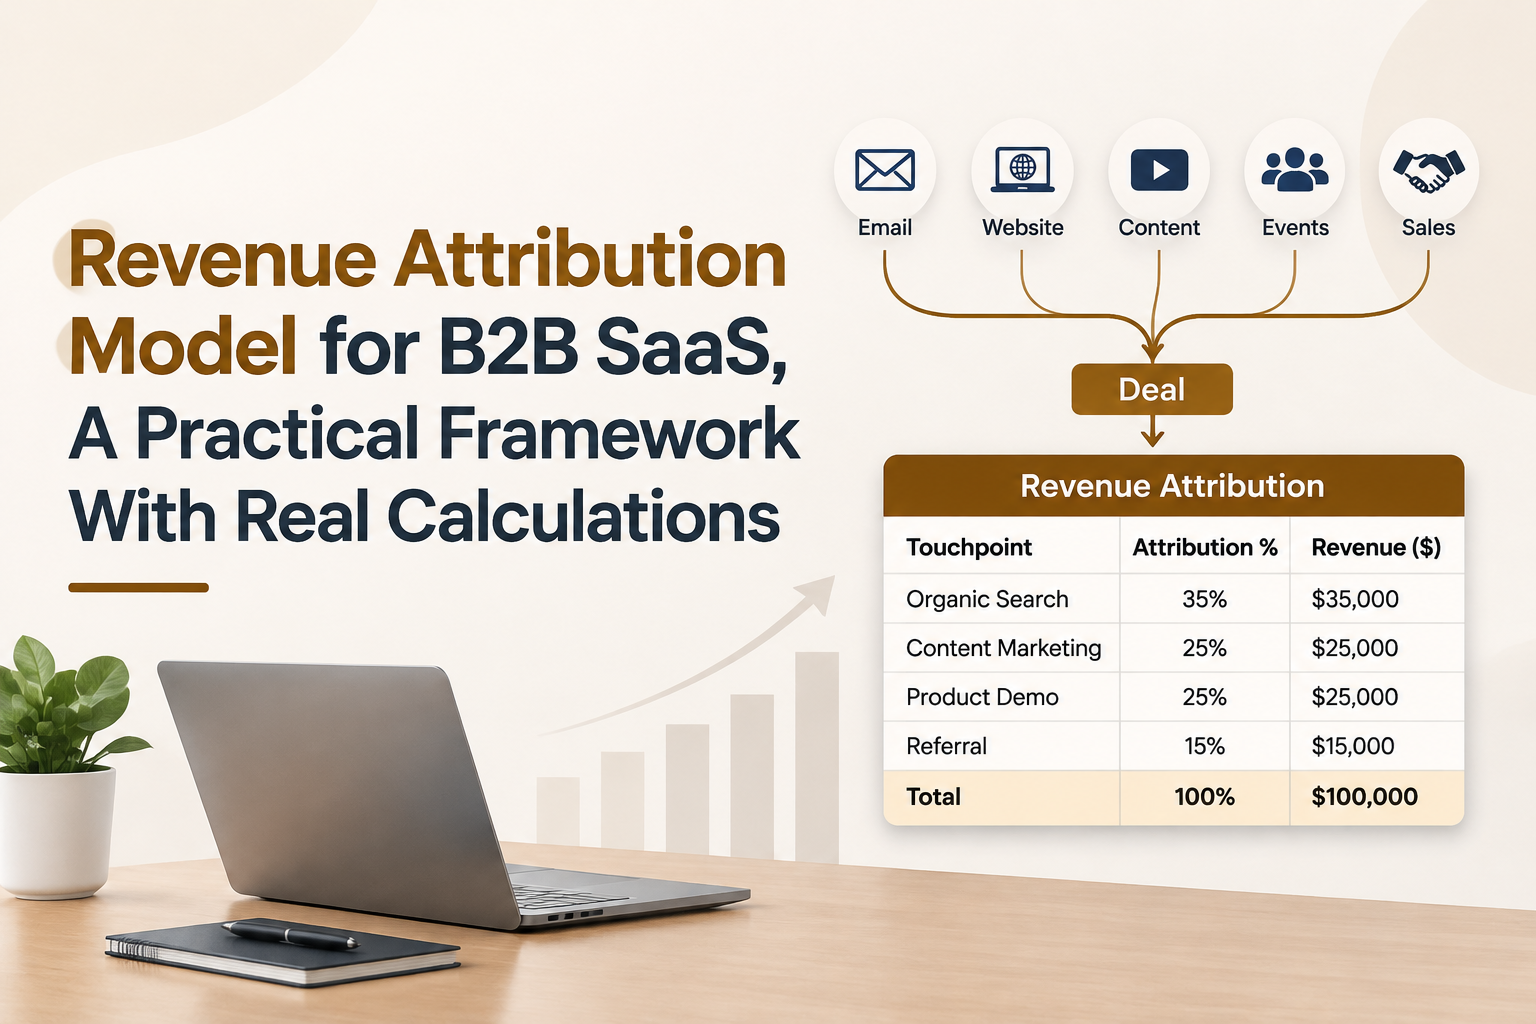
Build a revenue attribution framework that separates sourced, influenced, and incremental revenue
A revenue reporting framework works when each closed-won deal can be classified into sourced, influenced, attributed, and incremental buckets without double-counting the same dollars.
Use four revenue definitions that do not fight each other
- Marketing-sourced revenue: revenue from deals where marketing created the first identifiable contact or opportunity source (your rule must be explicit).
- Marketing-influenced revenue: revenue from deals where at least one marketing touchpoint occurred before close (broad, often high, easy to inflate).
- Multi-touch attributed revenue: revenue allocated across touchpoints using weights that sum to 100% per deal (this is where a revenue attribution model lives).
- Incremental revenue: revenue that would not have occurred without a given channel or program, estimated via experiments or quasi-experiments (hardest, closest to causality).
Why one deal can legitimately show up differently across dashboards
One $10,000 closed-won deal can be “sourced” by paid search (first form fill), “influenced” by webinars (attended mid-cycle), and “attributed” 50% to organic content and 50% to sales outreach depending on your weighting. Attribution does not prove causation; it produces a consistent accounting view so you can compare channels under a chosen rule set.
A practical guardrail to avoid executive confusion
I have found the cleanest way to avoid arguments in weekly reviews is to publish two numbers side by side: (1) sourced pipeline or revenue, and (2) attributed revenue under the current model, with a note that attributed totals by channel will always sum back to closed-won revenue at the deal level.
Capture the customer journey data needed for reliable revenue attribution
Reliable revenue attribution requires stitching anonymous interactions to known contacts and then to opportunities and closed-won deals with consistent IDs and timestamps.
Minimum viable data schema for B2B SaaS attribution
Start with a spreadsheet-level schema and only then automate. At minimum, capture these columns per touchpoint:
- Deal ID (CRM opportunity ID)
- Account or customer ID (stable across product and billing if possible)
- Contact ID (CRM contact/lead ID)
- Touchpoint timestamp (UTC, consistent format)
- Channel (Paid Search, Organic, Email, Webinar, Partner, Sales Outbound, etc.)
- Campaign ID (ad platform campaign ID or internal campaign key)
- Engagement type (ad click, content view, demo request, webinar attended, sales call)
- UTM parameters (source/medium/campaign/content/term when available)
- Conversion event (lead created, MQL, demo booked, trial started, activation event)
- Deal amount (closed-won revenue; if multi-year, decide whether to use first-year or total contract value)
Identity resolution rules that prevent “ghost” journeys
The most common break is anonymous-to-known stitching. Pick one rule and document it:
- Primary key: email address at the moment of conversion (form submit, demo request, trial signup).
- Secondary key: account domain, used carefully for multi-contact buying committees.
- Session linkage: cookie or device ID mapped to the first known email; keep the mapping table so you can reprocess history.
Expect missing touches: dark social sharing, offline word of mouth, sales conversations not logged, and content consumption from personal devices. The goal is not perfection, it is consistency: the same joining logic, the same lookback window, and the same touchpoint types counted every time.
Data quality checklist before you trust any model
- Deal close date exists and is not overwritten by later edits.
- UTM fields are captured at first conversion and not replaced by later visits.
- Campaign naming conventions are stable enough to group by channel and initiative.
- Sales touches are timestamped and tied to the opportunity, not only the contact.
- A lookback window is defined (for example, 90 or 180 days) so old touches do not crowd the model.
Choose the right revenue attribution model for your SaaS growth objectives
The right revenue attribution model is the one that matches your decision, sales cycle length, and data maturity, not the one that looks most sophisticated.
Model comparison in plain terms
- First-touch: credits the first known touchpoint; best for acquisition strategy and top-of-journey bets.
- Last-touch: credits the last touchpoint before conversion or close; best for conversion optimization and bottom-of-journey programs.
- Linear: splits equally across all touches; best when you want a neutral baseline.
- Time-decay: gives more credit to recent touches; best for long cycles where recency likely matters.
- U-shaped: emphasizes first and lead-conversion touches; best when capturing demand and converting to a lead are your primary levers.
- W-shaped: emphasizes first touch, lead conversion, and opportunity creation; best when opportunity creation is a meaningful milestone.
- 50/50: splits between first touch and last touch (or lead creation and close touch, depending on your definition); best when you want simplicity that still reflects both discovery and closing.
- Data-driven: learns weights from observed paths; best when you have high volume and clean data, and you can validate against experiments.
Decision matrix for selecting a model
| Objective | Sales cycle | Touchpoint complexity | Data maturity | Recommended model | Why it fits |
|---|---|---|---|---|---|
| Find best acquisition channels | Any | Low to medium | Basic UTMs + CRM | First-touch | Optimizes for discovery and lead origination |
| Improve lead-to-close conversion | Medium | Medium | Marketing + sales touches logged | Last-touch or time-decay | Highlights what closes and accelerates |
| Balance acquisition and closing credit | Medium to long | Medium | Consistent touchpoint capture | 50/50 | Simple, stable, and decision-friendly |
| Measure full-funnel contribution fairly | Long | High | High quality journey data | Linear (baseline) + time-decay | Baseline plus a recency sensitivity check |
| Allocate budget across programs and milestones | Long | High | Milestones tracked (lead, opp) | U-shaped or W-shaped | Matches how teams operationalize handoffs |
| Optimize with statistical weighting | Any (needs volume) | High | Very high, plus validation | Data-driven + incrementality tests | Reduces bias only when validated |
Implementation effort reality check
In practice, first-touch, last-touch, linear, and 50/50 are the models you can run in a spreadsheet this week, which is why I start there even for analytics-mature teams. Time-decay and milestone-shaped models are also spreadsheetable, but they require more consistent touchpoint and milestone logging to avoid noisy conclusions.

Calculate revenue attribution with a reusable spreadsheet template
A spreadsheet-ready attribution template should produce attributed revenue and ROI by channel and campaign while guaranteeing that deal-level weights sum to 100%.
Template columns you can copy into Sheets or Excel
- A: Deal_ID
- B: Close_Date
- C: Deal_Revenue (example: 10000)
- D: Touchpoint_Date
- E: Channel
- F: Campaign
- G: Touchpoint_Order (1, 2, 3... within deal)
- H: Model (First, Last, Linear, 50/50)
- I: Attribution_Weight (decimal, per touchpoint)
- J: Attributed_Revenue
- K: Campaign_Cost (optional, per campaign per period)
Core formulas
- Linear weight (per deal):
=1 / COUNTIF($A:$A, A2) - Attributed revenue:
=C2 * I2 - Channel revenue (pivot or SUMIFS):
=SUMIFS($J:$J, $E:$E, "Paid Search") - Campaign ROI (if you summarize revenue and cost):
=(Revenue - Cost) / Cost
For first-touch and last-touch, you can compute weights via helper columns:
- First-touch weight:
=IF(G2=1,1,0)whereGis touchpoint order per deal. - Last-touch weight:
=IF(G2=MAXIFS($G:$G,$A:$A,A2),1,0) - 50/50 weight: 0.5 on first touch and 0.5 on last touch, 0 otherwise. If first and last are the same touchpoint, weight should be 1.0 on that row:
=IF(AND(G2=1,G2=MAXIFS($G:$G,$A:$A,A2)),1,IF(OR(G2=1,G2=MAXIFS($G:$G,$A:$A,A2)),0.5,0))
Worked example for one $10,000 closed-won deal
Assume Deal D-100 closes for $10,000 and has four touchpoints in this order: (1) Paid Search ad click, (2) Organic blog visit, (3) Webinar attendance, (4) Sales email sequence. The attributed revenue by model becomes:
- First-touch: Paid Search = $10,000; others = $0
- Last-touch: Sales email = $10,000; others = $0
- Linear: each touch = $2,500
- 50/50: Paid Search = $5,000; Sales email = $5,000; others = $0
Now add costs at the program level. If Paid Search spend for the period was $3,000 and webinar cost allocation was $1,000, linear attribution would credit $2,500 to each touchpoint, which can make webinars look negative ROI even when they are primarily a conversion accelerator. This is why model choice is a decision, not a debate about which model is “true.”
Understand how attribution weighting changes channel-level revenue
Attribution weighting changes channel conclusions because each model encodes a different belief about how buyers progress from discovery to purchase.
Use one consistent journey to compare models
Take a typical B2B SaaS path: Paid Search click, Organic content return visit, Email nurture click, Webinar attended, Sales call booked, Closed-won. In a long sales cycle, the model you pick can flip your “best channel” ranking without any underlying performance change.
50/50 versus U-shaped 40/40/20
- 50/50 gives 50% to the first touch and 50% to the last touch (as defined). This favors discovery and closing.
- U-shaped (common variant) gives 40% to first touch, 40% to lead conversion, and splits the remaining 20% across middle touches. This favors discovery and the moment a contact becomes known.
In my own reporting work, U-shaped often makes content and webinars “look better” because they sit near lead conversion, while 50/50 often shifts credit back to whichever channel initiates demand and whichever motion closes it. Neither is wrong; each answers a different budget question.
Channel-level revenue share calculation
Once you have attributed revenue per touchpoint, compute channel share for a period:
- Channel share:
Channel_Attributed_Revenue / Total_Closed_Won_Revenue
If total closed-won revenue is $200,000 and your linear model attributes $60,000 to Organic, Organic share is 30%. Under first-touch, Organic might drop to 10% if Organic rarely initiates the first identifiable touch, even if it consistently supports evaluation.
Measure attribution performance with ROI, CAC, pipeline, and incrementality
Attribution becomes operational when attributed revenue is converted into ROI, CAC, pipeline contribution, and incrementality checks that reduce biased credit.
Translate attributed revenue into decision metrics
- Channel ROI:
(Attributed_Revenue - Channel_Cost) / Channel_Cost - Attributed CAC:
Channel_Cost / Attributed_Customerswhere a customer can be fractionally counted using the same weights - Attributed LTV:CAC: use your LTV definition, but keep it consistent across channels if you want comparisons
- Sourced pipeline vs influenced pipeline: sourced is a strict “opportunity source” rule; influenced is “any touch”
- Deal velocity by source: compare days-to-close across first-touch channels to understand cycle differences
Common attribution failure modes and how to control them
- Double-counting across reports: prevent by ensuring multi-touch attributed revenue sums to closed-won at the deal level.
- Channel definition drift: lock a channel taxonomy and a mapping table from UTMs and campaign names to channels.
- Sales activity swamping the model: decide whether sales touches are included, and if included, cap the number of touches or use milestone weighting.
- Survivorship bias: your dataset only includes deals that progressed; track lost deals too so you can compare path patterns.
Incrementality checks that keep you honest
To get closer to incremental revenue, borrow simple experimental thinking:
- Geo or segment holdouts: pause a channel in a subset and compare conversion to a control group.
- Campaign-level lift tests: run an on-off schedule and track changes in qualified pipeline and closed-won, not just clicks.
- Before/after with matched cohorts: if experiments are impossible, match accounts by firmographics and baseline intent and compare outcomes.
Attribution models explain “who to credit” under a rule; incrementality tests estimate “what actually changed.” Using both prevents you from funding channels that merely show up late in journeys.
Operationalize revenue attribution across your B2B SaaS growth workflow
Operational revenue attribution works when tracking, CRM hygiene, and recurring reviews are run as a system rather than a one-off dashboard project.
A practical implementation sequence
- Define the unit of value: first-year revenue, monthly recurring revenue, or total contract value, and keep it consistent.
- Lock the touchpoint taxonomy: channels, campaigns, touchpoint types, and the lookback window.
- Instrument capture: ensure UTMs, campaign IDs, and conversion events are stored at the first known conversion and retained.
- Enforce CRM consistency: required fields for opportunity source, stage timestamps, and contact-to-account relationships.
- Publish two views: sourced pipeline and attributed revenue under the chosen revenue attribution model.
- Review monthly: identify channel mix shifts, model sensitivity (compare linear vs 50/50), and data gaps.
Where product analytics complements attribution
Marketing attribution tells you how revenue was credited across touches, but it often misses what happened inside the product after signup or trial. This is where product event tracking and user segmentation add context: you can see whether a channel drives users who activate, adopt key features, and retain. Founder OS can support that layer by tracking user actions, building user profiles tied to behavior, and surfacing GTM reporting that connects acquisition cohorts to in-product engagement, without positioning itself as a replacement for your CRM or ad platform reporting.
A lightweight governance rule that prevents thrash
Change your model only when the business question changes. I typically keep one “primary” model for quarter-over-quarter budget decisions (often 50/50 or linear) and use first-touch or last-touch as diagnostic lenses, not as competing sources of truth.
| Model | Best for | Main bias | Spreadsheet complexity |
|---|---|---|---|
| First-touch | Channel discovery bets | Over-credits top-of-journey | Low |
| Last-touch | Conversion optimization | Over-credits closing motions | Low |
| Linear | Neutral baseline | Over-credits noise touches | Low |
| 50/50 | Budget decisions with simplicity | Ignores mid-funnel assists | Low |
| U-shaped / W-shaped | Milestone-driven GTM teams | Assumes milestones are causal | Medium |
| Time-decay | Long cycles, recency sensitivity | Under-credits early demand creation | Medium |
FAQ
If you want to make your revenue attribution model more decision-ready, strengthen the layer it often misses: what users do after they arrive. Founder OS helps B2B SaaS teams track product events, build behavioral user segments, and review GTM reporting so you can connect acquisition cohorts to activation and feature adoption, then use those insights alongside your CRM and attribution reporting. For related frameworks, see revenue attribution, how to analyze marketing data, a KPI-first approach to analytics events tracking, and a practical plan for digital product analytics.

Written by James Walker
Product Marketing Manager | Helping SaaS teams improve activation, onboarding, and user engagement.
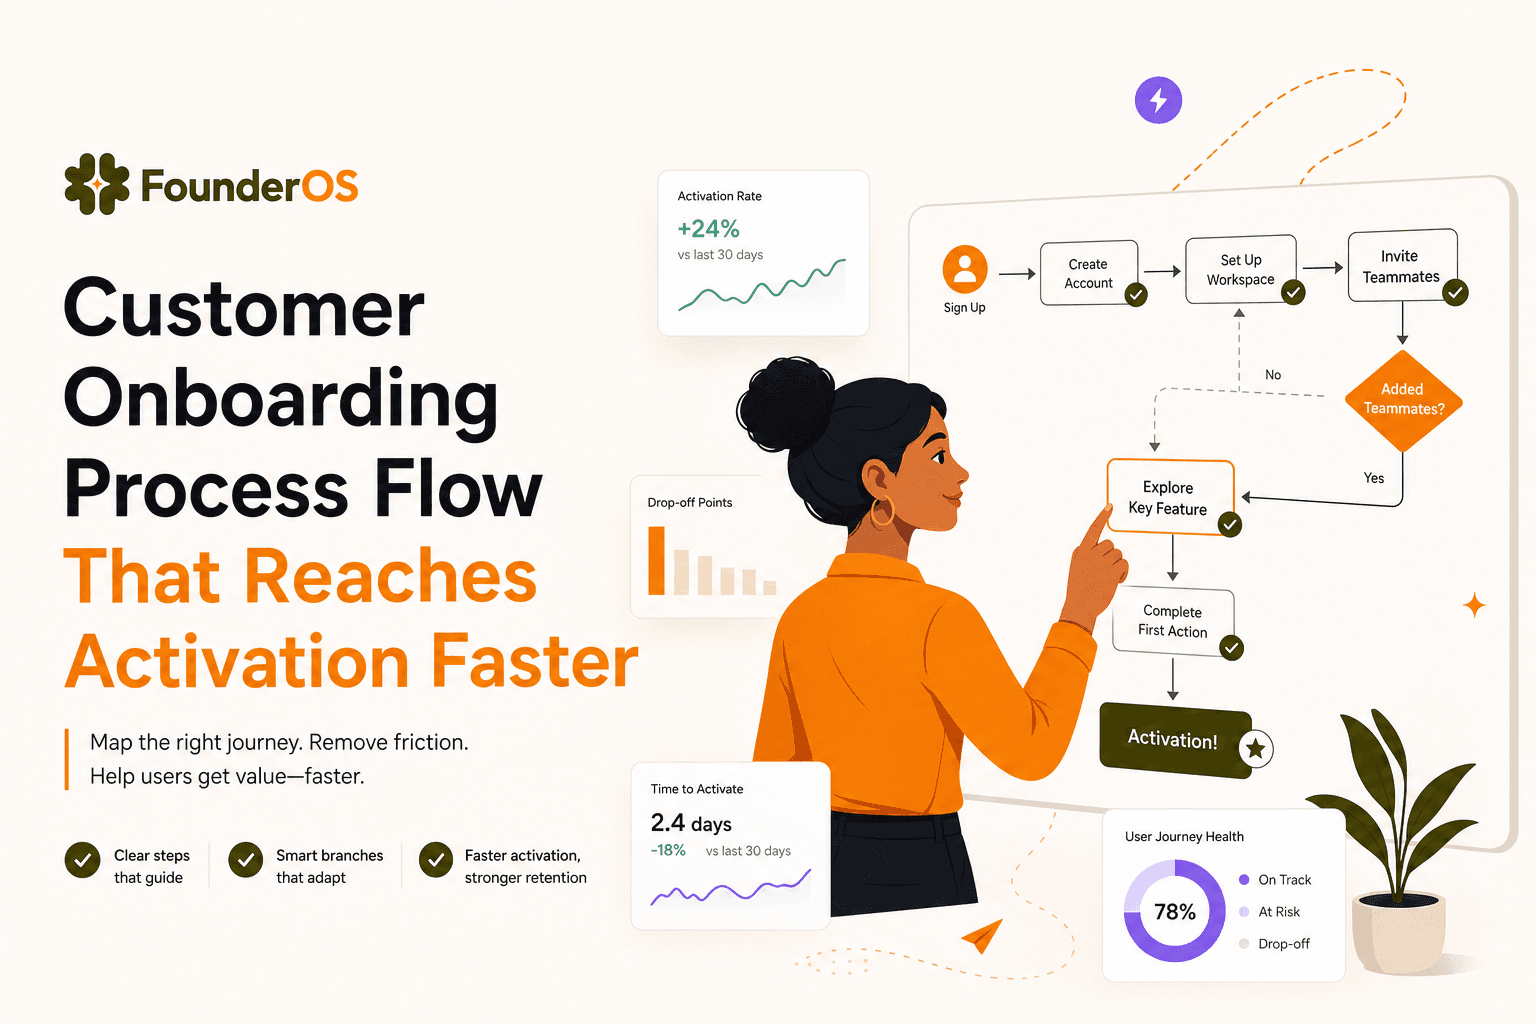
Customer Onboarding Process Flow That Reaches Activation Faster
Build a measurable customer onboarding process flow for B2B SaaS with stages, branching, and analytics to cut time-to-value and lift activation.

Flow Builder for SaaS Onboarding - The Activation-First Blueprint to Build and Measure Flows
Use a flow builder to design onboarding that drives activation, with triggers, segmentation, guardrails, and measurement that proves lift.
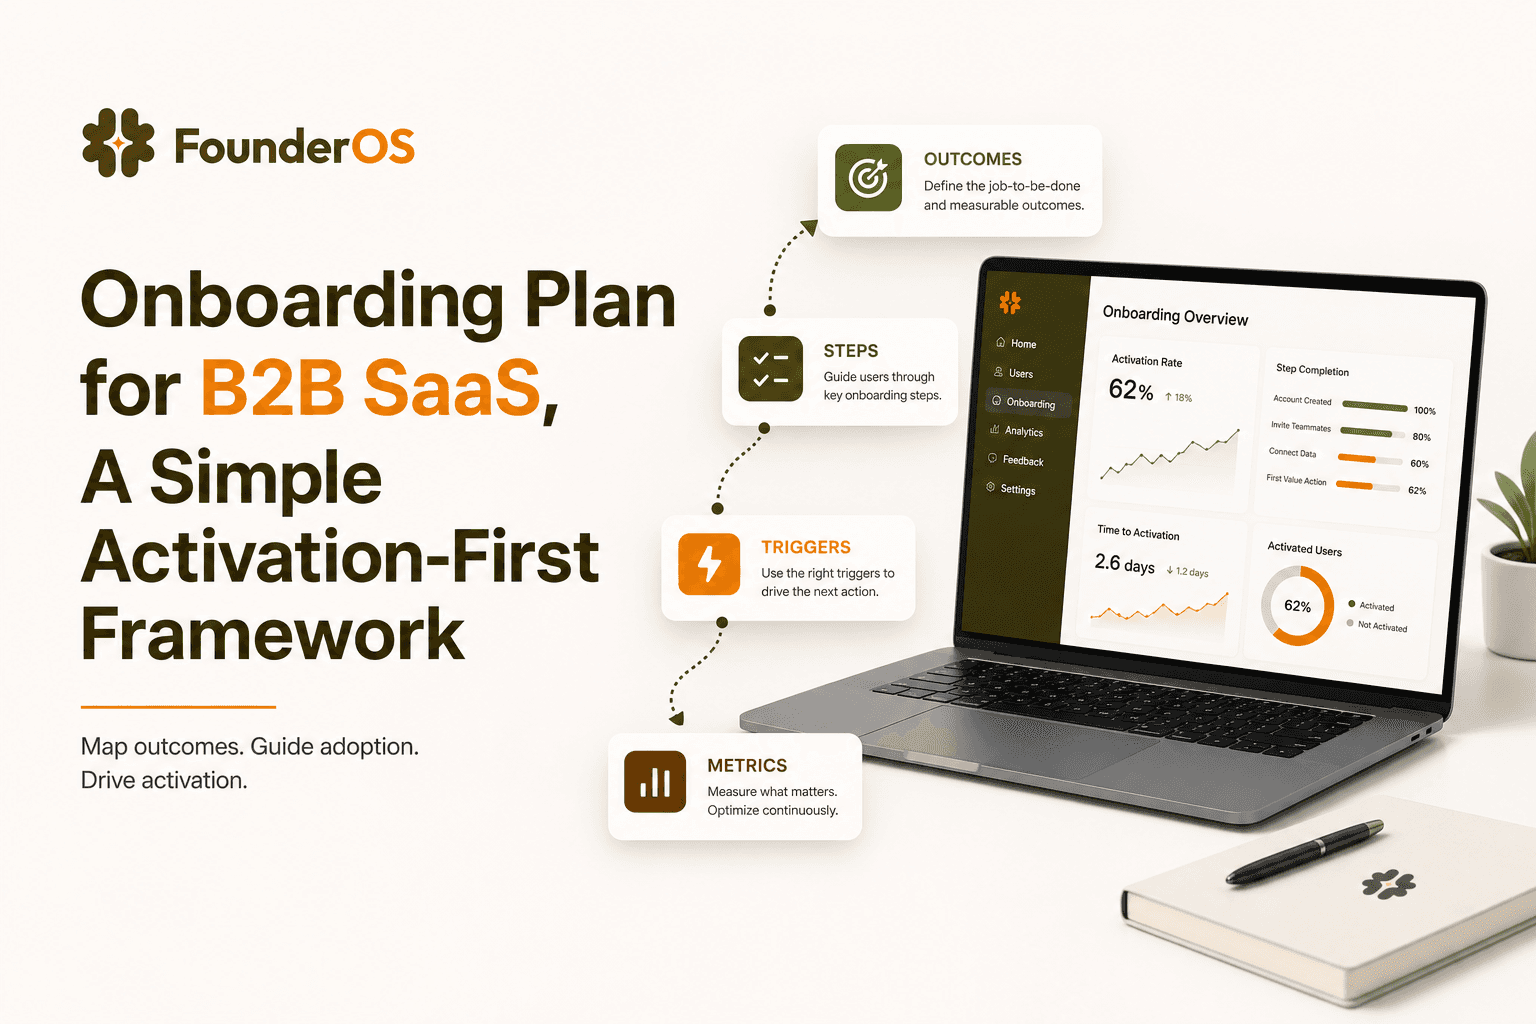
Onboarding Plan for B2B SaaS, A Simple Activation-First Framework
Learn a simple onboarding plan framework to reach the first aha moment faster with no-code in-app flows, triggers, and measurement.