
Funnel De Conversion Marketing For B2B SaaS, A Measurement-First Optimization Framework

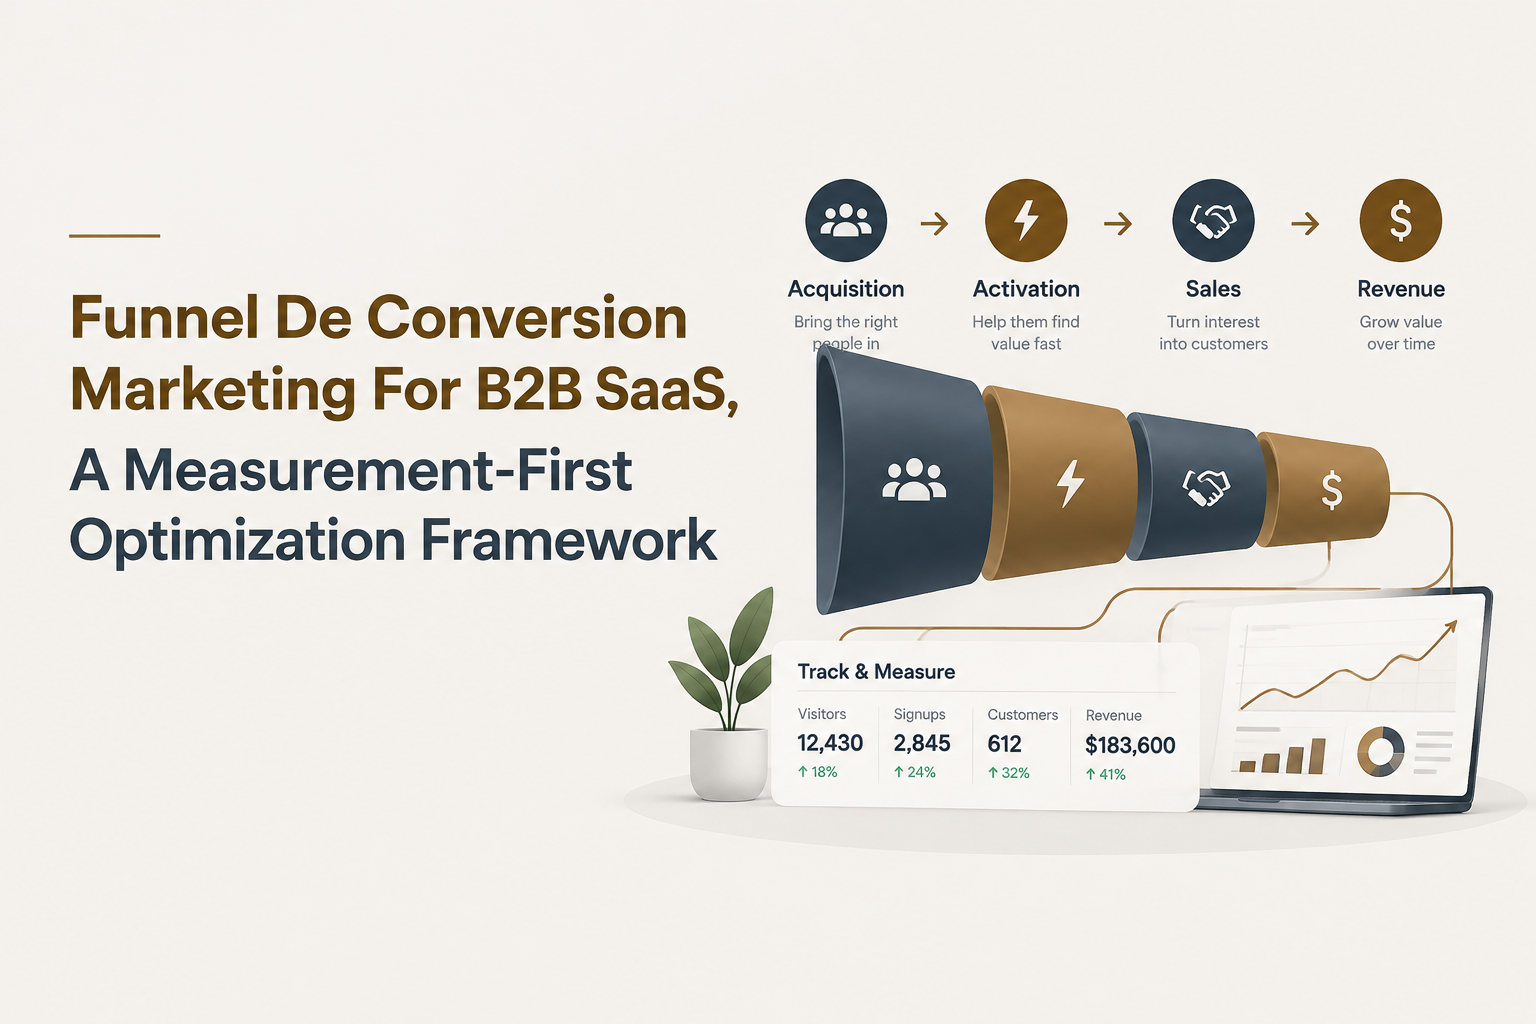
Funnel de conversion marketing is a measurement system that connects acquisition activity to activation, sales progress, and revenue outcomes. For B2B SaaS teams, the goal is not to collect more dashboard metrics. The goal is to define each meaningful transition, track the user events behind it, calculate conversion consistently, and identify the bottleneck that deserves attention first.
- Define marketing, product, and revenue transitions before choosing metrics.
- Use consistent events, user segments, attribution rules, and handoff criteria across the journey.
- Prioritize experiments from observed behavior and revenue impact, not generic conversion advice.
Define the Funnel De Conversion Marketing System Before Measuring
A useful funnel de conversion marketing system begins with clear definitions for awareness, consideration, activation, and revenue. Without those definitions, teams often compare a page view with a qualified opportunity or treat a signup as proof of product value.
Separate three related views:
- Marketing journey: reaches a qualified visitor, captures an inquiry, and produces a sales-ready lead.
- Conversion journey: moves a new account from signup through setup and first meaningful product value.
- Sales journey: turns qualified demand into an opportunity, customer, expansion, or renewal.
Map one observable event to each transition. A practical B2B SaaS map might include:
| Business moment | Example event | Owner | Success question |
|---|---|---|---|
| Awareness | Qualified landing-page visit | Marketing | Which channel brings relevant traffic? |
| Consideration | Pricing view or demo request | Marketing and sales | Which message creates intent? |
| Activation | First core workflow completed | Product | Do new users reach value? |
| Revenue | Qualified opportunity or paid conversion | Sales and finance | Which behaviors predict commercial value? |
Write an entry rule and an exit rule for every stage. For example, an account enters activation after signup and exits activation when a user completes the core workflow within a defined period. The period must be fixed before analysis, because changing it after seeing results can create misleading comparisons.
I have found that this mapping exercise exposes more measurement problems than dashboard work does. If a team cannot explain what “activated” means in one sentence, its optimization backlog is usually premature.
Build Full-Funnel Measurement Around User Events
Full-funnel measurement requires a shared event dictionary, stable identity rules, useful segments, and explicit handoffs between teams. Page visits alone cannot explain why a user progresses or stops.
1. Create an event dictionary
Use a consistent naming pattern such as signup_completed, workspace_created, core_action_completed, and demo_requested. Each event should document the actor, account, timestamp, source, plan, and relevant properties. Avoid vague events such as “engaged” unless the underlying action is defined.
2. Connect people to accounts
B2B SaaS analysis often fails when individual activity and account revenue are stored separately. Preserve both identifiers so you can answer two questions: which users perform the behavior, and which accounts generate commercial value? Deduplicate repeated events and record whether an action is a first occurrence or a repeat.
3. Segment by behavior and context
At minimum, compare new versus returning users, acquisition source, company size, plan, region, device, and sales status. Add behavioral groups such as users who completed setup, users who invited a teammate, and users who stopped after the first session. Segment definitions should be reproducible, not manually selected for each report.
4. Define handoffs
Marketing should pass a lead when the agreed qualification conditions are met. Product should notify customer-facing teams when an account reaches a high-value behavior or shows disengagement. Sales should return disposition data, such as qualified, unqualified, closed-won, or closed-lost, so marketing can assess quality rather than volume.
Founder OS can support this workflow through Product Tracking, User Profile Tracking and User Segmentation, and GTM Report workflows. The important design principle is not the tool itself: every report must connect an event, a segment, an owner, and a decision.
Calculate Funnel Performance With Explicit SaaS Math
Conversion performance becomes actionable when every rate uses a stated population, time window, and numerator. A percentage without those three details cannot reliably guide a decision.
Use these formulas:
- Conversion rate: users completing the next action divided by eligible users entering the current step.
- Drop-off rate: 1 minus the conversion rate for that step.
- Customer acquisition cost: attributable acquisition and sales spend divided by new customers.
- Revenue per visitor: attributable new revenue divided by eligible visitors.
Consider a fictional example used only to demonstrate the method: 10,000 qualified visitors produce 1,000 signups, 300 activated accounts, 60 opportunities, and 18 new customers during one measurement window.
| Transition | Calculation | Conversion | Drop-off |
|---|---|---|---|
| Visitor to signup | 1,000 / 10,000 | 10% | 90% |
| Signup to activation | 300 / 1,000 | 30% | 70% |
| Activation to opportunity | 60 / 300 | 20% | 80% |
| Opportunity to customer | 18 / 60 | 30% | 70% |
The largest percentage drop is not automatically the best opportunity. The signup-to-activation step affects 700 accounts, while the opportunity-to-customer step affects 42 opportunities. Estimate impact before prioritizing: recovered users multiplied by the probability of reaching revenue multiplied by expected revenue per customer.
For example, improving activation from 30% to 35% would create 50 additional activated accounts from the same 1,000 signups. Improving opportunity-to-customer from 30% to 35% would create 3 additional customers from 60 opportunities. The second change may still be more valuable if contract value or sales cost differs, which is why revenue context belongs in the analysis.
For acquisition analysis, preserve source and campaign identifiers through signup and account creation. That allows teams to analyze marketing data against activation and revenue instead of optimizing clicks alone.
Diagnose Drop-Offs With a Symptom-to-Experiment Workflow
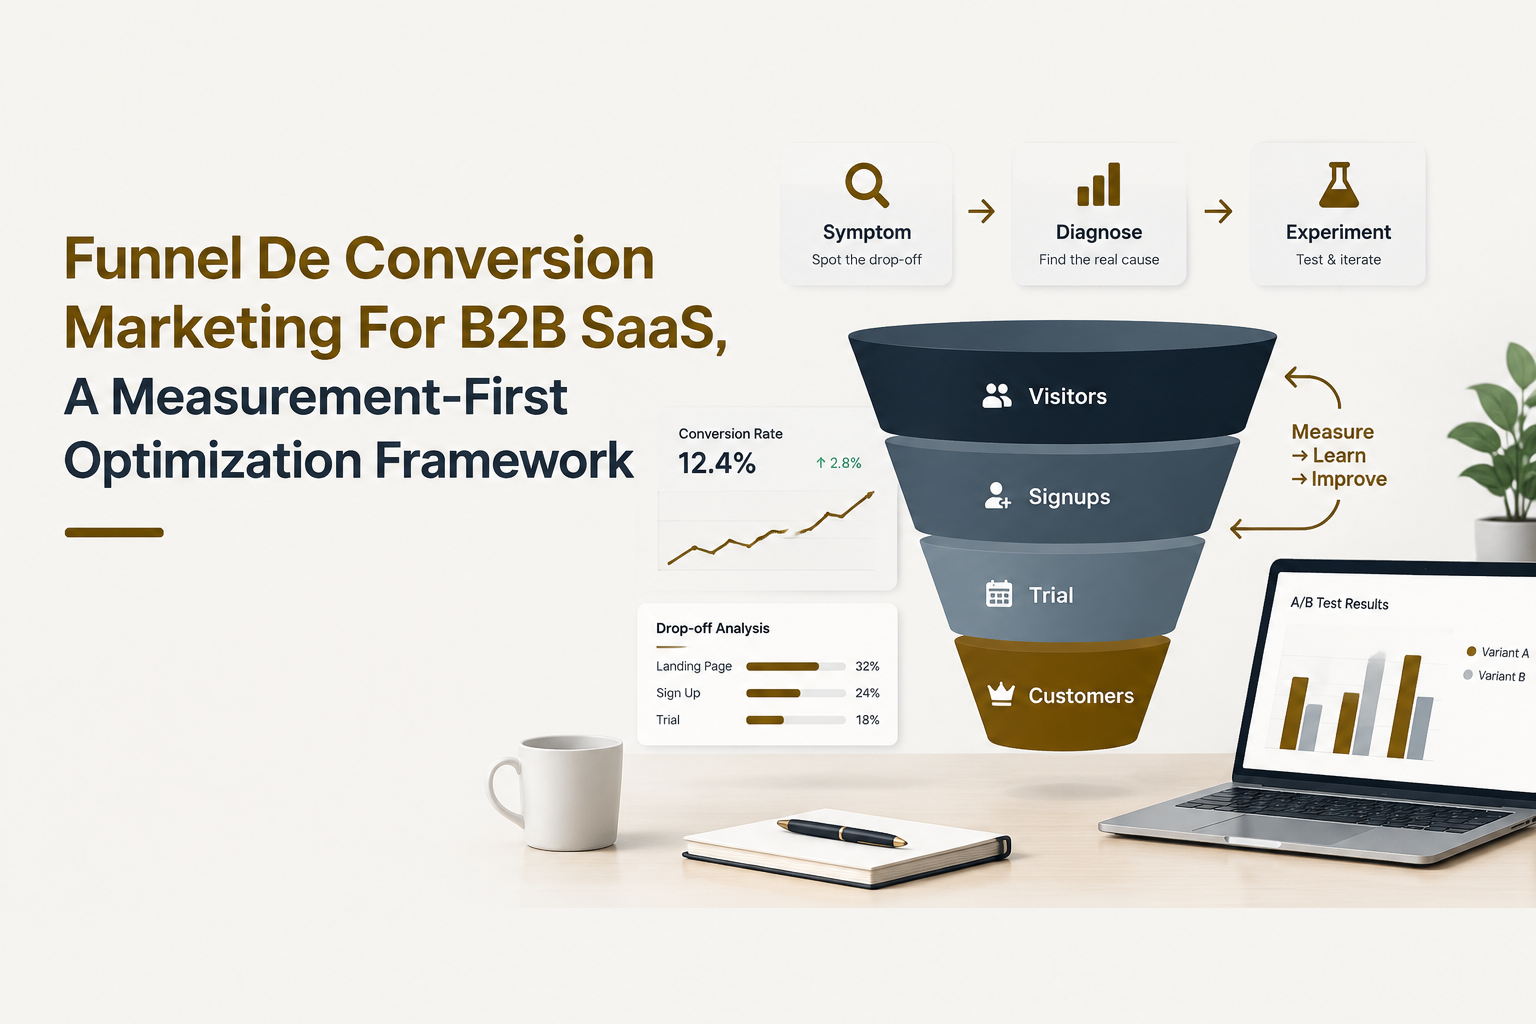
Effective funnel de conversion marketing links each symptom to behavioral evidence, a focused experiment, and a decision rule. A low rate is a signal for investigation, not a diagnosis.
| Symptom | Evidence to inspect | Potential experiment | Decision rule |
|---|---|---|---|
| Many visits but few signups | Source, landing-page event, device, form errors | Test message and form friction for one priority segment | Choose the version that improves qualified signup rate without reducing activation quality |
| Signups stall before activation | Setup completion, time to first value, skipped steps | Shorten onboarding and surface the core action earlier | Require a lift in activation, not merely tour completion |
| Activation is strong but opportunities are weak | Plan fit, usage depth, account size, sales acceptance | Adjust qualification and create a behavior-based sales alert | Measure accepted opportunities and pipeline value |
| Customers disengage after adoption | Recency, feature usage, team activity, support events | Trigger targeted education or re-engagement for at-risk accounts | Evaluate return activity and retention, not email opens alone |
Prioritize with evidence
Rank each experiment using affected population, expected commercial value, confidence in the diagnosis, implementation effort, and learning value. A simple score can be expressed as impact multiplied by confidence divided by effort. Keep the inputs ordinal, such as low, medium, and high, if precise financial estimates are unavailable.
Before launching, state the primary metric, guardrail metric, audience, duration, and stopping rule. For an activation experiment, the primary metric might be completed core workflows per eligible signup. Guardrails could include support requests, trial cancellation, or sales-qualified rate. Do not declare success because a secondary click metric moved.
For deeper implementation guidance, use conversion funnel analysis to locate the break, then apply conversion funnel optimisation to test the most credible fix. Teams connecting behavior to commercial outcomes can also review revenue attribution and building sales funnels.

Written by James Walker
Product Marketing Manager | Helping SaaS teams improve activation, onboarding, and user engagement.
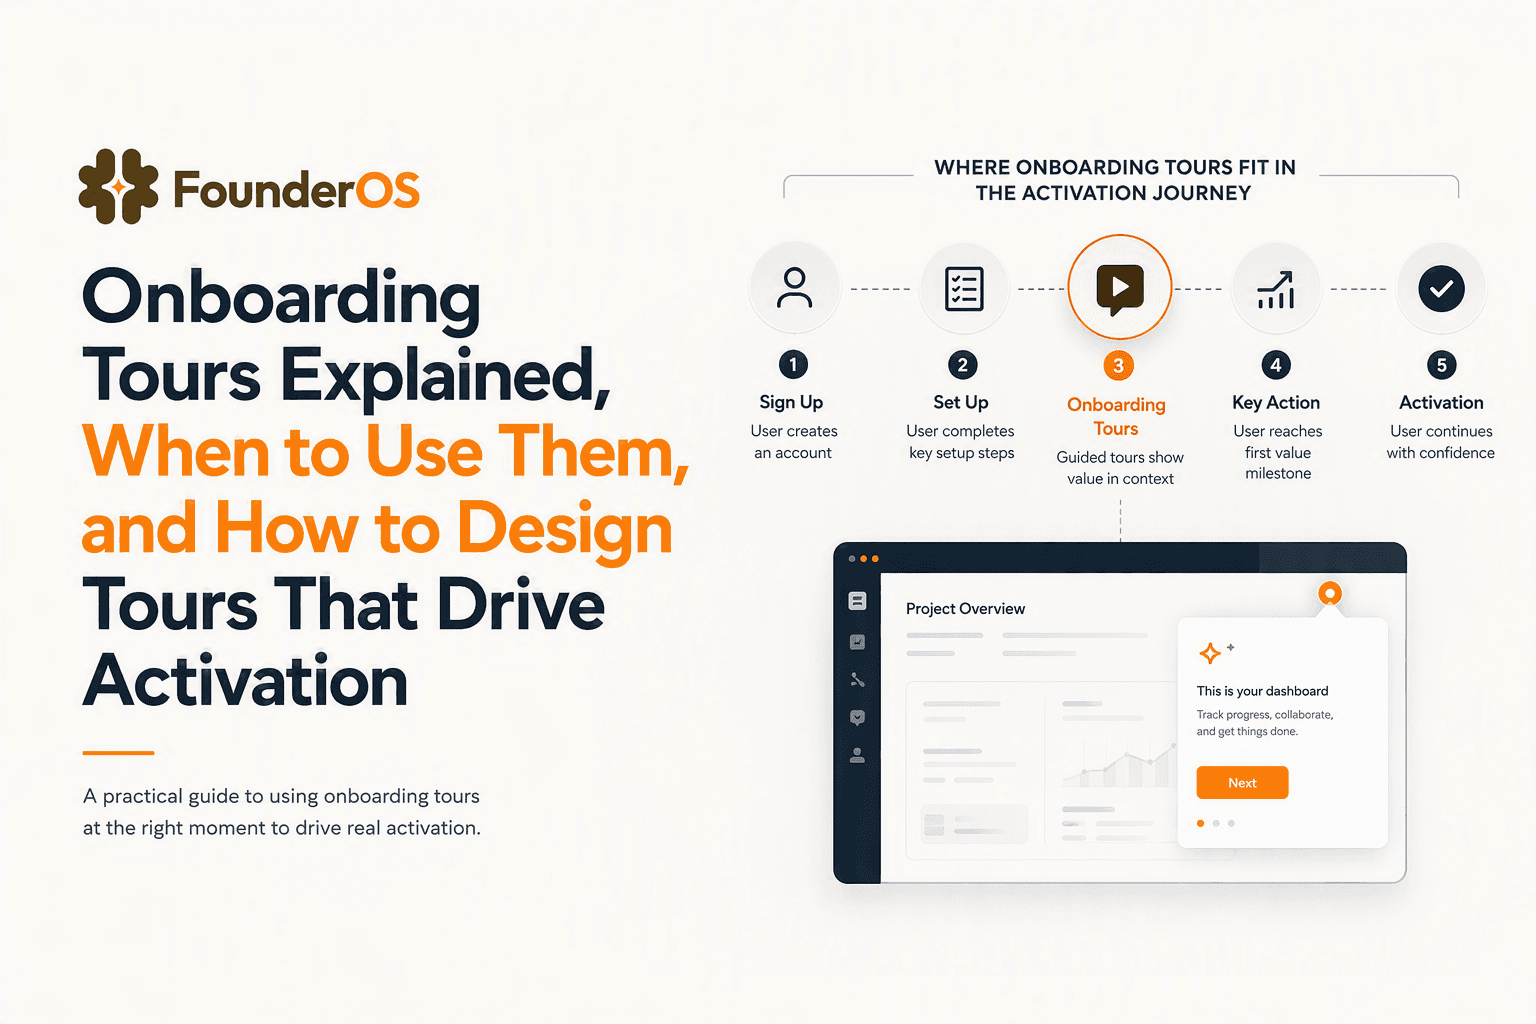
Onboarding Tours Explained, When to Use Them, and How to Design Tours That Drive Activation
Learn what onboarding tours are, when to use them, and how to design and measure onboarding tours that improve activation in B2B SaaS.

Fix Your Customer Onboarding Platform Before It Bleeds Activation and Support Time
A practical blueprint to fix your customer onboarding platform, cut time-to-value, and reduce support load with measurable onboarding flows.

Analytics Events Tracking for B2B SaaS, A KPI-First Framework
Analytics events tracking for B2B SaaS: map KPIs to events, design clean schemas, pick the right implementation, and build a copy-ready event library.